WaleedGhuman SMT/MSS/OF/ModelsAt the core of the WaleedGhuman SMT/MSS/OF/Models indicator lies a sophisticated Smart Money Technique (SMT) Divergence Engine that operates across specific distinct timeframes simultaneously. The result is a comprehensive market analysis tool that bridges the gap between macro market structure and micro price action, delivering institutional-grade divergence analysis in an accessible, visually intuitive format.
دورات

Elliott Wave Expert AdvisorElliott Wave Expert Advisor - Professional Wave Analysis Tool
OVERVIEW
--------
The Elliott Wave Expert Advisor is a comprehensive Pine Script indicator designed for TradingView that automates Elliott Wave analysis and generates high-probability trading signals. Built on Ralph Nelson Elliott's Wave Principle, this indicator identifies impulse wave patterns, validates them against strict Elliott Wave rules, and provides precise entry points with calculated risk management levels.
CORE FUNCTIONALITY
------------------
1. TREND DETECTION
- Dual Moving Average system (Fast/Slow MA)
- MACD confirmation for trend strength
- Automatic trend classification (Uptrend/Downtrend/Sideways)
- Only generates signals aligned with main trend
2. SWING POINT DETECTION
- Automatic pivot high/low identification
- Configurable sensitivity (lookback periods)
- Minimum swing size filtering to reduce noise
- ZigZag visualization connecting swing points
3. WAVE IDENTIFICATION
- 5-wave impulse pattern recognition (1-2-3-4-5)
- 3-wave corrective pattern detection (A-B-C)
- Wave labels displayed on chart
- Color-coded validation status (Blue = Valid, Orange = Pending)
4. ELLIOTT WAVE RULES VALIDATION
Strictly enforces three cardinal rules:
- Rule 1: Wave 2 never retraces more than 100% of Wave 1
- Rule 2: Wave 3 is never the shortest impulse wave
- Rule 3: Wave 4 never overlaps Wave 1 price territory
5. FIBONACCI ANALYSIS
- Automatic Fibonacci retracement calculations (23.6%, 38.2%, 50%, 61.8%, 78.6%)
- Fibonacci extension projections (100%, 161.8%, 261.8%)
- Wave 3 and Wave 5 target projections
- Fibonacci-based Take Profit levels
6. SIGNAL GENERATION
- Entry signals at Wave 2 completion (catch Wave 3)
- Entry signals at Wave 4 completion (catch Wave 5)
- Automatic Stop Loss placement below/above pivot points
- Multiple Take Profit targets (TP1 at 1.618 extension, TP2 at Wave 5 projection)
- Risk/Reward ratio calculation and filtering
- Minimum R:R threshold (default 1.5:1)
7. VISUAL ELEMENTS
- Pivot markers (H/L) showing swing highs and lows
- ZigZag lines connecting swing points
- Wave number labels (1-2-3-4-5) with validation colors
- Entry signal arrows (Green = BUY, Red = SELL)
- Stop Loss lines (Red dashed)
- Take Profit lines (Green dashed and dotted)
- Real-time status dashboard showing:
* Number of pivots detected
* Wave count progress (X/5)
* Pattern validation status
* Market trend direction
* Signal active status
* Helpful tips and guidance
OPTIMAL USAGE
-------------
• Timeframes: H1, H4, D1 (avoid M1-M5 due to noise)
• Markets: Forex majors (EUR/USD, GBP/USD), Gold (XAU/USD), Major Cryptocurrencies
• Market Conditions: Strong trending markets (avoid ranging/sideways conditions)
• Risk Management: Never risk more than 1-2% per trade
• Position Sizing: Based on calculated Stop Loss distance
CONFIGURATION PARAMETERS
------------------------
Trend Detection:
- MA Fast Period (default: 20)
- MA Slow Period (default: 50)
- MACD settings (12/26/9)
Swing Detection:
- Pivot Lookback Left/Right (default: 10/10, reduce to 5/5 for M15)
- Min Swing Size % (default: 0.1%, reduce to 0.05% for M15)
Wave Detection:
- Min Wave Size % (default: 0.5%, reduce to 0.2-0.3% for smaller timeframes)
Risk Management:
- SL Buffer % (default: 0.1%)
- TP1 Fibonacci Ratio (default: 1.618)
- Min Risk/Reward (default: 1.5)
Visualization:
- Toggle visibility for MAs, ZigZag, Wave Labels, Signals, SL/TP
- Customizable colors for all elements
- Optional trend background coloring
IMPORTANT NOTES
---------------
• Elliott Wave analysis is subjective - this indicator implements one specific interpretation
• Works best in trending markets; automatically suppresses signals in sideways conditions
• Signals are NOT repainting after pivot confirmation
• Not a "holy grail" - combine with other analysis and proper risk management
• Requires patience - quality setups are infrequent but high-probability
• Always backtest on historical data before live trading
ELLIOTT WAVE THEORY BACKGROUND
------------------------------
Elliott Wave Theory, developed by Ralph Nelson Elliott in the 1930s, proposes that market prices move in predictable wave patterns driven by investor psychology. An impulse wave consists of five sub-waves (three in the trend direction, two corrections), followed by a three-wave correction. This indicator automates the identification of these patterns and validates them against Elliott's original rules.
DISCLAIMER
----------
This indicator is for educational and informational purposes only. Past performance does not guarantee future results. Always conduct your own analysis and never trade with money you cannot afford to lose. The indicator provides signals based on technical analysis patterns and does not constitute financial advice.
VERSION
-------
v1.0 - Initial Release
Pine Script v5
Created: 2024
SUPPORT
-------
For detailed usage instructions, refer to the included documentation:
- usage_guide.md - Complete user manual with examples
- elliott_rules.md - Elliott Wave theory reference and implementation details

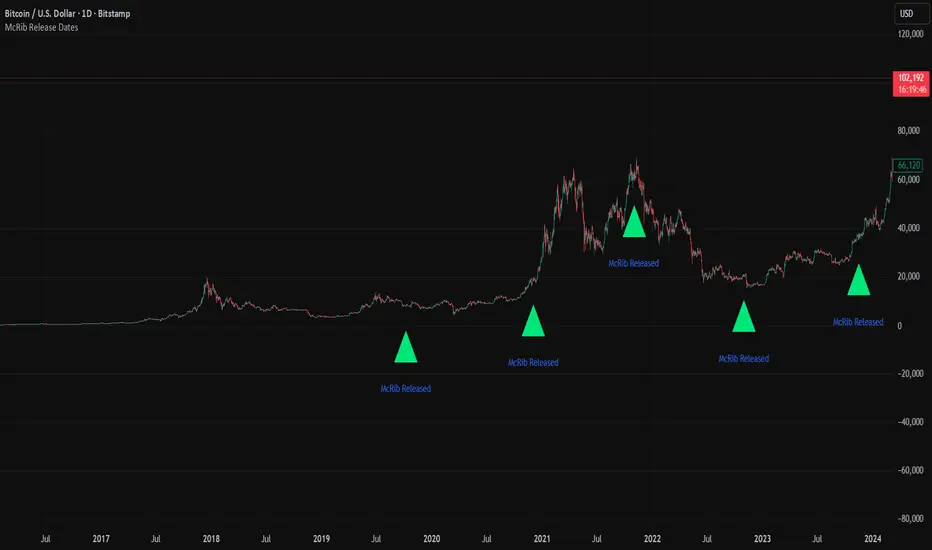
McRib Release Dates IndicatorMarks the McRib release dates from 2019-Current. Previous dates from Pre-2019 weren't clear enough to include accurate info. Goated Indicator. 67 😎
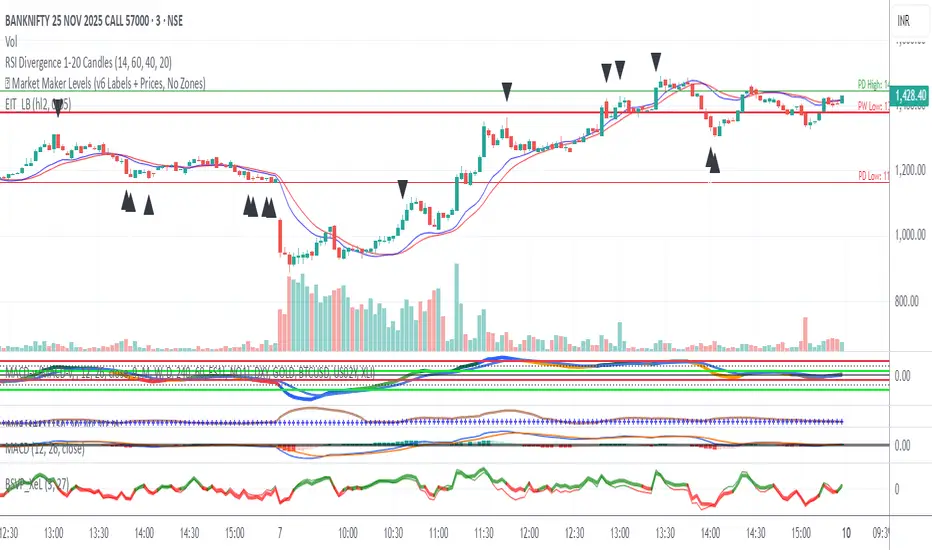
RSI Divergence 1-20 Candlesthis is a rsi divergence indicator used to mark divergence on the candle for knowing the trend
Victoria Overlay - HTF 200 + VWAP + ATR Stop + MA TrioConsolidated road to minions
Buy Setup:
EMA1 crosses above SMA3.
RSI confirms above 50.
Volume increasing (confirming momentum).
Candle closes above SMA1 base.
Sell Setup:
EMA1 crosses below SMA3.
RSI drops below 50 or exits overbought.
Volume confirms (declining or reversing).
Candle closes below SMA1 base.
Tips:
Think of EMA1 as the scalper’s trigger.
SMA3 is your momentum check.
SMA1 (base) = short-term bias.
Avoid entries during low-volume chop.
Use for day trades or tight scalps; exits happen fast.
Overlay (Smoothed Heikin Ashi + Swing + VWAP + ATR Stop + 200-SMA)
Purpose: Multi-layer trend confirmation + clean structure.
Type: Swing alignment tool.
🟩 BUY / CALL Conditions
Green “Buy (Gated)” arrow appears.
Price is above VWAP, above 200-SMA, and above ATR stop.
ATR stop (green line) sits under price → support confirmed.
Heikin-Ashi candles are green/lime.
Bias label says “Above VWAP | Above 200 | Swing Up”.
🟥 SELL / PUT Conditions
Red “Sell (Gated)” arrow appears.
Price is below VWAP, below 200-SMA, and below ATR stop.
ATR stop (red line) sits above price → resistance confirmed.
Heikin-Ashi candles are red.
Bias label says “Below VWAP | Below 200 | Swing Down”.
Exit / Risk Control:
Close position when price crosses ATR stop.
If Heikin candles flip color, momentum is reversing.
Best Use Cases:
For next-day or multi-hour swing entries.
Use ATR Stop for dynamic stop loss.
Stay out when the bias label is mixed (e.g. “Above VWAP | Below 200 | Swing Down”).
Pro Tip:
On big news days, let VWAP reset post-open before acting on arrows — filters fake signals.
RSI Panel Pro (v6)
Purpose: Strength + exhaustion confirmation.
Type: Momentum filter.
Key Levels:
Overbought: 80+ → take profits soon.
Oversold: 20– → watch for bounce setups.
Bull regime: RSI above 60 = momentum strong.
Bear regime: RSI below 40 = weakness.
Buy / Entry Signals:
RSI crosses up from below 40 or 20.
RSI line is above RSI-EMA (gray line).
Higher timeframe RSI (if used) is also rising.
Trim / Exit:
RSI drops under 60 after being strong.
RSI crosses below its EMA.
Sell / Put Setup:
RSI fails at 60 or drops below 40.
RSI crosses under EMA after a bounce.
Tips:
Pair RSI panel with Victoria Overlay — only take gated buys when RSI confirms.
RSI < 40 but above 20 = “loading zone” for reversals.
RSI > 70 = overextended → wait for confirmation before entering.
Combined Execution Rules
Goal What to Watch Action
Entry (CALL) EMA1 > SMA3, Buy (Gated) arrow, RSI rising > 50 Buy call / open long
Entry (PUT) EMA1 < SMA3, Sell (Gated) arrow, RSI < 50 Buy put / open short
Exit Early Price crosses ATR stop or RSI flips under EMA Exit trade / protect gains
Trend Filter VWAP + 200-SMA alignment Only trade in that direction
Avoid Trades Conflicting bias label or low volume Stay flat
Pro Tips
VWAP → Intraday mean: above = bullish control, below = bearish control.
ATR Stop → Dynamic trailing stop: never widen it manually.
Smoothed Heikin-Ashi → filters noise: trend stays until color flips twice.
RSI Panel → confirms whether to hold through pullbacks.
If RSI and Overlay disagree — wait, not trade.

Average Price Calculator / VisualizerDCA Average Price Calculator - Visualize Your Breakeven & TP!
Ever wished you could visualize your trades and instantly see your average entry price right here on TradingView? Especially if you're a DCA (Dollar-Cost Averaging) trader like me, tracking multiple entries can be a hassle. You're constantly switching to a spreadsheet or calculator to figure out your breakeven and take-profit levels. Well I've developed this DCA Average Price Calculator to solve exactly that problem, bringing all your position planning directly onto your chart.
What It Does
This indicator is a interactive tool designed to calculate the weighted average price of up to 10 separate trade entries. It then plots your crucial breakeven (average price) and a customizable take-profit target directly on your chart, giving you a clear visual of your position.
Key Features
Up to 10 Order Entries: Plan complex DCA strategies with support for up to ten individual buys.
Flexible Size Input: Enter your position size in either USD Amount or Number of Shares/Contracts. The script is smart enough to know which one you're using.
Instant Average Price Calculation: Your weighted average price (your breakeven point) is calculated and plotted in real-time as a clean yellow line.
Customizable Take-Profit Target: Set your desired profit percentage and see your take-profit level instantly plotted as a green line.
Detailed On-Chart Labels: Each order you plot is marked with a detailed label showing the entry price, the number of shares purchased, and the total USD value of that entry.
Clean & Uncluttered UI: The main Average and TP labels are intelligently shifted to the right, ensuring they don't overlap with your entry markers, keeping your chart readable.
How to Use It - Simple Steps
Add the indicator to your chart.
Open the script's 'Settings' menu.
In the 'Take Profit' section, set your desired profit percentage (e.g., 1 for 1%).
Under the 'Orders' section, begin filling in your entries. For each 'Order #', enter the Price.
Next, enter the size. You can either fill in the 'Size (USD)' box OR the '/ Shares' box. Leave the one you're not using at 0.
As you add orders, the 'Avg' (yellow) and 'TP' (green) lines, along with the blue order labels, will automatically appear and adjust on your chart!
Who Is This For?
DCA Traders: This is the ultimate tool for you!
Position Traders: Keep track of scaling into a larger position over time.
Manual Backtesters: Quickly simulate and visualize how a series of buys would have played out.
Any Trader who wants a quick and easy way to calculate their average entry without leaving TradingView.
I built this tool to improve my own trading workflow, and I hope it helps you as much as it has helped me. If you find it useful, please consider giving it a 'Like' and feel free to leave any feedback or suggestions in the comments!
Happy trading

OPTION DOMOPTION DOM
This script tell you abot option max pain where dealer needs to reverse and give direction of optio buy and sel plus option dom.

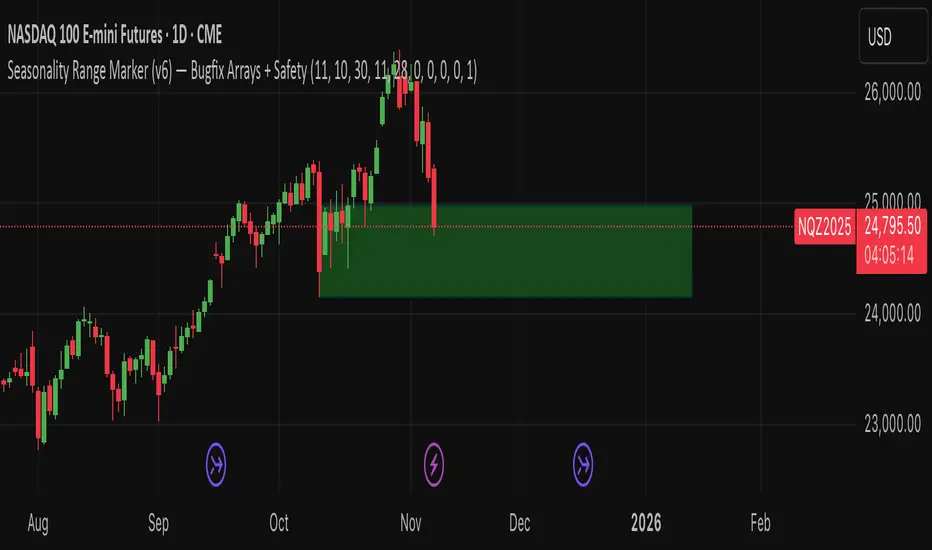
Seasonality Range Marker For better Seasonality Analysation. To see Seasionality patterns in the chart.
VSA No Supply by MashrabNo Supply Signal created by Mashrab
Hi everyone! This indicator helps you find low-risk entry points during an existing uptrend.
Its main job is to spot "quiet" pauses in a stock's advance, right before it's ready to continue its upward move.
What's the Big Idea?
Think of a stock in an uptrend like someone climbing a staircase. They can't sprint to the top all at once! Eventually, they need to pause, catch their breath, and then continue climbing.
This indicator helps you find that "catch your breath" moment. It looks for a specific signal that shows all the sellers are gone (what we call "No Supply"). When there's no one left to sell, the stock is much more likely to go up.
How It Works (The Signals)
The indicator gives you two simple signals on your chart:
1. The "Get Ready" Signal (Grey Dot)
The indicator is always checking to make sure the stock is in a general uptrend. When it spots a Grey Dot, it's telling you: "Hey, the stock just had a quiet pullback day. Pay attention!"
This dot only appears if the bar meets four conditions:
It's a "down" bar (closed lower than it opened).
It has low volume (this is key! It shows sellers aren't interested).
It has a narrow range (it was a quiet, low-volatility bar).
It closed in the top half of its range (buyers easily stepped in).
When you see a Grey Dot, you don't buy yet. You just add the stock to your watchlist.
2. The "Go" Signal (Blue Triangle)
This is your entry trigger! A Blue Triangle appears on the next bar only if it confirms the upward move. This bar must be:
An "up" bar (closed higher than it opened).
It has high volume (showing that buyers and "big money" are now back and pushing the price up with conviction).
How to Use This Indicator
Grey Dot: See this? The setup looks good. Time to watch this stock.
Blue Triangle: See this? This is your entry confirmation. The move is now "on."
Red Line: This is your safety net. The indicator automatically draws your Stop-Loss at the low of the "Grey Dot" bar. This helps you define your risk on the trade right from the start.
Settings
Uptrend MA Period: (Default: 50) This is just the moving average used to make sure the stock is in an uptrend.
Volume/Range Lookback: (Default: 20) This is how many bars the indicator looks back at to decide what "average" volume or "average" range is.
That's it! I hope this tool helps you find great setups. As always, this isn't a magic crystal ball. It's a tool to help you react to the market. Test it out, and happy trading!

Realtime Squeeze Box [CHE] Realtime Squeeze Box — Detects lowvolatility consolidation periods and draws trimmed price range boxes in realtime to highlight potential breakout setups without clutter from outliers.
Summary
This indicator identifies "squeeze" phases where recent price volatility falls below a dynamic baseline threshold, signaling potential energy buildup for directional moves. By requiring a minimum number of consecutive bars in squeeze, it reduces noise from fleeting dips, making signals more reliable than simple threshold crosses. The core innovation is realtime box visualization: during active squeezes, it builds and updates a box capturing the price range while ignoring extreme values via quantile trimming, providing a cleaner view of consolidation bounds. This differs from static volatility bands by focusing on trimmed ranges and suppressing overlapping boxes, which helps traders spot genuine setups amid choppy markets. Overall, it aids in anticipating breakouts by combining volatility filtering with visual containment of price action.
Motivation: Why this design?
Traders often face whipsaws during brief volatility lulls that mimic true consolidations, leading to premature entries, or miss setups because standard volatility measures lag in adapting to changing market regimes. This design addresses that by using a hold requirement on consecutive lowvolatility bars to denoise signals, ensuring only sustained squeezes trigger visuals. The core idea—comparing rolling standard deviation to a smoothed baseline—creates a responsive yet stable filter for lowenergy periods, while the trimmed box approach isolates the core price cluster, making it easier to gauge breakout potential without distortion from spikes.
What’s different vs. standard approaches?
Reference baseline: Traditional squeeze indicators like the Bollinger Band Squeeze or TTM Squeeze rely on fixed multiples of bands or momentum oscillators crossing zero, which can fire on isolated bars or ignore range compression nuances.
Architecture differences:
Realtime box construction that updates barbybar during squeezes, using arrays to track and trim price values.
Quantilebased outlier rejection to define box bounds, focusing on the bulk of prices rather than full range.
Overlap suppression logic that skips redundant boxes if the new range intersects heavily with the prior one.
Hold counter for consecutive bar validation, adding persistence before signaling.
Practical effect: Charts show fewer, more defined orange boxes encapsulating tight price action, with a horizontal line extension marking the midpoint postsqueeze—visibly reducing clutter in sideways markets and highlighting "coiled" ranges that standard plots might blur with full highs/lows. This matters for quicker visual scanning of multitimeframe setups, as boxes selflimit to recent history and avoid piling up.
How it works (technical)
The indicator starts by computing a rolling average and standard deviation over a userdefined length on the chosen source price series. This deviation measure is then smoothed into a baseline using either a simple or exponential average over a longer window, serving as a reference for normal volatility. A squeeze triggers when the current deviation dips below this baseline scaled by a multiplier less than one, but only after a minimum number of consecutive bars confirm it, which resets the counter on breaks.
Upon squeeze start, it clears a buffer and begins collecting source prices barbybar, limited to the first few bars to keep computation light. For visualization, if enabled, it sorts the buffer and finds a quantile threshold, then identifies the minimum value at or below that threshold to set upper and lower box bounds—effectively clamping the range to exclude tails above the quantile. The box draws from the start bar to the current one, updating its right edge and levels dynamically; if the new bounds overlap significantly with the last completed box, it suppresses drawing to avoid redundancy.
Once the hold limit or squeeze ends, the box freezes: its final bounds become the last reference, a midpoint line extends rightward from the end, and a tiny circle label marks the point. Buffers and states reset on new squeezes, with historical boxes and lines capped to prevent overload. All logic runs on every bar but uses confirmed historical data for calculations, with realtime updates only affecting the active box's position—no future peeking occurs. Initialization seeds with null values, building states progressively from the first bars.
Parameter Guide
Source: Selects the price series (e.g., close, hl2) for deviation and box building; influences sensitivity to wicks or bodies. Default: close. Tradeoffs/Tips: Use hl2 for balanced range view in volatile assets; stick to close for pure directional focus—test on your timeframe to avoid oversmoothing trends.
Length (Mean/SD): Sets window for average and deviation calculation; shorter values make detection quicker but noisier. Default: 20. Tradeoffs/Tips: Increase to 30+ for stability in higher timeframes, reducing false starts; below 10 risks overreacting to singlebar noise.
Baseline Length: Defines smoothing window for the deviation baseline; longer periods create a steadier reference, filtering regime shifts. Default: 50. Tradeoffs/Tips: Pair with Length at 1:2 ratio for calm markets; shorten to 30 if baselines lag during fast volatility drops, but watch for added whips.
Squeeze Multiplier (<1.0): Scales the baseline downward to set the squeeze threshold; lower values tighten criteria for rarer, stronger signals. Default: 0.8. Tradeoffs/Tips: Tighten to 0.6 for highvol assets like crypto to cut noise; loosen to 0.9 in forex for more frequent but shallower setups—balances hit rate vs. depth.
Baseline via EMA (instead of SMA): Switches baseline smoothing to exponential for faster adaptation to recent changes vs. equalweighted simple average. Default: false. Tradeoffs/Tips: Enable in trending markets for quicker baseline drops; disable for uniform history weighting in rangebound conditions to avoid overreacting.
SD: Sample (len1) instead of Population (len): Adjusts deviation formula to divide by length minus one for smallsample bias correction, slightly inflating values. Default: false. Tradeoffs/Tips: Use sample in short windows (<20) for more conservative thresholds; population suits long looks where bias is negligible, keeping signals tighter.
Min. Hold Bars in Squeeze: Requires this many consecutive squeeze bars before confirming; higher denoise but may clip early setups. Default: 1. Tradeoffs/Tips: Bump to 35 for intraday to filter ticks; keep at 1 for swings where quick consolidations matter—trades off timeliness for reliability.
Debug: Plot SD & Threshold: Toggles lines showing raw deviation and threshold for visual backtesting of squeeze logic. Default: false. Tradeoffs/Tips: Enable during tuning to eyeball crossovers; disable live to declutter—great for verifying multiplier impact without alerts.
Tint Bars when Squeeze Active: Overlays semitransparent color on bars during open box phases for quick squeeze spotting. Default: false. Tradeoffs/Tips: Pair with low opacity for subtlety; turn off if using boxes alone, as tint can obscure candlesticks in dense charts.
Tint Opacity (0..100): Controls background tint strength during active squeezes; higher values darken for emphasis. Default: 85. Tradeoffs/Tips: Dial to 60 for light touch; max at 100 risks hiding price action—adjust per chart theme for visibility.
Stored Price (during Squeeze): Price series captured in the buffer for box bounds; defaults to source but allows customization. Default: close. Tradeoffs/Tips: Switch to high/low for wider boxes in gappy markets; keep close for midline focus—impacts trim effectiveness on outliers.
Quantile q (0..1): Fraction of sorted prices below which tails are cut; higher q keeps more data but risks including spikes. Default: 0.718. Tradeoffs/Tips: Lower to 0.5 for aggressive trim in noisy assets; raise to 0.8 for fuller ranges—tune via debug to match your consolidation depth.
Box Fill Color: Sets interior shade of squeeze boxes; semitransparent for layering. Default: orange (80% trans.). Tradeoffs/Tips: Soften with more transparency in multiindicator setups; bold for standalone use—ensures boxes pop without overwhelming.
Box Border Color: Defines outline hue and solidity for box edges. Default: orange (0% trans.). Tradeoffs/Tips: Match fill for cohesion or contrast for edges; thin width keeps it clean—helps delineate bounds in zoomed views.
Keep Last N Boxes: Limits historical boxes/lines/labels to this count, deleting oldest for performance. Default: 10. Tradeoffs/Tips: Increase to 50 for weekly reviews; set to 0 for unlimited (risks lag)—balances history vs. speed on long charts.
Draw Box in Realtime (build/update): Enables live extension of boxes during squeezes vs. waiting for end. Default: true. Tradeoffs/Tips: Disable for confirmedonly views to mimic backtests; enable for proactive trading—adds minor repaint on live bars.
Box: Max First N Bars: Caps buffer collection to initial squeeze bars, freezing after for efficiency. Default: 15. Tradeoffs/Tips: Shorten to 510 for fast intraday; extend to 20 in dailies—prevents bloated arrays but may truncate long squeezes.
Reading & Interpretation
Squeeze phases appear as orange boxes encapsulating the trimmed price cluster during lowvolatility holds—narrow boxes signal tight consolidations, while wider ones indicate looser ranges within the threshold. The box's top and bottom represent the quantilecapped high and low of collected prices, with the interior fill shading the containment zone; ignore extremes outside for "true" bounds. Postsqueeze, a solid horizontal line extends right from the box's midpoint, acting as a reference level for potential breakout tests—drifting prices toward or away from it can hint at building momentum. Tiny orange circles at the line's start mark completion points for easy scanning. Debug lines (if on) show deviation hugging or crossing the threshold, confirming hold logic; a persistent hug below suggests prolonged calm, while spikes above reset counters.
Practical Workflows & Combinations
Trend following: Enter long on squeezeend close above the box top (or midpoint line) confirmed by higher high in structure; filter with rising 50period average to avoid countertrend traps. Use boxes as support/resistance proxies—short below bottom in downtrends.
Exits/Stops: Trail stops to the box midpoint during postsqueeze runs for conservative holds; go aggressive by exiting on retest of opposite box side. If debug shows repeated threshold grazes, tighten stops to curb drawdowns in ranging followups.
Multiasset/MultiTF: Defaults work across stocks, forex, and crypto on 15min+ frames; scale Length proportionally (e.g., x2 on hourly). Layer with highertimeframe boxes for confluence—e.g., daily squeeze + 1H box for entry timing. (Unknown/Optional: Specific multiTF scaling recipes beyond proportional adjustment.)
Behavior, Constraints & Performance
Repaint/confirmation: Core calculations use historical closes, confirming on bar close; active boxes repaint their right edge and levels live during squeezes if enabled, but freeze irrevocably on hold limit or end—mitigates via barbybar buffer adds without future leaks. No lookahead indexes.
security()/HTF: None used, so no external timeframe repaints; all native to chart resolution.
Resources: Caps at 300 boxes/lines/labels total; small arrays (up to 20 elements) and short loops in sorting/minfinding keep it light—suitable for 10k+ bar charts without throttling. Persistent variables track state across bars efficiently.
Known limits: May lag on ultrasharp volatility spikes due to baseline smoothing; gaps or thin markets can skew trims if buffer hits cap early; overlaps suppress visuals but might hide chained squeezes—(Unknown/Optional: Edge cases in nonstandard sessions).
Sensible Defaults & Quick Tuning
Start with defaults for most liquid assets on 1Hdaily: Length 20, Multiplier 0.8, Hold 1, Quantile 0.718—yields balanced detection without excess noise. For too many false starts (choppy charts), increase Hold to 3 and Baseline Length to 70 for stricter confirmation, reducing signals by 3050%. If squeezes feel sluggish or miss quick coils, shorten Length to 14 and enable EMA baseline for snappier adaptation, but monitor for added flips. In highvol environments like options, tighten Multiplier to 0.6 and Quantile to 0.6 to focus on core ranges; reverse for calm pairs by loosening to 0.95. Always backtest tweaks on your asset's history.
What this indicator is—and isn’t
This is a volatilityfiltered visualization tool for spotting and bounding consolidation phases, best as a signal layer atop price action and trend filters—not a standalone predictor of direction or strength. It highlights setups but ignores volume, momentum, or news context, so pair with discreteness rules like higher highs/lows. Never use it alone for entries; always layer risk management, such as 12% stops beyond box extremes, and position sizing based on account drawdown tolerance.
Disclaimer
The content provided, including all code and materials, is strictly for educational and informational purposes only. It is not intended as, and should not be interpreted as, financial advice, a recommendation to buy or sell any financial instrument, or an offer of any financial product or service. All strategies, tools, and examples discussed are provided for illustrative purposes to demonstrate coding techniques and the functionality of Pine Script within a trading context.
Any results from strategies or tools provided are hypothetical, and past performance is not indicative of future results. Trading and investing involve high risk, including the potential loss of principal, and may not be suitable for all individuals. Before making any trading decisions, please consult with a qualified financial professional to understand the risks involved.
By using this script, you acknowledge and agree that any trading decisions are made solely at your discretion and risk.
Do not use this indicator on HeikinAshi, Renko, Kagi, PointandFigure, or Range charts, as these chart types can produce unrealistic results for signal markers and alerts.
Best regards and happy trading
Chervolino

Quantura - Session High/LowIntroduction
“Quantura – Session High/Low” is a professional-grade session mapping indicator that automatically identifies and visualizes the highs, lows, and ranges of key global trading sessions — London, New York, and Asia. It helps traders understand when and where liquidity tends to accumulate, allowing for better market structure analysis and session-based strategy alignment.
Originality & Value
This indicator unifies the three most influential global sessions into a single, adaptive visualization tool. Unlike typical session indicators, it dynamically updates live session highs and lows in real time while marking session boundaries and transitions. Its multi-session management system allows for immediate recognition of overlapping liquidity zones — a crucial feature for institutional and intraday traders.
The value and originality come from:
Real-time tracking of session highs, lows, and developing ranges.
Simultaneous visualization of multiple global sessions.
Optional vertical range lines for clearer visual segmentation.
Customizable session times, colors, and time zone offset for global accuracy.
Automatically extending and updating lines as each session progresses.
Functionality & Core Logic
Detects the start and end of each trading session (London, New York, Asia) using built-in time logic and user-defined UTC offsets.
Initializes session-specific high and low variables at the start of each new session.
Continuously updates session high/low levels as new candles form.
Draws color-coded horizontal lines for each session’s high and low.
Optionally adds vertical dotted lines to visually connect session range extremes.
Locks each session’s range once it ends, preserving historical structure for review.
Parameters & Customization
New York Session: Enable/disable, customize time (default 15:30–21:30), and set color.
London Session: Enable/disable, customize time (default 09:00–16:30), and set color.
Asia Session: Enable/disable, customize time (default 02:30–08:00), and set color.
Vertical Line: Toggle dotted vertical lines connecting session high and low levels.
UTC Offset: Adjust session timing to align with your chart’s local time zone.
Visualization & Display
Each session is color-coded for quick identification (default: blue for London, red for New York, green for Asia).
Horizontal lines track evolving session highs and lows in real time.
Once a session closes, the lines remain fixed to mark historical range boundaries.
Vertical dotted lines (optional) visually connect the session’s high and low for clarity.
Supports full overlay display without interfering with other technical indicators.
Use Cases
Identify liquidity zones and range extremes formed during active trading sessions.
Observe session overlaps (London–New York) to anticipate volatility spikes.
Combine with volume or market structure tools for session-based confluence.
Track how price interacts with prior session highs/lows to detect potential reversals.
Analyze session-specific performance patterns for algorithmic or discretionary systems.
Limitations & Recommendations
The indicator is designed for intraday analysis and may not provide meaningful output on daily or higher timeframes.
Adjust session times and UTC offset based on your broker’s or exchange’s timezone.
Does not provide trading signals — it visualizes session structure only.
Combine with liquidity and volatility indicators for full contextual understanding.
Markets & Timeframes
Compatible with all asset classes — including crypto, forex, indices, and commodities — and optimized for intraday timeframes (1m–4h). Particularly useful for traders analyzing session overlaps and volatility transitions.
Author & Access
Developed 100% by Quantura. Published as a Open-source script indicator. Access is free.
Compliance Note
This description fully complies with TradingView’s Script Publishing Rules and House Rules . It provides a detailed explanation of functionality, parameters, and realistic use cases without making any performance or predictive claims.

Quantura - Average Intraday Candle VolumeIntroduction
“Quantura – Average Intraday Candle Volume” is a quantitative visualization tool that calculates and displays the average traded volume for each intraday time position based on a user-defined historical lookback period. It allows traders to analyze recurring intraday volume patterns, identify high-activity sessions, and detect liquidity shifts throughout the trading day.
Originality & Value
This indicator goes beyond standard volume averages by normalizing and aligning volume data according to the time of day. Instead of simply smoothing recent bars, it builds an intraday volume profile based on historical daily averages, enabling users to understand when during the day volume typically peaks or drops.
Its originality and usefulness come from:
Converting standard volume data into time-aligned intraday averages.
Visualization of historical intraday liquidity behavior, not just total daily volume.
Dynamic scaling using normalization and transparency to emphasize active and quiet periods.
Optional day-separator lines for precise intraday structure recognition.
Gradient-based coloring for better visual interpretation of volume intensity.
Functionality & Core Logic
The indicator divides each day into discrete intraday time positions (based on chart timeframe).
For each position, it stores and updates historical volume values across the selected number of days.
It calculates an average volume per time position by aggregating all stored values and dividing them by the number of valid days.
The result is plotted as a continuous histogram showing typical intraday volume distribution.
The bar colors and transparency dynamically reflect the relative intensity of volume at each point in the day.
Parameters & Customization
Number of Days for Averaging: Defines how many past days are included in the volume average calculation (default: 365).
UTC Offset: Allows synchronization of intraday cycles with local or exchange time zones.
Base Color: Sets the main color for plotted volume columns.
Color Mode: Choose between “Gradient” (transparency dynamically adjusts by intensity) or “Normal” (fixed opacity).
Day Line: Toggles dashed vertical lines marking the start of each trading day.
Visualization & Display
Volume is plotted as a series of histogram bars, each representing the average volume for a specific intraday time position.
A gradient color mode enhances readability by fading lower-intensity areas and highlighting high-volume regions.
Optional day-separator lines visually segment historical sessions for easy reference.
Works seamlessly across all chart timeframes that divide the 24-hour day into regular bar intervals.
Use Cases
Identify when trading activity typically peaks (e.g., session opens, news windows, or overlapping markets).
Compare current intraday volume to historical averages for early anomaly detection.
Enhance algorithmic or discretionary strategies that depend on volume-timing alignment.
Combine with volatility or price structure indicators to confirm market activity zones.
Evaluate session consistency across different time zones using the UTC offset parameter.
Limitations & Recommendations
The indicator requires intraday data (below 1D resolution) to function properly.
Volume behavior may vary across brokers and assets; adjust averaging period accordingly.
Does not predict price movement — it provides volume-based context for analysis.
Works best when combined with structure or momentum-based indicators.
Markets & Timeframes
Compatible with all intraday markets — including crypto, Forex, equities, and futures — and all intraday timeframes (from 1 minute to 4 hours). It is particularly valuable for analyzing assets with continuous 24-hour trading activity.
Author & Access
Developed 100% by Quantura. Published as a Open-source script indicator. Access is free.
Important
This description complies with TradingView’s Script Publishing and House Rules. It provides a clear explanation of the indicator’s originality, logic, and purpose, without any unrealistic performance or predictive claims.

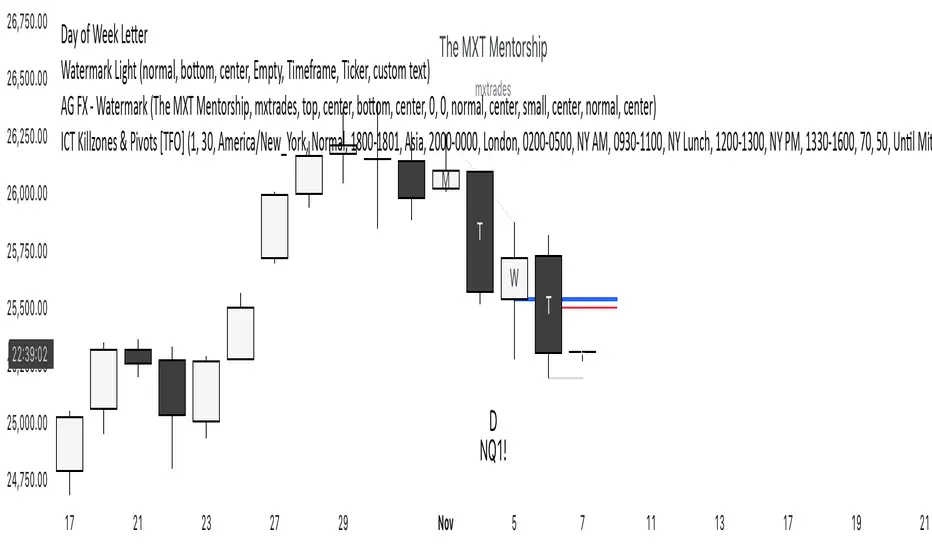
Day of Week LetterLetters printed on the Daily candle corresponding the day of the trading week it is on. Used for weekly range logic
Set it to 'bring to front' to see it
Pair Trade Beta Calculator (WORKING VERSION)wrote by chatgpt5, calucate the beta for pair trading
Asset A: The asset you would like to long
Assest B: The asset you would like to short

VMMA Wave Edges [MTF]The VMMA Wave Edges is a multi-timeframe (MTF) overlay indicator that plots dynamic upper and lower edges formed by a band of Volume-Weighted Moving Averages (VWMAs) of varying lengths. It computes N VWMAs with lengths increasing arithmetically from start_len by incr, then plots:The maximum of all VWMAs → Upper Edge
The minimum of all VWMAs → Lower Edge
These edges are calculated on a higher timeframe (mtf_tf) and projected onto the current chart, creating a smooth, volume-sensitive envelope that adapts to volatility and trend strength.Use & InterpretationFeature
Purpose
Upper Edge
Dynamic resistance zone; price often reacts when approaching or breaking above.
Lower Edge
Dynamic support zone; price tends to bounce or consolidate near it.
Edge Contraction
Low volatility → potential breakout setup.
Edge Expansion
High volatility → trend continuation or exhaustion.
MTF Projection
Avoids repainting & noise by using cleaner higher-timeframe data.
Trading ApplicationsMean ReversionBuy near Lower Edge, sell near Upper Edge (especially in ranging markets).
Breakout ConfirmationPrice closing above Upper Edge on MTF → bullish breakout.
Below Lower Edge → bearish.
Trend FilterIn uptrend: price above Upper Edge → strong momentum.
In downtrend: price below Lower Edge → strong bearish control.
Support/Resistance FlipBroken Upper Edge → becomes future support (and vice versa).

SevenDayHighLowTableWithBoxes [CHE]SevenDayHighLowTableWithBoxes — Seven-day day-range boxes with a weekday-aware “ghost” projection and a compact table that tracks recent extremes and per-weekday hit rates.
Summary
This indicator visualizes each trading day as a colored box and annotates the final high and low with compact markers. It maintains a rolling seven-day view and a five-column table showing day name, high, low, range, and a per-weekday projection hit statistic. A dashed “ghost” box projects a typical range for the current weekday using a running average and an adjustable scaling factor. The script is written in Pine v6, runs on the main chart (overlay true), and emphasizes stable object handling and closed-bar finalization at day boundaries.
Motivation: Why this design?
Intraday traders often need fast context for where today’s price sits relative to recent daily extremes, without switching timeframes. A simple daily high/low overlay is informative but lacks structure, sizing context, and continuity. By grouping bars into local days (configurable UTC offset), drawing explicit boxes, and projecting a weekday-typical range, the chart becomes easier to scan. The compact table gives a quick audit trail of the latest seven days while tracking how often the weekday projection would have covered the realized range.
What’s different vs. standard approaches?
Reference baseline: Plain daily high/low lines or session boxes without context.
Architecture differences:
Weekday-tinted boxes and labels for today plus up to six prior days.
Weekday average range drives a dashed projection (“ghost”) sized by a user-defined percentage.
Per-weekday hit statistics recorded as hits over totals and displayed in the table.
ATR-based vertical offsets keep labels readable.
Live updates intraday; state is finalized at the local day switch.
Practical effect: The chart shows where current price sits inside a known daily envelope, plus how “typical” the day’s movement is for this weekday, aiding expectations and planning.
How it works (technical)
The script computes a local daily timestamp using the user’s UTC offset. A day change finalizes the prior day, writes its high, low, start and end indices, and records the bar indices of the terminal high and low.
For each weekday, it maintains a running average of realized ranges with a cap on the lookback count. The ghost projection length is the weekday average scaled by the user’s percentage setting.
Anchor selection for the ghost uses the most recent extreme and the close relative to the intraday midpoint to choose a low-anchored or high-anchored box.
A five-column table (Day, High, Low, Range, Ghost OK) is refreshed on the last bar. The “Ghost OK” column shows per-weekday cumulative hits over totals with a percentage, calculated before including the just-finished day.
Object counts are bounded to seven days by pruning arrays and deleting old boxes and labels. Visual updates for historical objects occur on the last bar to minimize overhead. No `security()` calls are used.
Parameter Guide
UTC (+/−) — Controls local day boundaries — Default: minus five hours — Set to your venue’s local time.
Session (for Time gate) — Session string — Default: full week — (Optional) computed internally; not applied to gating.
Show 7-Day High/Low Table — Toggles the table — Default: true — Disable to reduce UI load.
Show Day Boxes in Chart — Toggles day boxes — Default: true — Disable for a cleaner chart.
Table Position — Nine-point anchor — Default: Middle Right — Move to avoid overlap.
Table Background / Text Color / Min Cell Width — Styling controls — Defaults: gray background, white text, width twelve characters.
Weekday Colors (Sun…Sat) — Row and box tints — Defaults: semi-transparent hues — Adjust for your theme.
Triangle Transparency — Marker opacity — Default: zero — Increase to fade high/low dots.
Day Label Transparency — Day name opacity — Default: zero — Increase to reduce emphasis.
Box Border Width — Box stroke width — Default: one — Increase for stronger edges.
Extend Boxes Right — Extend current box — Default: false — Useful for forward planning.
Show Average Range Ghost Box — Dashed projection — Default: true — Disable if distracting.
Ghost Border Color / Width — Ghost styling — Defaults: gray, width one.
Ghost Length percent of AvgRange — Projection scale — Default: one hundred; bounds zero to five hundred — Lower to be conservative.
Max History Days for Average — Cap per-weekday averaging — Default: two hundred fifty-two; bounds thirty to five hundred.
ATR Length / Day Label ATR Multiplier / Triangle Up ATR Multiplier / Triangle Down ATR Multiplier — Offsets for label placement — Defaults: length one hundred; multipliers zero — Increase on dense instruments to prevent overlap.
Reading & Interpretation
Day boxes: The filled rectangle marks each day’s full high-low span; color encodes the weekday.
Markers: Small dots near the terminal high and low highlight where the final extremes occurred.
Ghost box: A dashed box sized by the weekday average range, anchored based on recent behavior. It is a typical span, not a target.
Table: Row one shows “Today”. Rows below list up to six prior days. “Ghost OK” shows per-weekday cumulative hits over totals with a percentage, which reflects historical coverage quality for that weekday.
Practical Workflows & Combinations
Trend following: Use the current box plus recent boxes to read expansion or compression days; combine with basic structure such as higher-highs and higher-lows or lower-lows and lower-highs for confirmation.
Exits and risk: When price nears the ghost boundary late in the session, consider managing exposure more conservatively.
Multi-asset and multi-timeframe: Works on minute charts. As a starting point, use five to less than sixty minutes. For cross-checks, pair with a higher timeframe bias filter.
Behavior, Constraints & Performance
Repaint/confirmation: The indicator updates intraday; extremes and ghost position can move while the day is open. Values are finalized on the next local day start.
HTF/security: None used; repaint risk is limited to live-bar movement.
Resources: `max_bars_back` five thousand; arrays are pruned to seven days; the table and color sync run on the last bar; the live ghost updates only in real time.
Known limits: Weekday averages can be unrepresentative during regime shifts, events, or gaps. Day boundaries depend on the UTC offset being set correctly. No alerts are included. The script displays warning labels when the timeframe is below five minutes or at sixty minutes and above.
Sensible Defaults & Quick Tuning
Start with the defaults.
Ghost too aggressive: Lower the percent scale.
Labels overlap: Increase ATR multipliers.
Clutter or performance issues: Hide the table or boxes, or disable the ghost.
Day boundary misaligned: Adjust the UTC offset to your market.
What this indicator is—and isn’t
This is a visualization and context layer for daily extremes and a weekday-based typical span. It does not predict direction, does not manage orders, and is not a complete trading system. Use it alongside market structure, risk controls, and position management.
Disclaimer
The content provided, including all code and materials, is strictly for educational and informational purposes only. It is not intended as, and should not be interpreted as, financial advice, a recommendation to buy or sell any financial instrument, or an offer of any financial product or service. All strategies, tools, and examples discussed are provided for illustrative purposes to demonstrate coding techniques and the functionality of Pine Script within a trading context.
Any results from strategies or tools provided are hypothetical, and past performance is not indicative of future results. Trading and investing involve high risk, including the potential loss of principal, and may not be suitable for all individuals. Before making any trading decisions, please consult with a qualified financial professional to understand the risks involved.
By using this script, you acknowledge and agree that any trading decisions are made solely at your discretion and risk.
Do not use this indicator on Heikin-Ashi, Renko, Kagi, Point-and-Figure, or Range charts, as these chart types can produce unrealistic results for signal markers and alerts.
Best regards and happy trading
Chervolino

Koosha Dab's True Momentum OscillatorTrue Momentum Oscillator based on code written by SparkyFlary:
tradingview.com/u/SparkyFlary/
Different timeframe calculations added to the code.
Magik- OB findermarks Magic Orderblocks 15 min time frame... when price visits the ob go to 1 min tf.. after price makes a mss.. enter.. enjoy!!!

✅ Market Maker Levels (v6 Labels + Prices, No Zones)this shows previous day and weeks high n low which helps in managing the trades to find support and resistance

MACD Remastered [CHE]MACD Remastered — Robust MACD with confirmed pivot-based divergence, optional signal bands, and ready-to-use alerts.
Summary
This indicator augments classic MACD with a robust, confirmed pivot-based divergence engine and an optional signal channel using Bollinger Bands. Divergence signals are only produced after a pivot is confirmed, which reduces noise from transient swings. A line-of-sight clearance check filters cases where the MACD histogram path contradicts the divergence, further cutting false flags. Histogram coloring clarifies momentum changes, while optional triangles project the same signals onto the main chart for quick context.
Motivation: Why this design?
Standard MACD divergence tools tend to fire early in volatile phases and flip during consolidation. The core idea here is to delay decision points until a pivot is confirmed and to validate the path between pivots. This addresses fake flips and improves signal credibility at the cost of some latency. Optional bands around the Signal line add context about compression and expansion without altering MACD’s core behavior.
What’s different vs. standard approaches?
Reference baseline: Classical MACD (fast and slow moving averages, Signal line, histogram) with simple divergence checks.
Architecture differences:
Confirmed pivot logic with left and right bars.
Line-of-sight clearance test across the histogram path between pivots.
Optional Signal-line Bollinger Bands with configurable length and width.
Composite “Any Divergence” alert plus separate regular and hidden alerts.
Optional main-chart triangles using forced overlay for at-a-glance context.
Practical effect: Fewer early or contradictory divergence signals, clearer momentum context via histogram colors and a visible Signal channel during compression and expansion.
How it works (technical)
The MACD line derives from a fast and a slow moving average on a chosen source. The Signal line smooths the MACD line using a selected moving average type and length. The histogram is the difference between MACD and Signal and is colored by direction and acceleration.
Divergence uses confirmed pivots: a pivot forms only after a set number of bars on the right side, so the event is locked in. The engine retrieves the last two relevant pivots and checks price movement versus the MACD histogram movement to classify regular or hidden divergence. A line-of-sight clearance routine traverses the histogram path between the two pivots and rejects the signal if the path invalidates the directional relationship. When enabled, Bollinger Bands are plotted around the Signal line; width scales with standard deviation. Programmatic alerts fire only on confirmed bars. No higher-timeframe requests are used.
Parameter Guide
Oscillator MA Type — Sets fast and slow MA family for MACD. Default: EMA. Tip: EMA is more responsive; SMA is steadier.
Fast Length — Fast MA period. Default: 12. Trade-off: Shorter is quicker but noisier.
Slow Length — Slow MA period. Default: 26. Trade-off: Longer reduces noise but adds lag.
Source — Price input. Default: Close. Tip: Use a stable source for consistency.
Signal MA Type — Moving average family for Signal. Default: EMA.
Signal Length — Smoothing of MACD into Signal. Default: 9. Trade-off: Longer smooths more, reacts slower.
Calculate Divergence — Enables divergence engine. Default: True.
Enable Bollinger Bands on Signal — Adds bands around Signal. Default: False.
BB Length — Sampling window for bands. Default: 20. Active: Only when bands are enabled.
BB StdDev — Band width in standard deviations. Default: 2.0. Bounds: between about zero point zero zero one and fifty.
Pivot Left / Pivot Right — Bars to the left and right that define a confirmed pivot. Default: five and five. Trade-off: Larger values mean stronger but slower pivots.
Min / Max Bars Between Pivots — Valid window between two pivots. Default: five and sixty. Tip: Increase minimum to reduce micro-divergences.
Detect Hidden — Include hidden divergence. Default: True.
Draw Lines — Draw connector lines on the MACD pane. Default: True.
Alerts: Enable / Regular / Hidden / Frequency / Prefix — Control alert emission, categories, cadence, and label. Defaults: Enabled, both categories on, once per bar close, prefix “MACD RM”.
Reading & Interpretation
Histogram: Columns above zero reflect positive momentum; below zero reflect negative momentum. Color shifts indicate momentum increasing or decreasing within each side.
MACD and Signal: Crosses and distance indicate momentum shifts and strength. When bands are enabled, touches and departures hint at compression and expansion around the Signal.
Divergence: Solid green lines and labels indicate regular bullish; solid red indicate regular bearish. Dashed teal and dashed orange denote hidden bullish and hidden bearish. Triangles on the main chart mirror these events for quicker visibility.
Practical Workflows & Combinations
Trend following: Use histogram color transitions with a structure filter such as higher highs and higher lows for long bias, or lower highs and lower lows for short bias. Divergence against the prevailing structure suggests caution or partial exits.
Exits and risk: In a long, regular bearish divergence near resistance can justify scaling out or tightening stops. Hidden divergence in the trend direction can support continuation but should not replace risk controls.
Multi-asset / Multi-timeframe: Works across liquid futures, forex, indices, and large-cap equities. Start with defaults on four-hour and daily; shorten lengths on intraday only when liquidity is strong.
Behavior, Constraints & Performance
Repaint and confirmation: Signals are anchored only after the right-side pivot bars complete; alerts trigger on confirmed bars. This intentionally adds latency to reduce noise.
No higher-timeframe requests: No `security` calls are used; repaint risk is primarily tied to live bars before confirmation.
Resources: Declared `max_bars_back` is five hundred. The divergence path check iterates between pivots, bounded by the maximum bars parameter. Line objects may accumulate; limits are set for lines and labels.
Known limits: Latency at sharp turns, potential misses during fast single-bar reversals, and sensitivity to extremely choppy sessions if minimum gap between pivots is set too low.
Sensible Defaults & Quick Tunin g
Starting point: EMA, twelve and twenty-six with Signal nine; pivots five and five; minimum five, maximum sixty; alerts on close; bands off.
Too many flips: Increase Signal length, raise pivot counts, and increase minimum bars between pivots. Consider disabling hidden divergence.
Too sluggish: Reduce pivot counts, lower Signal length, and enable bands to visualize early compression.
Cluttered chart: Keep lines off and rely on labels and main-chart triangles. Use the alert prefix to route events cleanly.
What this indicator is—and isn’t
This is a visualization and signal layer for MACD with confirmed, path-checked divergence and optional Signal bands. It is not a trading system, not predictive, and not a position management framework. Use it together with structure analysis, liquidity context, and explicit risk controls.
Disclaimer
The content provided, including all code and materials, is strictly for educational and informational purposes only. It is not intended as, and should not be interpreted as, financial advice, a recommendation to buy or sell any financial instrument, or an offer of any financial product or service. All strategies, tools, and examples discussed are provided for illustrative purposes to demonstrate coding techniques and the functionality of Pine Script within a trading context.
Any results from strategies or tools provided are hypothetical, and past performance is not indicative of future results. Trading and investing involve high risk, including the potential loss of principal, and may not be suitable for all individuals. Before making any trading decisions, please consult with a qualified financial professional to understand the risks involved.
By using this script, you acknowledge and agree that any trading decisions are made solely at your discretion and risk.
Do not use this indicator on Heikin-Ashi, Renko, Kagi, Point-and-Figure, or Range charts, as these chart types can produce unrealistic results for signal markers and alerts.
Best regards and happy trading
Chervolino

Liquidity Pool TimesThis script automatically plots key liquidity pool times on your chart. I will release an updated script that plots the names on the far right when i can figure it out. Until then you will see Monthly Open/Close Weekly Open/Close and Midnight/10AM open

BlackScrum Swing Boxes 1/2/3 After seeing influencers selling their indicator suite's online, I decided to start making replicas of them, maybe mine are better, maybe they are worse. I use them in my day to day trading and they help me make money, hopefully they help you make money.
Not financial advice, Do Your Own Research.
Everything provided without warranty or liability. If you stuff up, learn from it, get better, we all make mistakes.
// BlackScrum — 1/2/3-Bar Swing Boxes (auto timeframe)
//
// DESCRIPTION
// This indicator displays three swing-direction boxes (1B, 2B, 3B) in the top-right corner of the chart.
// The boxes automatically adapt to the chart's timeframe (15m, 1H, 4H, 1D, etc.).
// Each box represents the direction of the most recently confirmed swing pivot:
// • 1B → 1-bar swing (fastest, most sensitive)
// • 2B → 2-bar swing (medium confirmation)
// • 3B → 3-bar swing (slowest, strongest confirmation)
//
// COLORS
// • GREEN = last confirmed swing pivot was a higher low (up swing)
// • RED = last confirmed swing pivot was a lower high (down swing)
// • GREY = no clear swing yet (fresh/transition area)
//
// CONFLUENCE
// • ALL GREEN = bullish alignment across 1B, 2B, 3B → strong trend continuation signal
// • ALL RED = bearish alignment across all three → strong downtrend continuation signal
//
// HOW TO USE (TRADEPLAY)
//
// 1) ENTRIES
// • Aggressive entry → enter when ALL GREEN prints on your timeframe.
// • Safer pullback entry → wait for 1B to briefly turn red during a green 2B/3B,
// then flip back to green. Enter on the re-flip.
// • Multi-timeframe filter:
// Take longs only when higher TF (e.g., 1H/4H) boxes are at least neutral-to-green.
//
// 2) EXITS
// • Weakness exit → when 1B flips against your position while 2B is neutral/red.
// • Full exit → when ALL RED prints.
// • Time stop → if price hasn’t moved after several bars of your execution timeframe.
//
// 3) STOP-LOSS / RISK
// • Place stops beyond the latest opposite swing used by 2B or 3B.
// • Add 0.5–1× ATR buffer if your market has stop-hunt volatility.
// • Always size position based on the distance to the swing stop.
//
// 4) WHEN TO IGNORE SIGNALS
// • Chop zones → 1B flipping repeatedly while 2B/3B disagree.
// • News candles → wait for pivots to confirm on the *closed* bar.
//
// 5) USING WITH OTHER TOOLS
// • With a trend ribbon (e.g., Larsson-style):
// Only take ALL GREEN longs when the ribbon is UP, and ALL RED shorts when ribbon is DOWN.
// • With a Fear & Greed index:
// Prefer longs when F&G > 60,
// Avoid longs when F&G < 40 unless countertrend scalping.
//
// 6) TIMEFRAME GUIDANCE
// • Scalping: 5m / 15m, confirmed by 1H or 4H boxes.
// • Swinging: 1H / 4H with daily filter.
// • Positioning: 1D with weekly confirmation.
//
// 7) INTERPRETATION CHEATSHEET
// • 1B green, 2B grey, 3B red → short-term bounce inside higher timeframe downtrend.
// • 1B/2B green, 3B grey → early trend reversal forming.
// • All grey → fresh swing area; wait for direction.
//
// 8) CUSTOMIZATION
// • len1 / len2 / len3 control sensitivity (higher = slower & cleaner).
// • Can add a timeframe header box (e.g., “15m / 4H / 1D”).
// • Can add a multi-timeframe grid (e.g., 15m | 1H | 4H | 1D each with 1B/2B/3B).
//
// ====================================================================================================

Adil Hoca - US Market Score Only NasdaqMarket Score & Crash Detector Indicator
User Guide & Usage Instructions
This TradingView indicator provides a comprehensive market risk assessment, combining multiple financial metrics to detect potential market crashes, recessions, and overall trend regimes. It is especially designed to alert traders and investors about early warning signals before significant market downturns, enabling proactive decision-making.
Key Features
Multi-Metric Market Sentiment: Uses volatility indices, currency strength, yield spreads, breadth, and bond ratios to evaluate market health.
Crash Detection System: Monitors various conditions such as VIX spikes, breadth collapse, momentum cliffs, high-yield spread surges, and hidden market weaknesses.
Reccession Indicator: Incorporates the Sahm Rule, a proven recession indicator based on employment data.
Alert System: Sends real-time alerts for critical market conditions, including crashes, recession signals, and spreads alerts.
Visual Elements: Includes histograms, trend lines, threshold lines, and shape signals to visually interpret market states.
Customizable Parameters: Adjust weights, sensitivity, thresholds, and alert preferences to suit your trading style.
How it Works
1. Data Collection
The indicator fetches data from multiple sources:
Market volatility: VIX index
Currency strength: DXY index
Interest rates: SOFR, PCE inflation
Yield spreads: High Yield Credit Spread, Investment Grade Spread
Market Breadth: Ratio of QQQ to TLT (tech vs. bonds)
Bond Ratios: TMF/TMV (long-term bonds)
Employment Data: The Sahm Rule (monthly unemployment data)
2. Normalization
Data is normalized via z-score calculations over defined periods to standardize the metrics, making them comparable regardless of their original scale.
3. Composite Score Calculation
Each metric is weighted according to user-defined parameters, and a composite score is generated to represent the overall market sentiment, smoothed with an EMA for trend clarity.
4. Crash & Recession Detection
Crash System: Looks for conditions like VIX spikes, breadth collapse, momentum drops, high yield spread surges, and hidden weaknesses. If multiple conditions meet thresholds, alerts trigger.
Recession Indicator: Uses the Sahm Rule, which compares the current unemployment rate's three-month average to the lowest point over the past 12 months. When it exceeds a certain threshold, a recession signal is generated.
5. Alerts & Visualization
Sound & Shape Alerts: Signals like warning triangles, cross icons, and color changes.
Threshold Lines: Indicate levels like "Strong Bullish," "Strong Bear," and critical zones.
Dual Confirmation: Combines crash and recession signals for high-confidence alerts.
Usage & Customization
Placing the Indicator
Copy and paste the Pine Script code into TradingView's Pine Editor.
Save and add the script to your chart. Adjust inputs like weights, sensitivity mode, thresholds, and alert preferences via the input panel.
Key Inputs
Weights: Customize the importance of each metric.
Sensitivity Mode: Changes alert thresholds for early warnings.
Crash Sensitivity: Defines how many indicators need to trigger before issuing a crash alert.
Recession Thresholds: Set the unemployment level that signals recession.
Interpreting Visuals
Histogram: Shows the composite score; green means bullish, red indicates bearish.
Momentum Line: Highlights trend acceleration/deceleration.
Threshold Lines: Dotted/dashed lines showing critical zones.
Shape Shapes: Triangles or crosses appear for early signals or critical events.
Alerts
Crash Alerts: Warn of imminent market crashes.
Recession Alerts: Indicate economic downturns based on Sahm Rule.
Spread Alerts: Show high-yield credit spread surges signaling stress.
Double Confirmation: High-confidence signals when crash and recession conditions align.
Best Practices
Use on multiple timeframes for confirmation.
Combine with other technical analysis tools for better accuracy.
Adjust thresholds according to your risk appetite.
Follow alert signals for early warning but always consider overall context.
Final Notes
This indicator synthesizes a variety of leading and lagging indicators to give a holistic view of market health. It is designed to provide early warnings, especially in volatile or stressed environments, helping traders avoid severe drawdowns or position ahead of major downturns.
Feel free to modify input parameters for your preferences, or integrate additional data sources for further refinement.
This detailed explanation can be directly included as a description or documentation within your TradingView script, helping users grasp its full capabilities and optimal usage.
