Double Exponential MACDA modification of the classic MACD to use Double EMAs which tends to have less lag than the standard indicator.
Alert conditions are pre-configured for simple line crosses and you can enable/disable the histogram from the indicator options menu.
Enjoy!
المتوسط المتحرك الأسي المزدوج (DEMA)

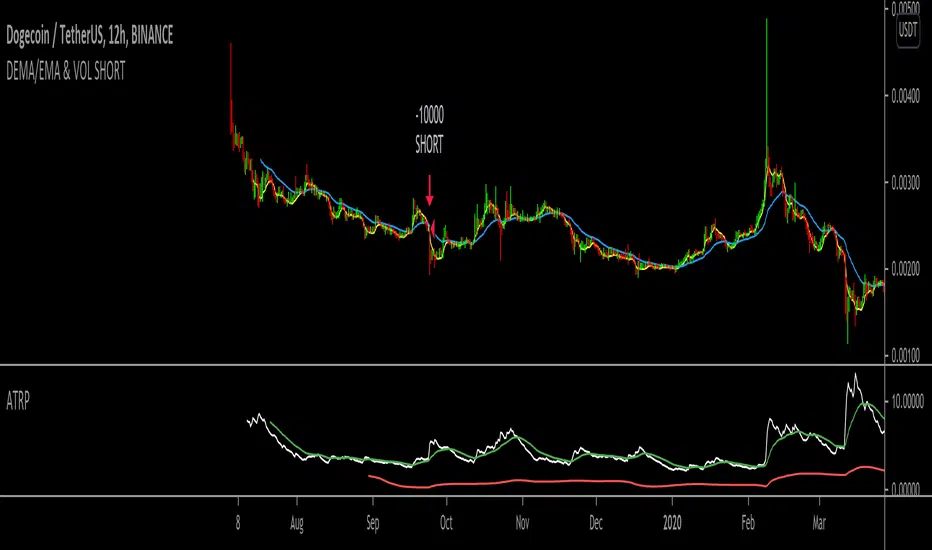
DEMA/EMA & VOL (Short strategy)Hello,
I am trying to build a short momentum strategy that is based off of the DEMA crossing under the EMA, but because many momentum strategies send too many signals, I have also implemented a volatility condition based on the average true range percentage (ATRP). Essentially, as momentum moves downwards + volatility (ATRP) moves upwards, it shorts the security. However, I am having an issue with exiting trades. I think this would be a great strategy if I could simply get the strategy to exit the trades. Does anyone mind looking through the source code and tell me what I might be doing wrong? In return, I would hope that this strategy could be useful to you in same way! Thank you for looking!
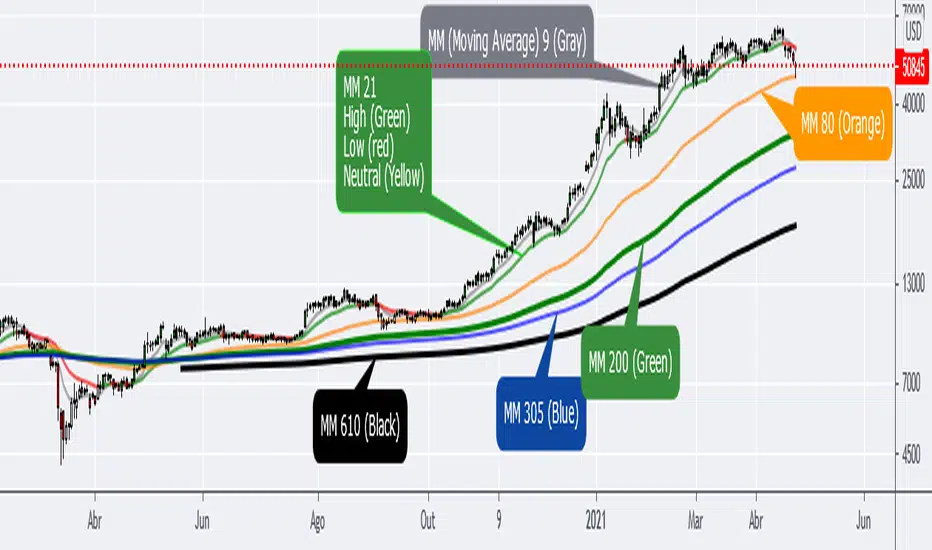
Devilpool Operational Moving Average ExponentialThis indicator contains the main exponential moving averages (9, 21, 80, 200, 305 and 610), which I use in my operational.
It was developed by my friend Giovani, who is a 10 note guy!
I hope he can help you on your journey to becoming a Professional Trader.
You can modify it the way you prefer, it is very simple.
Neste indicador estão reunidas as principais médias móveis exponenciais (9, 21, 80, 200, 305 e 610), que uso em meu operacional.
Ele foi desenvolvido por meu amigo Giovani, que é um cara nota 10!
Espero que ele possa ajudar a você na jornada para se tornar um Trader Profissional.
Você pode modifica-la do jeito que preferir, é muito simples.
Tillson T3 MakiwaraI've used Tillson T3 based on KIVANÇ fr3762 script and i added some new alert conditions according to buy sell statuses

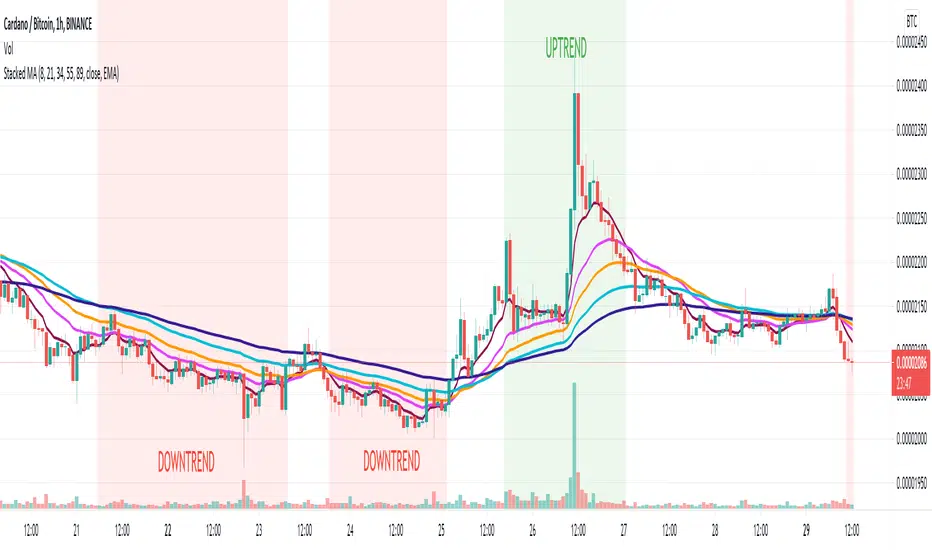
Stacked Moving AveragesThe Stacked Moving Averages indicator lets you see if a ticker is in an uptrend, downtrend, or no trend based on the condition of the moving averages. If the moving averages are stacked such that MA1>MA2>MA3>MA4>MA5, then that is described as an uptrend. If the moving averages are stacked such that MA5>MA4>MA3>MA2>MA1, then that is defined as a downtrend.
The moving averages can be SMA, EMA, or DEMA, and it’s possible to view all the moving average series in the chart or hide all series and only see if there is an uptrend or downtrend according to the condition.
Note: If length 4 OR length 5 is zero the MA4 OR MA5 will be ignored.
Multi Timeframe Moving Average [xdecow]This indicator plots a moving average of 4 different timeframes.
The types of averages available are: SMA, EMA, DEMA, VWMA, RMA, WMA.

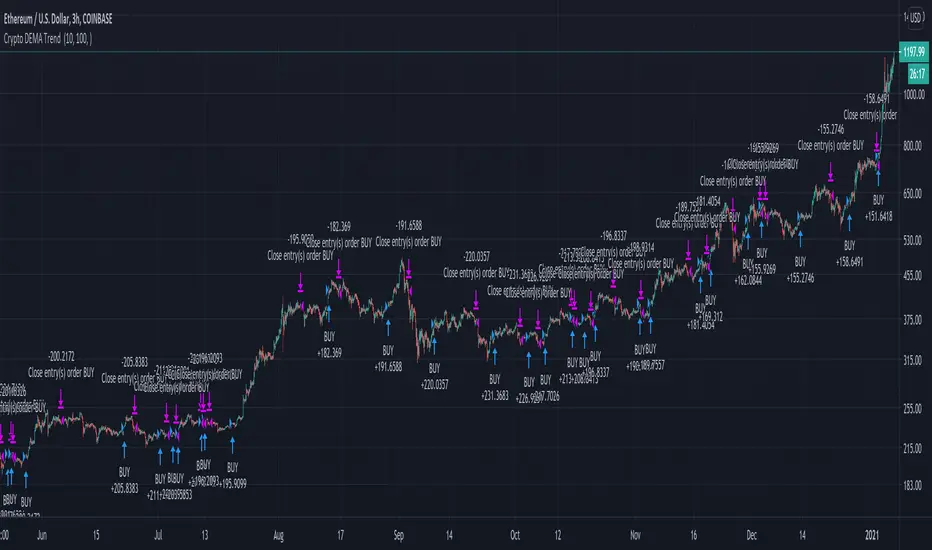
Best Crypto DEMA Strategy Long onlyThis is a crypto strategy suited for big time frames like 3h+.
THIS IS A LONG ONLY STRATEGY , SUITED TO BEAT BUY AND HOLD !
It's a very risky strategy because it has no stop loss at all, so be extremely careful with it.
This strategy is made of 2 DEMA a fast and a slow one.
We have two rules : entry it's when we have a crossunder between the slow DEMA and the fast DEMA. We exit when the opposite happens, in this case, when the slow is above fast.
For this example I used an initial capital of 1000 eur, using 100% of it always, and a commission of 0.2% per each deal.
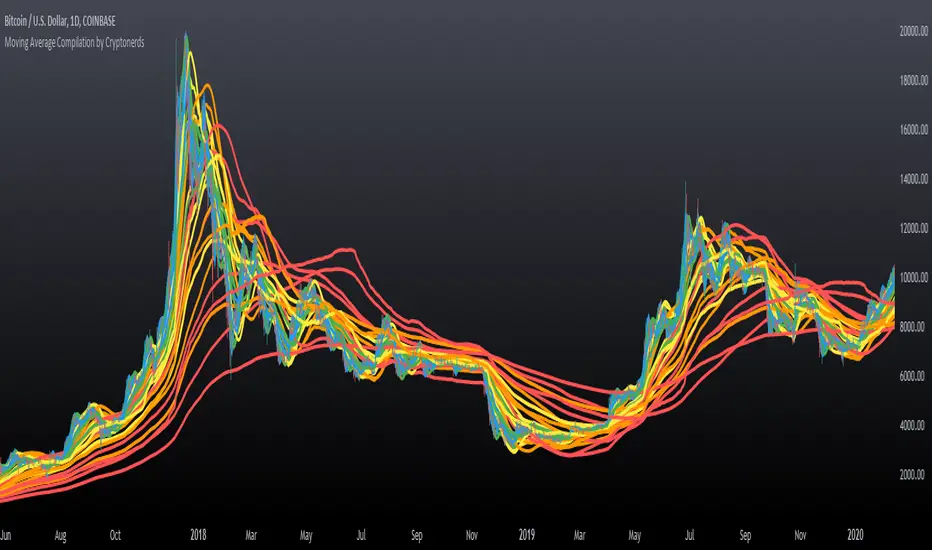
Moving Average Compilation by CryptonerdsThis script contains all commonly used types of moving averages in a single script. To our surprise, it turned out that there was no script available yet that contains multiple types of moving averages.
The following types of moving averages are included:
Simple Moving Averages (SMA)
Exponential Moving Averages (EMA)
Double Exponential Moving Averages (DEMA)
Display Triple Exponential Moving Averages (TEMA)
Display Weighted Moving Averages (WMA)
Display Hull Moving Averages (HMA)
Wilder's exponential moving averages (RMA)
Volume-Weighted Moving Averages (VWMA)
The user can configure what type of moving averages are displayed, including the length and up to five multiple moving averages per type. If you have any other request related to adding moving averages, please leave a comment in the section below.
If you've learned something new and found value, leave us a message to show your support!
Multi Time Frame Moving Averages [Anan]Hello friends,
All your popular moving average now in one indicator, also no need to open a lot of tabs to see where is that moving average at that time frame,
with multi time frame feature, now u can see up to six multi time frame MA in the same chart with option to show/hide it
list of moving averages:
SMA
Smooth SMA
SuperSmooth MA
EMA
DEMA
TEMA
Triangular MA
QEMA
RMA
Hull MA
KAMA
WMA
VWMA
VWAP
CTI
LSMA
VIDYA
Blackman Filter
Adaptive RSI
also there is an option to see the Average of four lengths, i backtest this and found it super great !

MAVC: Moving Averages Combo by Mehmet YildizliMAVC: Moving Averages Combo by Mehmet Yildizli
==========================================
You can use this indicator to add more than one moving average on the same chart. At the beginning of the indicator settings, the "Volume For Tillson" parameter is used only when you select the Tillson moving average.
When you check the "Use (high + low + 2 * close) / 4" checkbox, this value is used as the source data to be included in the calculations of all moving averages. When you clear this check box, calculations are made according to the selection you make in the SOURCE section.
You can add 4 moving averages at the same time to the chart.
You can choose a different period and a different calculation method for each moving average.
In this way, you can make a buying / selling decision by considering the relative positions of more than one moving average.
The risks you may be exposed to as a result of your transactions will be entirely at your own risk, as the buy / sell signals you will receive through this indicator will be revealed by your interpretation of the curves that will emerge according to the parameters and calculation methods you choose.
Moving Average Calculation Methods:
1. "S: Simple": Simple Moving Average (SMA)
2. "E: Exponential": Exponential Moving Average (EMA)
3. "DE: Double Exponential": Double Exponential Moving Average (DEMA)
4. "W: Weighted": Weighted Moving Average (WMA)
5. "VIDYA 1: VIDYA via St Dev": Variable Index Dynamic Average - by standard deviation (VIDYA)
6. "VIDYA 2: VIDYA via CMO": Variable Index Dynamic Average - via CMO (VIDYA)
7. "T: Tillson": Tillson - T3
8. "RMA: Running Mov Av": Running Moving Average (RMA)
Hope you will benefit from the indicator.
TÜRKÇE AÇIKLAMA
=================
MAVC: Moving Averages Combo by Mehmet Yildizli
==========================================
Bu indikatör ile birden fazla hareketli ortalamayı aynı grafik üzerine ekleyebilirsiniz. İndikatör ayarlarının başında, "Volume For Tillson" parametresi sadece Tillson hareketli ortalama seçimi yaptığınız zaman kullanılmaktadır.
"Use (high+low+2*close)/4" onay kutusunu onayladığınızda ise, bütün hareketli ortalamaların hesaplamalarına dahil edilecek kaynak veri olarak bu değer kullanılır. Bu onay kutusundaki onayı kaldırdığınızda ise KAYNAK kısmında yapacağınız seçime göre hesaplamalar yapılır.
Aynı anda 4 hareketli ortalamayı grafiğe ekleyebilirsiniz.
Her hareketli ortalama için farklı bir periyot ve farklı bir hesaplama yöntemi seçimi yapabilirsiniz.
Bu şekilde birden fazla hareketli ortalamanın birbirine göre durumlarını dikkate alarak alış/satış kararı verebilirsiniz.
Bu indikatör yoluyla alacağınız alış/satış sinyalleri, tamamen sizin belirleyeceğiniz parametre ve seçtiğiniz hesaplama yöntemlerine göre ortaya çıkacak eğrilerin sizin tarafınızdan yorumlanarak ortaya çıkacağı için işlemleriniz sonucunda maruz kalabileceğiniz riskler tamamen size ait olacaktır.
Hareketli Ortalama Hesaplama Yöntemleri:
1. "S:Simple" : Basit Hareketli Ortalama (SMA)
2. "E:Exponential" :Üstel Hareketli Ortalama (EMA)
3. "DE:Double Exponential": İkili Üstel Hareketli Ortalama (DEMA)
4. "W:Weighted": Ağırlıklı Hareketli Ortalama (WMA)
5. "VIDYA 1: VIDYA via St Dev": Değişken Hareketli Ortalama - standart sapma yoluyla (VIDYA)
6. "VIDYA 2: VIDYA via CMO": Değişken Hareketli Ortalama - CMO yoluyla (VIDYA)
7. "T:Tillson": Tillson - T3
8. "RMA:Running Mov Av": Running Moving Average (RMA)
İndikatörden faydalanmanız dileğiyle.

FishNet Doubled hullMA Reactive ColorsMoving averages are used to determine trend. These moving averages are designed to determine trend with reactive coloring and utilizes a unique version of the Hull moving average. This is one of many iterations of fishnet MAs I have made in the past.
I first found fishnet MAs, which is a lot of moving averages of increasing length, from @TusenPix
YMMV on actionable information :p

TEMA, DEMA and SMA with crosses with alert functionality
Just a crude but functioning ma indicator with bullish and bearish crosses and alert functionality.

Tillson T1 to T4 This is to expand on a previous publication on Tillson's T3 and add a T4 signal.
For the filter f = (1+a)x-ax^2
T1 = f
T2 = f*f
T3 = f*f*f
T4 = f*f*f*f
The above plotted produces a ribbon set of moving averages.
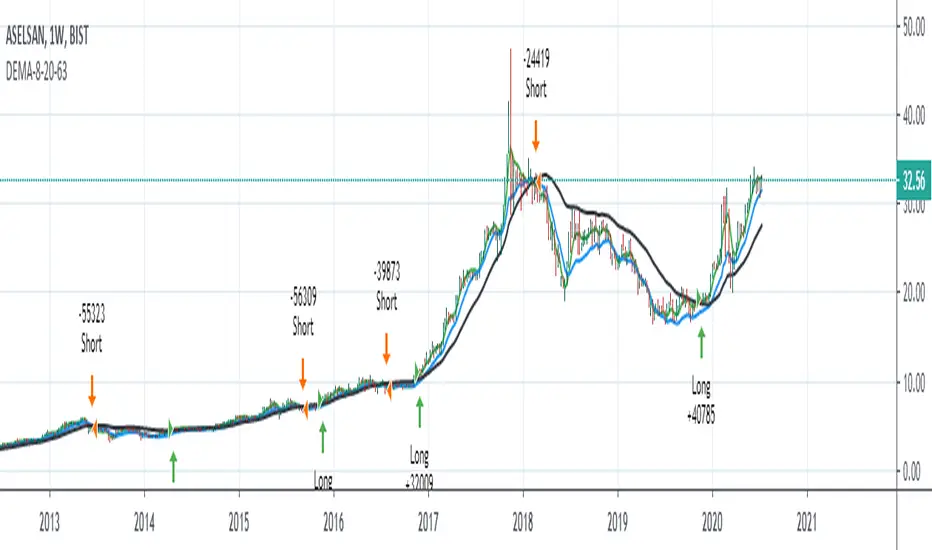
Double Exponential Moving Average 8-20-63 StrategyHello, this script was made upon the request of aliergin63, one of my followers.
I do not know exactly from whom it is quoted. (It may be author HighProfit.)
Long position when 8 dema is over 20 dema and 63 dema,
it opens a short position for the vice versa.
Alarms have been added.
%0.1 comission added.
Regards.
Note : DEMA = Double Exponential Moving Average
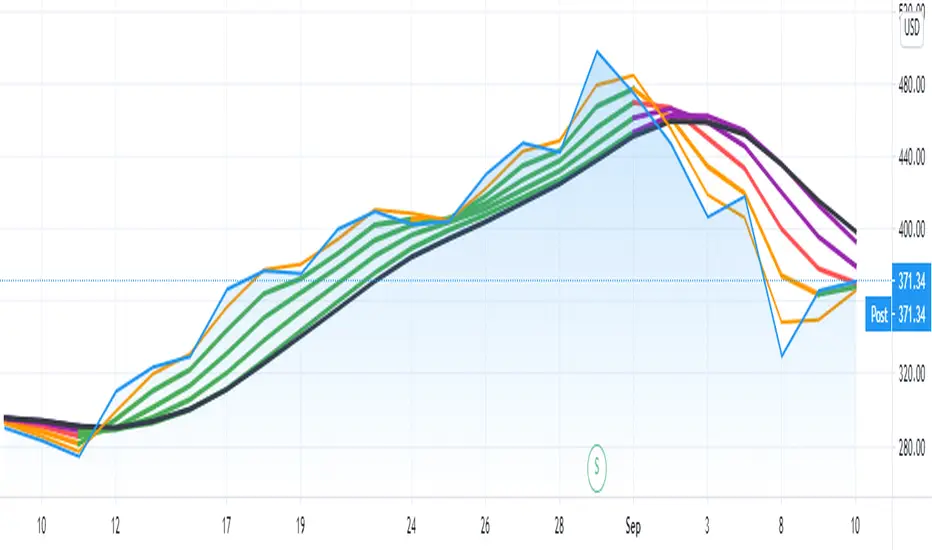
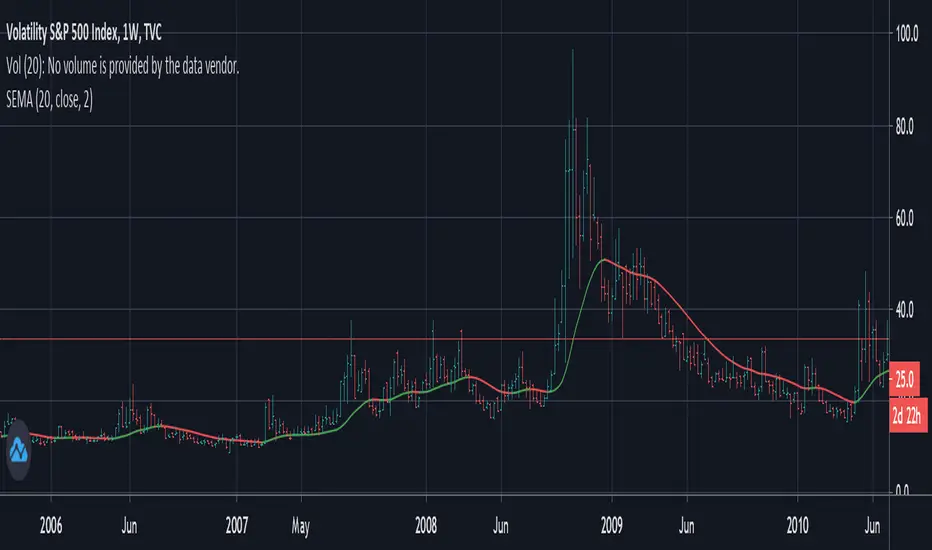
Slow/Smooth Exponential Moving Average [SEMA}An almost impossibly smooth moving average that is convenient for any application where a moving average is needed and where noise reduction is more important than responsiveness to very recent data. You get to choose what the S stands for.
Built by taking a weighted difference between two EMA's in such a way that the contribution of the latest value is cancelled out, while staying a proper moving average with all weights greater than zero, and with the first moment picked to be the same for a given length as the sma. Still has a somewhat ema-like behaviour in the sense that old values are gradually forgotten over time.
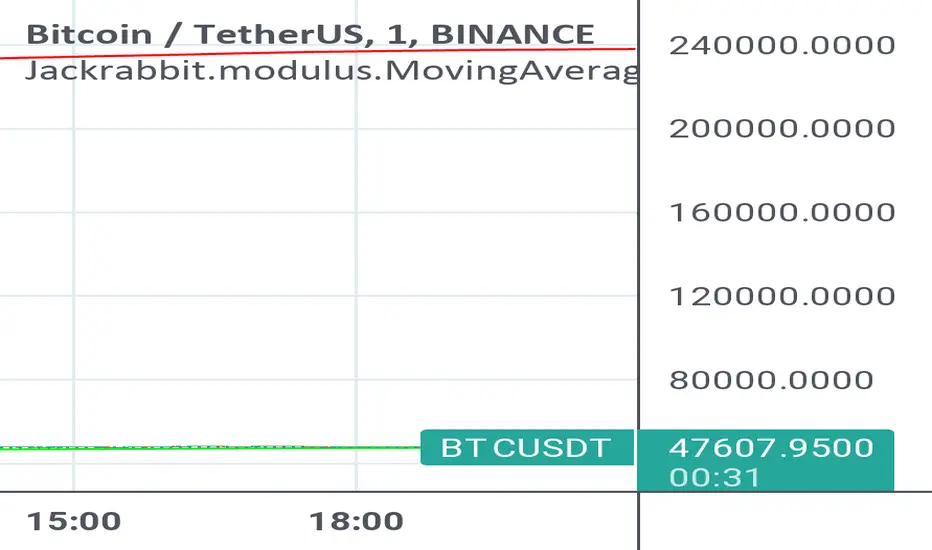
Jackrabbit.modulus.MovingAveragesThis is the Moving Averages indicator for the Jackrabbit suite and modulus framework.
This indicator supports differential timeframe analysis and confirmational bias. Dynamic timeframes are supported.
Three different algorithms are supported: Crossover/under, The 37 rule, and momentum. For momentum, the fast line is the upper boundary and the slow line is the lower boundrary. When crosses take place, the maximum and minimum vals are calculated properly in relation to the crossing points.
The main indicatior and the confirmational indicator can both be individually tuned for the fast, and slow moving averages with different and independent lengths and 27 different moving average types:
SMA, Double SMA, Triple SMA,
EMA, Double EMA, Triple EMA,
WMA, Double WMA, Triple WMA,
VWMA, Double VWMA, Triple VWMA,
Hull, Double Hull, Triple Hull,
ZLEMA, Double ZLEMA, Triple ZLEMA,
SWMA, Double SWMA, Triple SWMA,
SSMA, Double SSMA, Triple SSMA,
SMMA,Double SMMA, Triple SMMA
All moving averages can also have their own source input: Open, Close, High, Low, HL2, HLC3, and OHLC4
The Jackrabbit modulus framework is a plug in play paradigm built to operate through TradingView's indicator on indicatior (IoI) functionality. As such, this script receives a signal line from the previous script in the IoI chain, and evaluates the buy/sell signals appropriate to the current analysis. The results are either combined with the signal line, or used as confirmation to the signal line. A new signal line is generated for the next script in the link.
Buy/Sell alerts are produced by the main Jackrabbit script, or the modulus AlertSystem script. This script is not designed or meant to function outside my framework and contains no alert capabilities.
By default, the signal line is visible and the charts are turned off. Signal line visibility is controlled by the Style tab, and the charts display is controlled by the indicator settings tab.
This script is by invitation only. To learn more about accessing this script, please see my signature or send me a PM. Thank you.
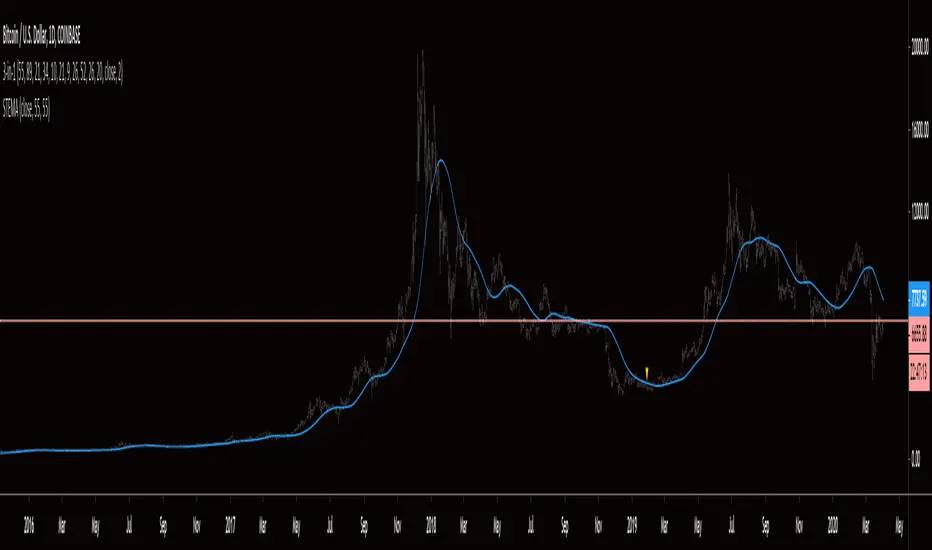
Smoothed Triple EMAThis indicator is exactly as it sounds, a smoothed triple EMA . In my personal use, it is applied to strategies to indicate direction of entries. A simple example would be if price is above the STEMA, look for long entries, if price is below the STEMA, look for short entries. Shortly, I will share a strategy that makes use of this indicator. You are welcome to message me if you have any questions. Thanks for checking it out an may the probabilities be with you!
DEMA Strategy with MACDThe Double Exponential Moving Average (DEMA) indicator was introduced in January 1994 by Patrick G. Mulloy, in an article in the "Technical Analysis of Stocks & Commodities" magazine: "Smoothing Data with Faster Moving Averages"
It attempts to remove the inherent lag associated to Moving Averages by placing more weight on recent values. The name suggests this is achieved by applying a double exponential smoothing which is not the case. The name double comes from the fact that the value of an EMA (Exponential Moving Average) is doubled. To keep it in line with the actual data and to remove the lag the value "EMA of EMA" is subtracted from the previously doubled ema.
DEMA is a very responsive system. A lot of signals can be generated only when trading with DEMA. In this strategy, I combined Dema buy-sell signals with MACD indicator. When you activate MACD confirmation from settings; When DEMA comes to long situation, the MACD histogram is checked to be positive.

Bitcoin Cycle Top IndicatorBitcoin Cycle Top Indicator on the 1W Bitcoin Logarithmic chart.
Called all 3 tops so far to a T, this indicator will be great use for the next upcoming cycle.
I kept it sweet and simple, no need to overcomplicate. That's all this indicator does.

EMA Cross <Johnson Lim>EMA Cross basically is for someone who just need to spot as a guideline whether there are 'opportunity' to buy in or out. I had been using this for few years and it always helps for me at the stage of screening typically on Crypto space.

Triangular moving average (or Saucius) Bands v2Two bands are designed around the triangular moving average (see sauciusfinance altervista for further references).
Bands based upon triangular bands are more precise and quicker than those which use Bollinger’s method (simple moving average), Keltner’s one, Highs and lows and so on.
Just enter long when prices cross over “middleband” and go short viceversa. As filter, the color of the signal’ candle (green/red, i.e. close minus open) must be coeherent with your next position (price shall go down if you want to go short and viceversa).
Upper and lower bands are the target: close the position when price undergo the upper band (or High band) in case of long and when price overcome the lower one (Low band) in case of short. Frequently price have a retracement towards middleband: for being safe, open another long position again (after the previous one) if the close is higher than the upper band (lower than the lower band in case of short).
K is only a factor to determine the distance of the middleband to the lower one (since Big stock markets tends always to grow, short is less interesting).
You can use my indicator in all temporal frame for many (not all!) financial instruments.
For a quick (but not hysteric) trading, use graph 30′ to open position, and wait the next bar for a confirm. As second filter, simply open position coerehent with the daily graph (I meanif in daily desk signal is long, do not open short position in the 30 minutes’ one).
Blue lines are the fixed exiting prices (stop loss / target profit) while bands are coloured.
Enjoy them!
Contact me for any questions about the code

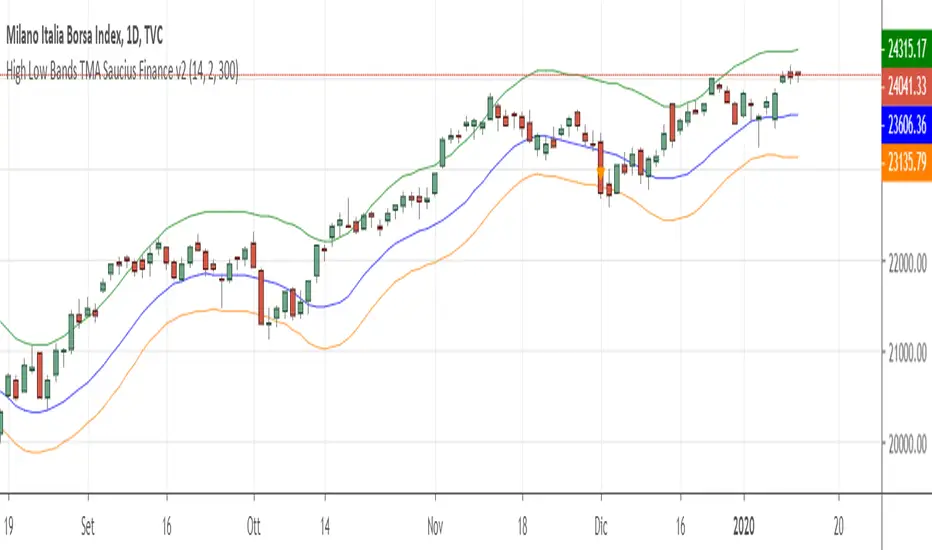
High Low Bands Triangular Moving Avg Saucius Finance v2Bands based upon triangular bands are more precise and quicker than those which use Bollinger’s method (simple moving average), Keltner’s one, Highs and lows and so on.
Just enter long when prices cross over “middleband” and go short viceversa. As filter the color of the signal’ candle must be coeherent with your next position (price shall go down if you want to go short and viceversa).
Upper and lower bands are the target: close the position when price undergo the upper band (or High band) in case of long and when price overcome the lower one (Low band) in case of short. Frequently price have a retracement towards middleband: for being safe, open another long position again (after the previous one) if the close is higher than the upper band (lower than the lower band in case of short).
K is only a factor to determine the distance of the middleband to the lower one (since Big stock markets tends always to grow, short is less interesting).
You can use my indicator in all temporal frame for many (not all!) financial instruments.
I recommend in particular to use Heiken-Ashi figure (but you can use the standard one). For a quick (but not hysteric) trading, use graph 30′ to open position, and wait the next bar for a confirm. As second filter, simply open position coerehent with the daily graph (I meanif in daily desk signal is long, do not open short position in the 30 minutes’ one).
Contact me for any explanation and watch my site!
Assassin Flip Emaflip ema
fast and slow show ema param
fastparam show fast over slow , ema = ema * fast_param
slow over fast , ema = ema * slow_param
