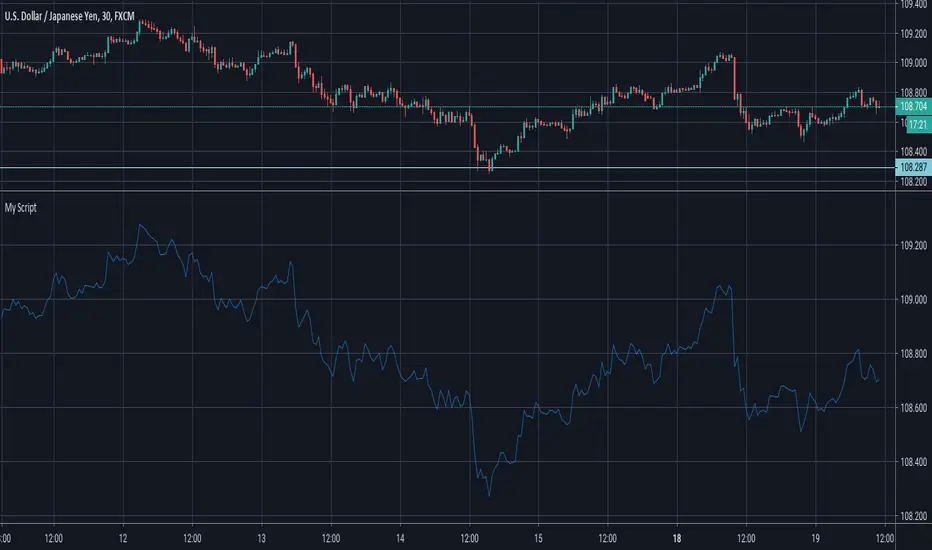
[PX] MTF Standard Deviation LevelHello guys,
once again, I want to show you a different method for detecting support and resistance level. Today's approach is similar to the one I posted recently, but the way the level will be detected is different. I call it the multi-timeframe standard deviation level.
How does it work?
The method is similar to the way Bollinger Bands work. First, the indicator calculates the standard deviation, which can be influenced by the "Sensitivity"- and "Length"-setting.
Sensitiitiy - the higher the value, the fewer level will be shown
Length - simply the length for the standard deviation formula
Second, the detected value will be added (for resistance level) or substracted (for support level) from the current close. Once the upper or lower boundaries are crossed, a level will appear and keeps moving until the up- or downward movement finishes. Then the level will settle and stay in place.
Again, as seen in my previous indicator, you can control all the different styles and colors for the levels. The best part is, the whole thing works in a multi-timeframe fashion. In an example, you could select the "Daily" level and plot them on a 4-hour chart.
If you find this indicator useful, please leave a "like" and hit that "follow" button :)
Have fun, happy trading and once again Merry Christmas :)))
منطقة طلب

BBPivotIt can helps you to see BB pivots . It's based on bollinger bands .
Best Settings: (20,3) - (50,2)
Cheers :)

Demand/Supply ZonesThis script will draw the supply and demand zone so you can always enter the best places. Cheap stop-loss and BIG Take Profits.
I will leave the scripts available during the weekend and if you want it, send me a message.
Leo Hermoso

Supply and Demand ZonesSupply and Demand zones do offer a great insights into the structure of any market. If you have an idea of how to trade with support and resistance zones, you might find supply and demand zones very similar.
1. Focus on a price level (zone)
It’s difficult to analyze the market without a focal point. If you look for turning points at every price level, you will only find confusion.
How do you know which price level to focus on? Which price levels are potential market turning points?
2. Observe what happened (happens) at the potential support/resistance
Signs of strong demand
When the market tests a potential support, look out for:
Bullish price pattern
Inability to clear below the support
Increased volume
Congestion
Signs of strong supply
When the market tests a potential resistance, look out for:
Bearish price pattern
Inability to clear above the resistance
Increased volume
Congestion
Look for these price action signals in the past, as well as in real-time price action. The more signs you see, the more likely you’ve found a true support/resistance zone.

Pump, Dump and Accumulation Tracker (VIP User)ThunderTrader : ThunderLight
ThunderLight is indicator to track or calculate hidden consolidation or accumulation where the whales prepare for next pump
ThunderTrader : ThunderRainbow
ThunderLight is indicator to track or calculate hidden demand, supply and accumulation where the whales prepare for next pump or next dump
Time Frame Rules:
It works for any timeframes below 1W, but some times it will not work for new listing until sufficient data are appeared
TF 30m is very good for entry plan
TF 1H is very good daily tracking
TF 4H is very good for weekly tracking
Disclaimer:
The high demand or high accumulation signal will not immediately trigger the pump. It can take some times, usually TF 1H will trigger the action from 8 to 24 hours.
The high demand or high accumulation signal is not always pump identification but also mini rally or uptrend
The high supply is not alway high dump or end of trend, if it's followed by supply it can continue to pump rally
Alert System:
You can integrate ThunderRainbow or ThunderLight to your Alert System, so that you will not miss the pump by the whales
This is for VIP membership, if you want trial version, please visit:


Volume Supply and Demand ZonesDraws supply and demand zones of 3 types, based on 3 different volume threshold parameters.
The timeframe of the script is fixed (you can change it in the options), so for example it is possible to keep Daily S/D zones while looking at 1h chart.

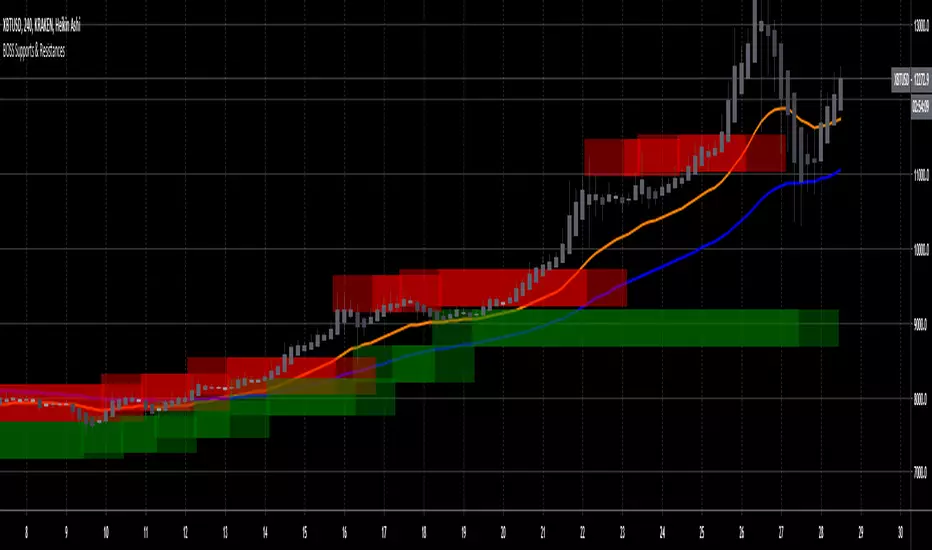
Boss Support and Resistance zonesTHE BEST FOREX, BINARY OPTIONS, AND CRYPTO INDICATORS FOR TRADINGVIEW.COM
Green = Support Zones
Red = Resistance Zones
The basic trading method for using support and resistance is to buy/long near support in uptrends, and to sell/short near resistance in downtrends.
Also included in this indicator are a Higher High, Lower High, Higher Low, and Lower Low indicator as well as Fast and Slow EMA'S
Available at bosscripts.com
Website bosscripts.com
Demand and Supply Zones indicatorThis Script automatically marks Demand and Supply Zone on the chart

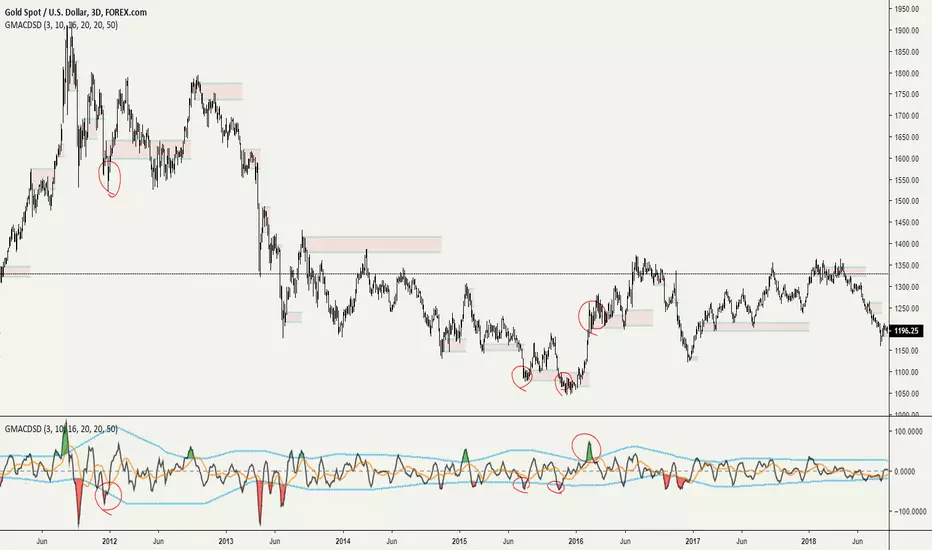
Grimes Modified MACD Supply DemandA follower of mine asked me if I could make a version of my www.tradingview.com script using the MACD. Well it just so happens I was making a few modifications to my MACD script: just as this question came up so I went ahead and threw this together.
The MACD that triggers the SR zones is pictured below, with key trigger points encircled to illustrate how it works.
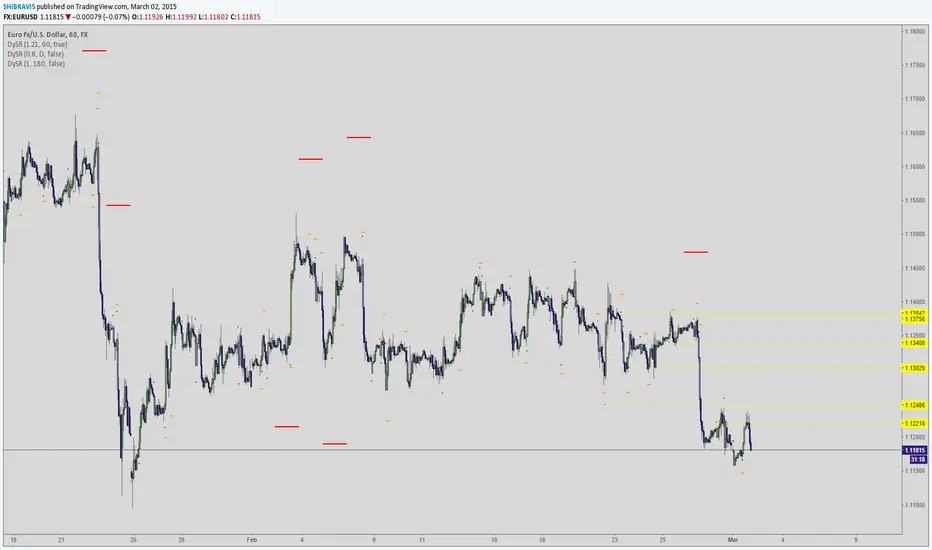
Volume Based S/RI got a question if it would be possible to Automatically draw S/R levels based on Volume rather than RSI as I had earlier done in this script;
Well it certainly is and it looks as though it might even be tradeable.
The indicator compares the size of volume bars so that if there is a noticeable increase in volume (noticeable here meaning above the indicator threshold) it marks the bar high and low prior to the bigger volume candle.

Godmode 4.0.2 [Supply/Demand]First off, a huge thank you to the following people:
LEGION:
LazyBear: www.tradingview.com
xSilas: www.tradingview.com
Ni6HTH4awK: www.tradingview.com
sco77m4r7and:
SNOW_CITY: www.tradingview.com
oh92: www.tradingview.com
alexgrover: www.tradingview.com
cI8DH: www.tradingview.com
DonovanWall: www.tradingview.com
shtcoinr: www.tradingview.com
This is the third iteration of Godmode. This time I borrowed the method used by shtcoinr to render supply/demand, resistance and support zones. The idea here is to input the appropriate benchmark tickerid to the asset class you're trading and to paint zones according to the price activity of the selected tickerid. This works very well trying to paint meaningful zones against noisy stocks, currencies, commodities etc. Use a correlation coefficient to determine the best benchmark for your asset class.
Want to Learn?
If you'd like the opportunity to learn Pine but you have difficulty finding resources to guide you, take a look at this rudimentary list: docs.google.com
The list will be updated in the future as more people share the resources that have helped, or continue to help, them. Follow me on Twitter to keep up-to-date with the growing list of resources.
Suggestions or Questions?
Don't even kinda hesitate to forward them to me. My (metaphorical) door is always open.

💪 Support / Resistenace 👊 Finder by 🇨🇷🇾🇵🇹🇴🇷🇹🇭🇾🇭🇲🇸💪 Support / Resistenace 👊 Finder (SRF) dynamically finds support and resistance (supply and demand) levels automatically and weights them accordingly. This is a great tool to use when determining entry/exit upon S/R areas.
💰This indicator is given FREE to all our premium indicator subscribers.
📡SRF calculates the levels working from the current price. So even if you are looking old at historical data it will still calculate the S/R levels from the most recent data. (i.e. it really only works for the last few months on most instruments)
📑The indicator works on any timeframe and any market (stocks, forex, crypto, gold, oil).
📊The option "Pre length" can be changed to fit your needs. It will determine how much historical data the indicator will evaluate for each S/R level.
📊You can also choose how many support/resistance lines to plot from the dropdown menu.
📉Lastly you can also show the current/previous week or months OLHC values. These can often act as S/R levels as well. I suggest only using one at a time or it can get confusing.
💬Come chat with us in telegram (link in signature) if you have any questions or would like a trial of a premium indicators (linked below).
Bull Bear Filter
Bottom Top Finder

5 EMAS e 50% body candle by Blackwolf dailyScript to visualize 5 EMAS at period 5, 13, 50, 200, 800 for Daily timeframe and also it shows 50% bodycandle.
Use it to understand the trend and domand/supply zone.

Long Short TellerIt tells you to go short or long. If you find the square under go long, if it's above, go short. Make your own multiplier and time frame. As fas as I testing it myself on 1H with 1D resolution, finding no repaint. It will appear and disappear sometimes but once you refresh it, it will be the same. If you find any repainting, change the position and please comment to warn others.
Have to protect the code just in case someone will comercialise this.

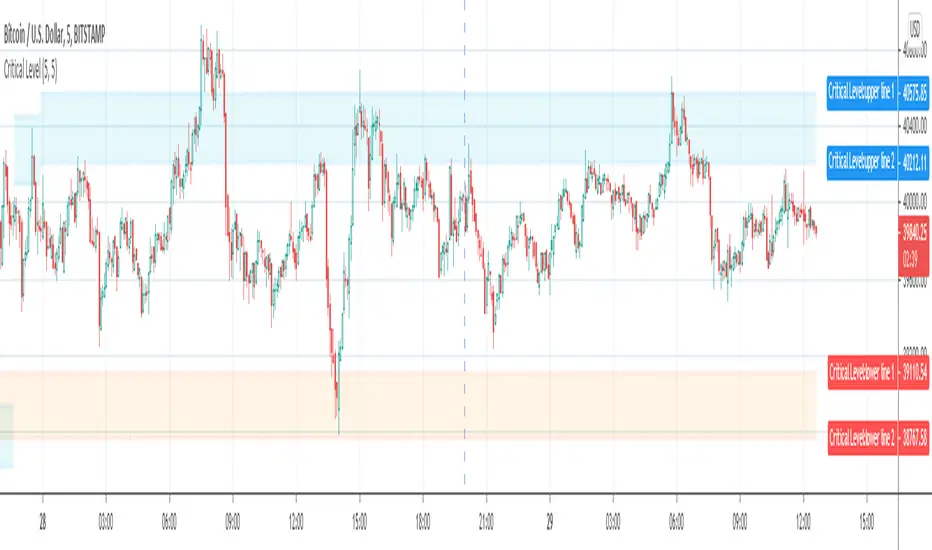
Critical Support & Resistance Level (supply & demand zone)Support & Resistance Level and Supply & Demand Zone are very common and popular jargon in technical analysis.
What is the difference between Support & Resistance Level and Supply & Demand Zone?
In my opinion, Support & Resistance Level is the value of price that tested couple times and hard to break. The zone is formed by two adjacent levels where price may oscillate between those two levels.
Imagine the levels as horizontal lines, and the zones are areas between two horizontal lines.
Why are they important?
In a nutshell, they indicate where the price direction may reverse so you can act accordingly.
There are a couple methods to draw the Support & Resistance Level and Supply & Demand Zone, In most case, people will use swing high or low, or pivot points as the level. But there are too many of them, and not all pivot points will become Support & Resistance Level.
Some of the support or resistance level is hard to break, but after the price break through that level, resistance will become support and vice versa, I define it as Critical Level .
If you draw a critical support or resistance level from the current bar and move backward to where it started, you will notice that some levels are formed by the pivot points from hundreds of bars ago. It's impossible to discover the Critical Levels if you don't have enough bars loaded on chart.
The purpose of this indicator is to plot critical support and resistance level automatically on chart.
It will work on all market, Stock, Forex and Futures. It also works on all timeframes.
Inputs:
The Strength inputs control the intensity of Support & Resistance Level.
The Alert input is the switch of alert function.
By enable Enhanced mode, the indicator will be more critical.
Check Showline input to plot level lines on chart, otherwise, it will plot zones only.
Dynamic SUPRES Multi Timeframe UpdateDynamic SUPRES can be interpreted in different ways. Each square marks an area of congestion that could serve as support and resistance.
FLASH UPDATE: Now is possible to choose the timeframe and the bars color on/off.
Dynamic SUPRESDynamic SUPRES can be interpreted in different ways. Each square marks an area of congestion that could serve as support and resistance.
