OJLJ Elliott Waves DetectorThis script is made to identify Elliot Waves by setting a zigzag line as principal source, it identifies patterns with the most common rules, in the chart you will see a number in each wave detected, a wave could have the characteristics to be two different waves so it will be plotted the options that could be, To identify which one is most trustable I suggest to use the Fibonacci levels options.
Features:
+ All waves ? (Option to show just the 5 Wave patterns recognition)
+ Draw zigzag line (Option to show the zigzag line)
+ Supports Multiple instruments, from FOREX to Stocks
+ It works on all the timeframes
+ Show Fib levels (Option to show the Fibonacci levels)
+ Fibonacci levels fit test (Green crosses mark were should a Bull wave be to fit with a Fibonacci Level While the purple crosses show were should the wave fit to be a bear trend, the more closer with the point of the wave the most trustable Example, a 5 Wave Bull could also be a 2 Bear Wave, if the green cross is closer to the orange point of the wave then is a 5 Wave Bull, if the purple cross is closer to the orange point)
+ A background color also show when a 5 pattern is identified
+ The way to plot the zigzag can be changed with 3 Input options
Characteristics to add in future updates:
+ Detect more than 1 cycle at the same time
+ Use a volume indicator to identify how many volume was traded in each wave
+ Implement the use of the EWO (Elliot Wave Oscillator)
+ Improve the display
+ Identify ABC patterns
+ Add triangles and Zigzag formations
To have access to this script please send me a message ;D
Detection

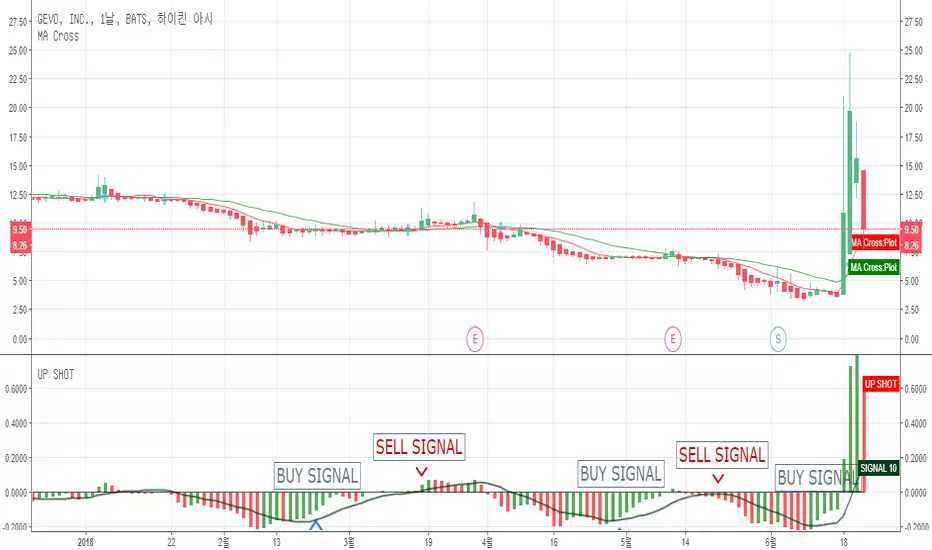
UP SHOTThis indicator is simple, uncomplicated, and easy to see.
There is no need to study separately and it applies to most items.
Everything is a UPSHOT.
1. Observe signal from upside reversal. We do not anticipate a downgrade.
2. The signal must be upward and only the green histogram should be bought. The value of the histogram should be higher than the signal.
3. Signal crosses zero with golden cross then sells again when signal crosses the signal line again.
4. If your judgment is not good, you should increase the chart cycle.
- It is free for testing now, but it can be locked at a later date.
- Feedback is always welcome. Your reply may be delayed, but I will reply.
이 지표는 심플하고 복잡하지 않으며, 보기 쉽게 만들어 졌습니다.
별도의 공부가 필요없고, 대부분의 항목에 적용 됩니다.
1. 시그널이 상향반전시 부터 관찰한다. 하향시에 예상 매수하지 않는다.
2. 반드시 시그널이 상향하고 녹색 히스토그램에만 매수하여야 한다. 시그널보다 히스토그램의 값이 높아야 한다.
3. 시그널이 0을 골든크로스 한뒤 히스토그램이 재차 시그널선을 골든크로스 하면 매도한다.
4. 판단이 잘 서지 않으면, 차트 주기를 늘려서 확인하여야 한다.
- 테스트용으로 현재는 무료이나, 추후에 잠길 수 있습니다.
- 피드백은 언제나 환영합니다. 답장이 늦어질 수 있으나, 반드시 답변 하겠숩니다.
Trend Detection IndexTrend Detection Index indicator script.
This indicator was originally developed by M.H. Pee (Stocks & Commodities V. 19:10 (54-61): Trend Detection Index).
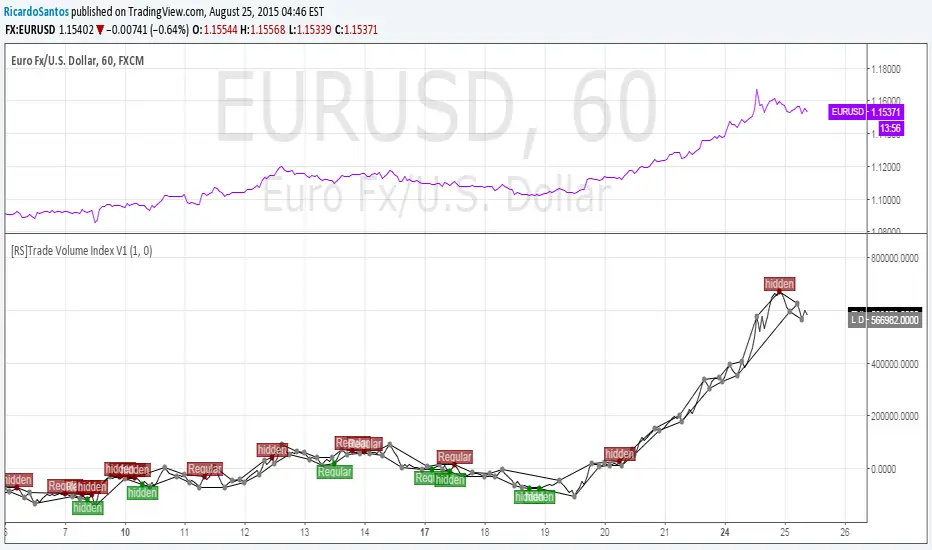
Price Divergence Detector V3 revised by JustUncleLThis is a revised version of the original "Price Divergence Detector by RicardoSantos".
Description:
Price Divergence detection for various methods : RSI, MACD, STOCH, VOLUME, ACC-DIST, FISHER, CCI, BB %B and Ehlers IdealRSI. Both Hidden and Regular Divergences are detected.
Mofidifications:
Revision 3.0 by JustUncleL
Added option to disable/enable Hidden and Regular Divergence
Added new divergence method BB %B (close only)
Added new divergence mothos Ehlers IdealRSI (close only)
Revision 2.0 - by RicardoSantos
References:
Information on Divergence Trading:
www.babypips.com
www.incrediblecharts.com (BB %B)


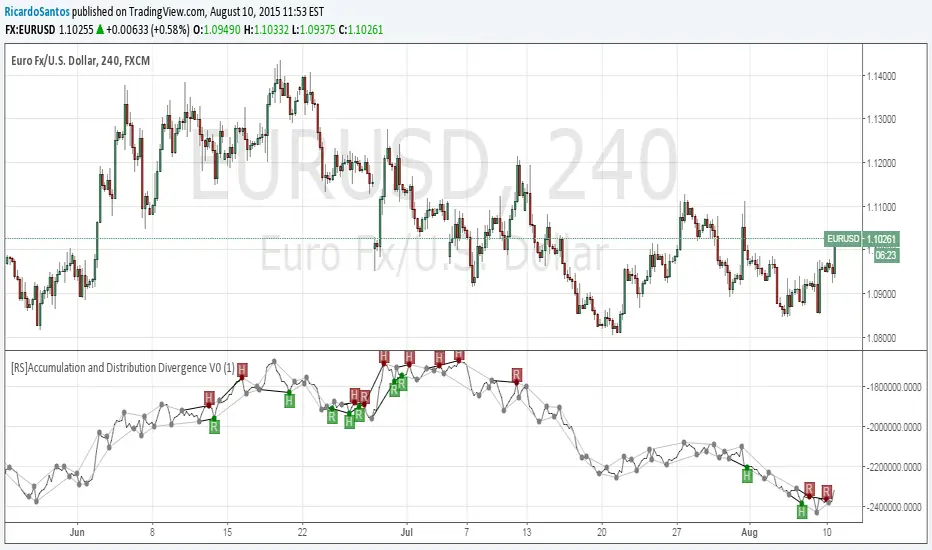
[RS]Accumulation and Distribution Divergence V0EXPERIMENTAL: Accumulation and Distribution Divergence detection.
[RS]MACD Divergence V0EXPERIMENTAL:
MACD Divergence detection.
looks like macd is more prone for missing the extremes in price then the rsi due to lag.

FREE INDICATOR: POLARIZED FRACTAL EFFICIENCYLooking for something other than a moving average to help determine not only a trend's strength, but also it's direction? Try PFE!
PFE was developed by Hans Hannula that was invented to determine price efficiency over a user-defined time period.
The Polarized Fractal Efficiency indicator is, in the essence, an exponentially smoothed ratio of the length of two lines: (1) of a straight line between today’s close and the close Period days ago, and (2) of a broken line connecting all Close points between today and Period days ago. The indicator output varies between -100 and 100. The theory behind this indicator is that if it is >50 (or <-50) then the market is likely to reverse its trend from positive to negative (or from negative to positive).
Other usage:
Securities with a PFE greater than zero are deemed to be trending up, while a reading of less than zero indicates the trend is down. The strengh of the trend is measured by the position of the PFE relative to the zero line. As a general rule, the further the PFE value is away from zero, the stronger and more efficient the given trend is. A PFE value that fluctuates around the zero line could indicate that the supply and demand for the security are in balance and price may trade sideways.
As with all indicators, finding something that works well along side this would be the most beneficial way to use it.
Perhaps something like the Choppiness Index (related idea below) could do the trick.
Grab the source code here: pastebin.com
Installation video by @ChrisMoody here : blog.tradingview.com
