[FT] ADX-Multi-TF by FractalTraderAverage Directional Index is a way to determine trend strength (and whether there is a trend). One of the caveats is when you have trendless conditions on a higher timeframe. You can get whipsaw conditions on the current timeframe in that case.
The purpose of this script is to put ADX into the context of a higher degree trend on a single indicator.
DMI


DMI Stochastic Extreme - DMI Stochastic Extreme - Version 2
- Replaced B with , Replaced S with
- Ability to change Overbought and Oversold Levels
- Clean PineScript
List of All my Indicators - www.tradingview.com

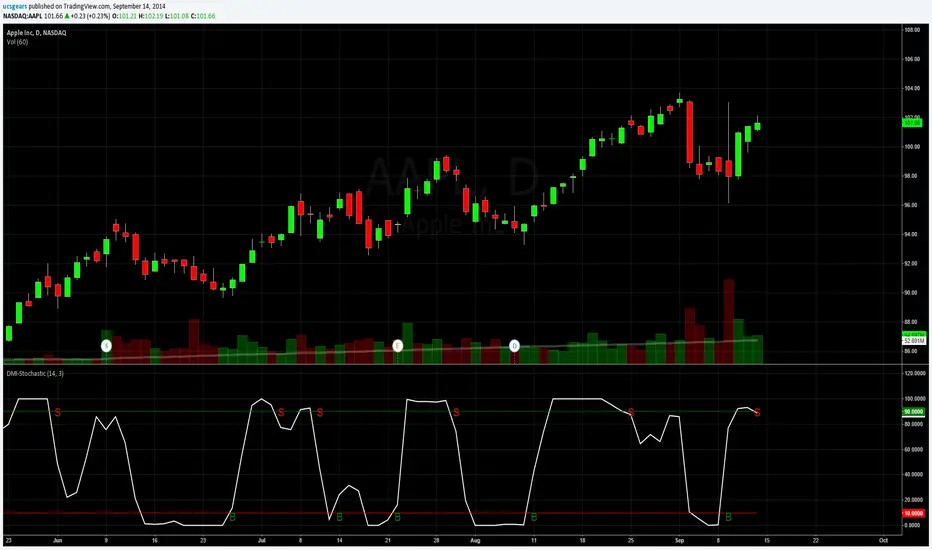
DMI Stochastic ExteremeUSed the DMI Oscillator created by LARK "https://www.tradingview.com/v/T79b6F5n/" to create this DMI Stochastic Extreme. You can also use the DMI Stochastic by Lark
Updated Version -
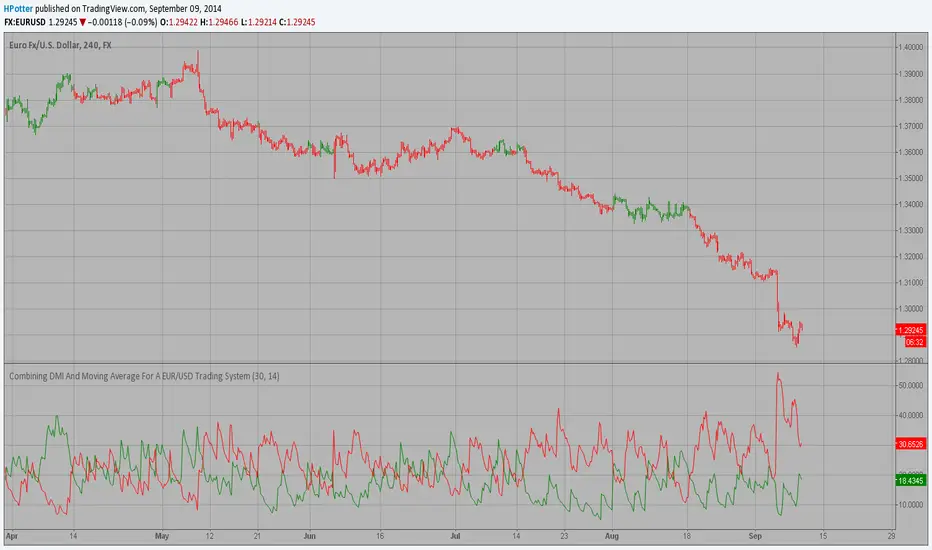
Combining DMI And Moving Average For A EUR/USD Trading SystemCombining DMI And Moving Average For A EUR/USD Trading System, by Rombout Kerstens
The related article is copyrighted material from Stocks & Commodities Aug 2009
TheLark: Directional Movement Index StochasticThere is a nice writeup about a system that uses DMISTO here, which includes decent statistics:
traderedge.net
I have not yet done any back testing on the system as a whole myself, but thought the DMISTO was an interesting indicator, so ported it over for those who might want to play with it and create their own systems. I added dots that denote signals similar to the system described above, which can be turned off if desired.

TheLark: Directional Movement Index OscillatorA modified DMI, This turns the standard DMI into an Oscillator. The DMI cross signal is the same, but as an OSC you get the added benefits or finding divergences, etc. The added WIlder's Average Line (blue) can help you see if a short term trend is getting less interesting.

The Lark: Directional Movement IndexAn open source version of the DMI. Mostly published for other scripters to modify.
Typical useage: www.investopedia.com

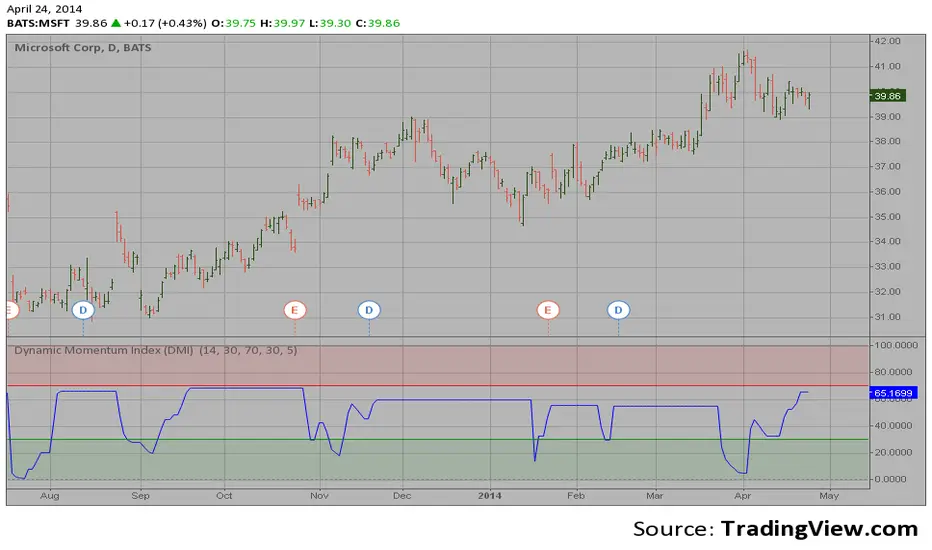
Dynamic Momentum Index (DMI) This indicator plots Dynamic Momentum Index indicator. The Dynamic Momentum
Index (DMI) was developed by Tushar Chande and Stanley Kroll. The indicator
is covered in detail in their book The New Technical Trader.
The DMI is identical to Welles Wilder`s Relative Strength Index except the
number of periods is variable rather than fixed. The variability of the time
periods used in the DMI is controlled by the recent volatility of prices.
The more volatile the prices, the more sensitive the DMI is to price changes.
In other words, the DMI will use more time periods during quiet markets, and
less during active markets. The maximum time periods the DMI can reach is 30
and the minimum is 3. This calculation method is similar to the Variable
Moving Average, also developed by Tushar Chande.
The advantage of using a variable length time period when calculating the RSI
is that it overcomes the negative effects of smoothing, which often obscure short-term moves.
The volatility index used in controlling the time periods in the DMI is based
on a calculation using a five period standard deviation and a ten period average
of the standard deviation.