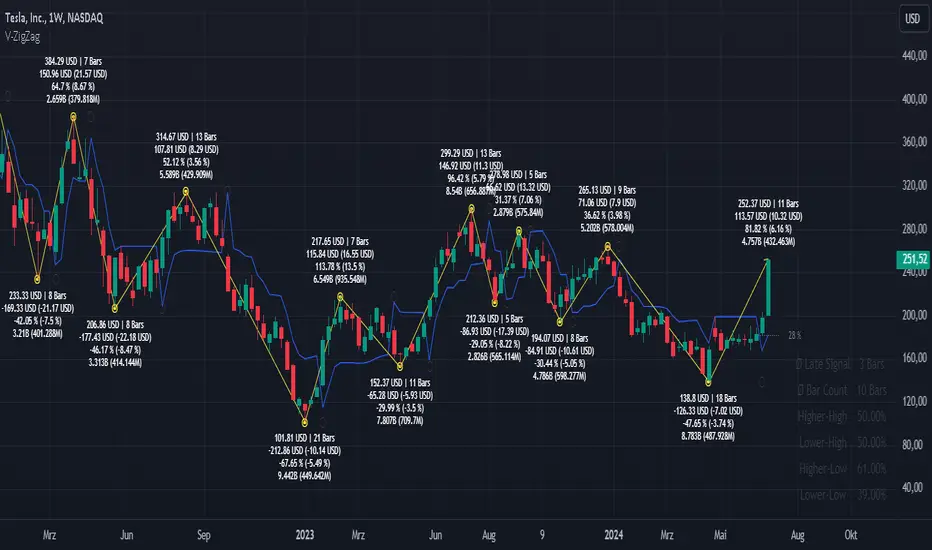
Volatility ZigZagIt calculates and plots zigzag lines based on volatility and price movements. It has various inputs for customization, allowing you to adjust parameters like source data, length, deviation, line styling, and labeling options.
The indicator identifies pivot points in the price movement, drawing lines between these pivots based on the deviation from certain price levels or volatility measures.
The script labels various data points at the ZigZag pivot points on the chart. These labels provide information about different aspects of the price movement and volume around these pivot points. Here's a breakdown of what gets labeled:
Price Change: Indicates the absolute and average percentage change between the two pivot points. It displays the absolute or relative change in price as a percentage. Additionally, the average absolute price increase or the average rate of increase can also be labeled.
Volume: Shows the total volume and average volume between the two pivot points.
Number of Bars: Indicates the number of bars between the current and the last pivot point.
Reversal Price: Displays the price of the reversal point (the previous pivot).
موجات إليوت
Zig-Zag Open Interest Footprint [Kioseff Trading]Hello!
This script "Zig Zag Open Interest Footprint" calculates open interest x price values for zig zag trends!
Features
Open interest footprints anchored to zig zag trends
Summed OI x price level footprints
Total OI (for each category) for the entire trend shown
Standard POC lines, in addition to separated POC lines for each category of open interest x price possibility
Up to 9999 profile rows per zigzag trend
Stylistic options for profiles
Configurable zig zag - footprints generated for small to large trends
The zigzag indicator is configurable as normal; minor and major trend volume footprints are calculable. This indicator can be thought of as "Open Interest Footprint for Trends''.
Up to 9999 open interest levels (price levels) can be calculated for each profile, thanks to the new polyline feature, allowing for less aggregation / more precision of open interest at price.
Zig Zag OI Footprints
The image above shows primary functionality!
Green = Higher OI + Higher Price
Yellow = Lower OI + Higher Price
Purple = Higher OI + Lower Price
Red = Lower OI + Lower Price
Profiles are generated for each trend identified by the zigzag indicator.
The image above shows the indicator calculating open interest x price for specific price blocks on the footprint. Aggregate open interest for the identified trend is displayed over the profile!
Neon highlighted values correspond to the highest open interest change for the category. This is a configurable option :D
The image above shows POC lines for each category of open interest x price!
Additionally, you can select to show a single POV for footprint - the single level the greatest amount of OI change occurred.
The indicator is robust enough to calculate on "long zig zags" and "short zig zags"; curved profiles can also be used!
The image above shows key levels, each OI footprint, and summed OI values for the current trend!
That's about it :D
This indicator is part of a series titled "Bull vs. Bear" - a suite of profile-like indicators I will be releasing over the coming days. Thanks for checking this out!
If you have any suggestions please feel free to share!

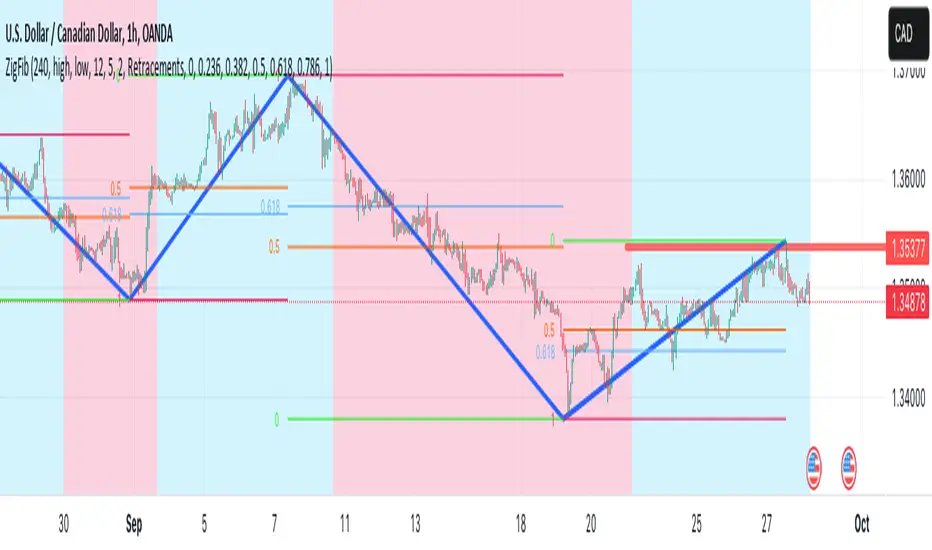
ZigZag++ FibonacciAuto Fibonacci tools are powerful ways designed to simplify your technical analysis by automatically drawing Fibonacci retracement and extension levels on your chart. This indicator is built to enhance your trading experience with clearer market moves and informative insights.
You can easily spot your waves and patterns when the percentages are moving with you.
Key Features:
Automated Fibonacci Levels: Plots Fibonacci retracement and extension levels based on recent price movements.
Multi-Timeframe Support: This indicator is your versatile companion, offering multi-timeframe functionality. You can seamlessly track Fibonacci levels across different resolutions, providing a comprehensive view of the market.
Two Types of Fibs: Retracement and Timeframe extension Fibonacci levels. Use retracements to identify potential reversal points and extensions to anticipate price targets, giving you a well-rounded perspective on market movements.
Benefits:
Save Time: No more manual Fibonacci drawing; It does this for you in real-time.
Enhanced Analysis: Gain a deeper understanding of potential support, resistance, and price targets.
User-Friendly: Suitable for traders of all levels, this indicator simplifies complex technical analysis.
For the math lovers
I started creating the ZigZag++ based on the MT4 calculation as I found it better performing than the tradingview inbuilt one. I have revised the calculation couple of times and now the final calculation is simple yet more accurate for my analysis.
First, I observe the market direction for the last Depth setting by comparing the rate at which high values reduce and low values increase. When the number of ticks set by Deviation is crossed and the last cross is more than the Backstep candles, then we have our ZigZag points.
These are the points we use in our Fibonacci calculation.
Checkout ZigLib below to use the same logic in your scripts.
Sample usage
This is a 4 Hour configuration with the default settings.
When the trend reversed, some key points I watch are 0.618 and 0.5. The market retraced back and formed the new point for the next ZigZag line on that level. This market behaviour happens quite often on these Fibonacci points. I would be looking for reversal or a break in this zone to know the next step.
Resources
ZigZag++ Lib by me; for retrieving the line points.
Fibonacci Toolkit by Lux Algo; For drawing the Timeframe Fibs. Very Amazing script.
Zigzag Chart Points█ OVERVIEW
This indicator displays zigzag based on high and low using latest pine script version 5 , chart.point which using time, index and price as parameters.
Pretty much a strip down using latest pine script function, without any use of library .
This allow pine script user to have an idea of simplified and cleaner code for zigzag.
█ CREDITS
LonesomeTheBlue
█ FEATURES
1. Label can be show / hide including text can be resized.
2. Hover to label, can see tooltip will show price and time.
3. Tooltip will show date and time for hourly timeframe and below while show date only for day timeframe and above.
█ NOTES
1. I admit that chart.point just made the code much more cleaner and save more time. I previously using user-defined type(UDT) which quite hassle.
2. I have no plan to extend this indicator or include alert just I thinking to explore log.error() and runtime.error() , which I may probably release in other publications.
█ HOW TO USE'
Pretty much similar inside mentioned references, which previously I created.
█ REFERENCES
1. Zigzag Array Experimental
2. Simple Zigzag UDT
3. Zig Zag Ratio Simplified
4. Cyclic RSI High Low With Noise Filter
5. Auto AB=CD 1 to 1 Ratio Experimental

ZigLibLibrary "ZigLib"
Calculate the points for ZigZag++.
You can use custom data and resolution for your ZigZag++.
Sample Usage
import DevLucem/ZigLib/1 as ZigZag
= ZigZag.zigzag(low, high)
bgcolor(direction<0? color.rgb(255, 82, 82, 80): color.rgb(0, 230, 119, 80))
line zz = line.new(z1.time, z1.price, z2.time, z2.price, xloc.bar_time, width=3)
if direction==direction
line.delete(zz )
zigzag(_low, _high, depth, deviation, backstep)
Get current zigzag points and direction
Parameters:
_low (float)
_high (float)
depth (int)
deviation (int)
backstep (int)
Returns direction, chart point 1 and chart point 2

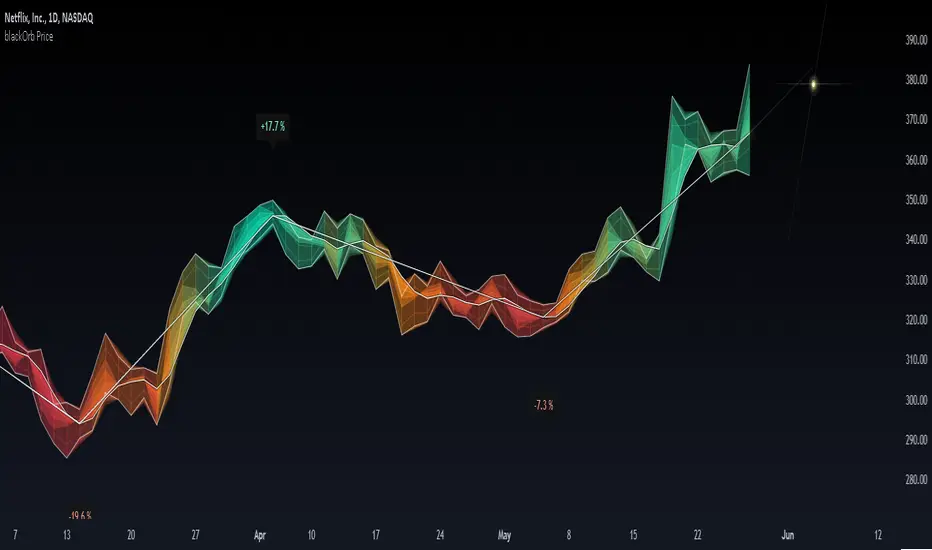
blackOrb PriceblackOrb's Aspiration: Enhancing the Functionality of Area Charts
At its core, an area chart analysis serves as the foundational structure for blackOrb Price. Area charts can be seen as an addition to conventional price charts. Unlike price line charts, which connect closing prices with lines, an area chart fills the space between high and low prices, creating a visual representation of price ranges. This approach can offer several advantages, particularly in assessing price volatility and price dynamics.
A wider area between high and low suggests high volatility, while a narrower area indicates lower volatility. The orientation of the closing price concerning the high-low range provides insights into whether buyers or sellers are exerting influence on the market.
Combined with the following elements, this chart tool can support comprehensive data-driven trading analysis:
- Integrated moving averages for price dynamic insights
- Zigzag pivot identification for price level insights
- Stochastic lookback analysis for turning point insights
- Ghost mode for comparative insights
Technical Methodology
I. Integrated Moving Averages for Price Dynamic Insights
Incorporating various MA alternatives allows traders to gain insights into not only price dynamics but also their underlying strength, which is reflected in trading activity. This strength is visually depicted by the derived price line within blackOrb's Price Area Chart.
Among the array of MA alternatives, VWMA stands out as a suitable implementation choice for integrating volume data. It goes beyond the scope of a simple moving average, considering both price and volume in its calculation, as shown in the following formula:
(C1 x V1 + C2 x V2 + ... + CN x Vn) / (V1 + V2 + ... + Vn)
II. Zigzag Pivot Identification for Price Level Insights
Zigzag Pivot Identification can be a valuable tool for recognizing possible price movements and potential turning points. It operates by pinpointing pivotal moments where prices alter their course. Essential components of this method involve comparing time units both to the left and right within a designated price dynamic phase, effectively defining the search range for pivotal points.
For instance, in the analysis below, the search is for the highest price point that hasn't been surpassed in the last 10 time units to the left and 10 time units to the right:
ta.pivothigh(10, 10)
The lookback variables analyze price points by simultaneously examining a specified number of time units before and after a potential pivot point as the central reference. A pivot is identified when a price point remains unbreached throughout this period.
Note: This method retroactively validates structures, implying that this tool may redraw or adjust its values as price data evolves. This leads to inconsistency and a lack of predictability.
III. Stochastic Lookback Analysis for Turning Point Insights
The stochastic calculation methodology of this feature centers around the following formula:
100 * (close - lowest(low, length)) / (highest(high, length) - lowest(low, length))
This key formula employs a stochastic calculation methodology that assesses the percentage deviation of the closing price from the lowest low over a specified timeframe (length), relative to the span between the highest high and the lowest low. The outcome is normalized within a range of 0 to 100, providing insights into the relative position of the closing price within the high-low range. Traders can define the specific periods over which the stochastic calculation is performed.
Based on this stochastic analysis, the indicator integrates area chart coloring, affording users the flexibility to adjust the sensitivity of area chart coloring according to customized stochastic look-back evaluation phases. Consequently, the coloration by length evaluation can mirror a comprehension of market dynamics.
Note: However, it's important to recognize that the efficacy of evaluation coloring might be compromised during periods of lateral price movement, characterized by less prominent market trends.
IV. Ghost Mode for Comparative Insights
Unveiling convergences and divergences, the Ghost Mode overlays two price charts, which can reveal price trajectories and reactions (e.g. Apple stock's potential response to the NASDAQ 100 Technology Sector Index).
Note: This approach may not capture nuanced correlations during intricate market scenarios.
Note on Usability
This tool is an intricately designed area chart, meticulously created to serve as a fundamental canvas for the seamless integration of other more granular trading indicators.
blackOrb Price can have synergies with blackOrb Candle as both indicators combined can give a bigger picture for supporting comprehensive and multifaceted data-driven trading analysis.
This indicator isn't intended for standalone trading application. Instead, it offers an alternative approach to traditional area charts, serving as a supplementary tool for orientation within broader trading strategies. Irrespective of market conditions, it can harmonize with a wider range of trading styles and instruments/trading pairs/indices like Stocks, Gold, EURUSDSPX500, GBPUSD, BTCUSD and Oil.
Inspiration and Publishing
Taking genesis from the inspirations amongst others provided by TradingView Pine Script Wizard Kodify, blackOrb Price is a multi-encompassing script meticulously forged from scratch. It aspires to furnish a comprehensive area chart approach, borne out of personal experiences and a strong dedication in supporting the trading community. We eagerly await valuable feedback to refine and further enhance this tool.
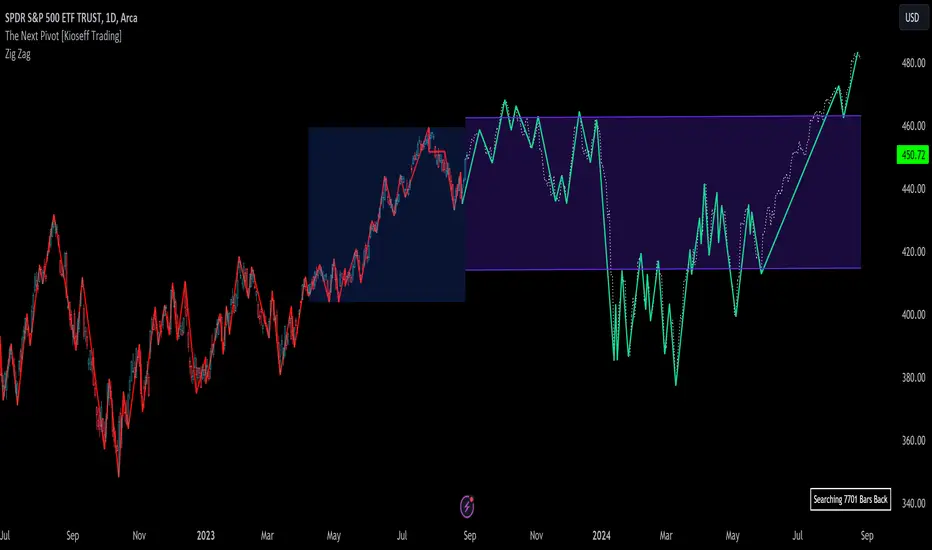
The Next Pivot [Kioseff Trading]Hello!
This script "The Next Pivot" uses various similarity measures to compare historical price sequences to the current price sequence!
Features
Find the most similar price sequence up to 100 bars from the current bar
Forecast price path up to 250 bars
Forecast ZigZag up to 250 bars
Spearmen
Pearson
Absolute Difference
Cosine Similarity
Mean Squared Error
Kendall
Forecasted linear regression channel
The image above shows/explains some of the indicator's capabilities!
The image above highlights the projected zig zag (pivots) pattern!
Colors are customizable (:
Additionally, you can plot a forecasted LinReg channel.
Should load times permit it, the script can search all bar history for a correlating sequence. This won't always be possible, contingent on the forecast length, correlation length, and the number of bars on the chart.
Reasonable Assessment
The script uses various similarity measures to find the "most similar" price sequence to what's currently happening. Once found, the subsequent price move (to the most similar sequence) is recorded and projected forward.
So,
1: Script finds most similar price sequence
2: Script takes what happened after and projects forward
While this may be useful, the projection is simply the reaction to a possible one-off "similarity" to what's currently happening. Random fluctuations are likely and, if occurring, similarities between the current price sequence and the "most similar" sequence are plausibly coincidental.
That said, if you have any ideas on cool features to add please let me know!
Thank you (:
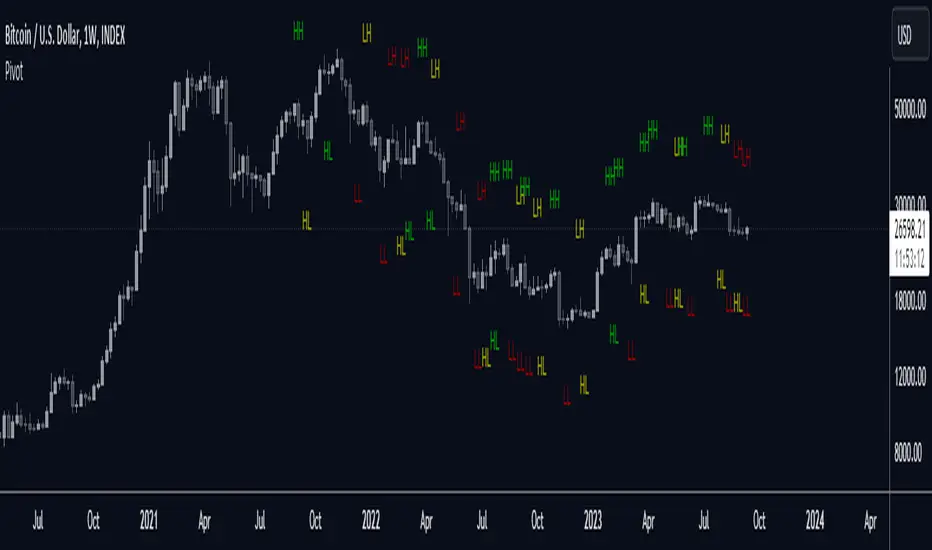
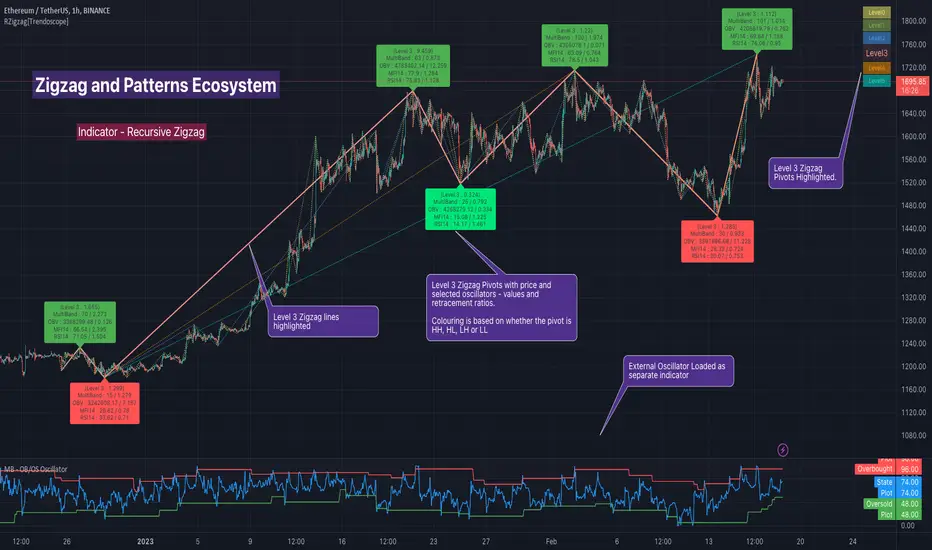
Zigzag Trend-based Color [SteinG]Zigzag Indicator with Trend-based Color Coding and Info Table
This indicator is forked from Trendoscope's Recursive Zigzag
The Zigzag Indicator with Trend-based Color Coding and Info Table is a powerful tool for technical analysis, designed to help you identify significant price swings, visualize trends, and analyze pivot points with ease. This advanced indicator offers enhanced functionalities and improved visual representation.
The primary purpose of the Zigzag Indicator is to identify and highlight important price reversals, commonly referred to as pivot points, in a given chart. These pivot points are essential in recognizing trend changes and potential market turning points. With the Zigzag Indicator, you can quickly identify these pivotal moments and gain valuable insights into market dynamics.
One of the standout features of this indicator is the color coding applied to the Zigzag line, which intuitively reflects the trend associated with each pivot point. The color scheme is as follows:
- Green : Indicates an upward trend, representing a bullish movement in the price.
- Lime : Represents a retracement during an upward trend, indicating a temporary pullback before the uptrend resumes.
- Red : Signifies a downward trend, indicating a bearish movement in the price.
- Orange : Represents a retracement during a downward trend, indicating a temporary bounce before the downtrend resumes.
This color coding allows you to easily visualize the prevailing market sentiment and make more informed trading decisions accordingly.
In addition to the visual representation, the Zigzag Indicator also includes an informative table that provides essential details about each pivot point. The table presents the following information for each pivot point:
1. Pivot Value : The price level at which the pivot point occurs.
2. Direction : Indicates whether the pivot point represents an upward or downward trend.
3. Fibo Ratios : Displays the Fibonacci retracement levels between two consecutive pivot points, offering insights into potential support and resistance levels.
The inclusion of this comprehensive info table enables you to analyze pivot points more effectively, understand the underlying price dynamics, and identify key trading opportunities.
PivotLibrary "Pivot"
This library helps you store and manage pivots.
bias(isHigh, isHigher, prevWasHigher)
Helper function to calculate bias.
Parameters:
isHigh (bool) : (bool) Wether the pivot is a pivot high or not.
isHigher (bool) : (bool) Wether the pivot is a higher pivot or not.
@return (bool) The bias (true = bullish, false = bearish, na = neutral).
prevWasHigher (bool)
biasToString(bias)
Parameters:
bias (bool)
biasToColor(bias, theme)
Parameters:
bias (bool)
theme (Theme)
nameString(isHigh, isHigher)
Parameters:
isHigh (bool)
isHigher (bool)
abbrString(isHigh, isHigher)
Parameters:
isHigh (bool)
isHigher (bool)
tooltipString(y, isHigh, isHigher, bias, theme)
Parameters:
y (float)
isHigh (bool)
isHigher (bool)
bias (bool)
theme (Theme)
createLabel(x, y, isHigh, isHigher, prevWasHigher, settings)
Parameters:
x (int)
y (float)
isHigh (bool)
isHigher (bool)
prevWasHigher (bool)
settings (Settings)
new(x, y, isHigh, isHigher, settings)
Parameters:
x (int)
y (float)
isHigh (bool)
isHigher (bool)
settings (Settings)
newArray(size, initialValue)
Parameters:
size (int)
initialValue (Pivot)
method getFirst(this)
Namespace types: Pivot
Parameters:
this (Pivot )
method getLast(this, isHigh)
Namespace types: Pivot
Parameters:
this (Pivot )
isHigh (bool)
method getLastHigh(this)
Namespace types: Pivot
Parameters:
this (Pivot )
method getLastLow(this)
Namespace types: Pivot
Parameters:
this (Pivot )
method getPrev(this, numBack, isHigh)
Namespace types: Pivot
Parameters:
this (Pivot )
numBack (int)
isHigh (bool)
method getPrevHigh(this, numBack)
Namespace types: Pivot
Parameters:
this (Pivot )
numBack (int)
method getPrevLow(this, numBack)
Namespace types: Pivot
Parameters:
this (Pivot )
numBack (int)
method getText(this)
Namespace types: Pivot
Parameters:
this (Pivot)
method setX(this, value)
Namespace types: Pivot
Parameters:
this (Pivot)
value (int)
method setY(this, value)
Namespace types: Pivot
Parameters:
this (Pivot)
value (float)
method setXY(this, x, y)
Namespace types: Pivot
Parameters:
this (Pivot)
x (int)
y (float)
method setBias(this, value)
Namespace types: Pivot
Parameters:
this (Pivot)
value (int)
method setColor(this, value)
Namespace types: Pivot
Parameters:
this (Pivot)
value (color)
method setText(this, value)
Namespace types: Pivot
Parameters:
this (Pivot)
value (string)
method add(this, pivot)
Namespace types: Pivot
Parameters:
this (Pivot )
pivot (Pivot)
method updateLast(this, y, settings)
Namespace types: Pivot
Parameters:
this (Pivot )
y (float)
settings (Settings)
method update(this, y, isHigh, settings)
Namespace types: Pivot
Parameters:
this (Pivot )
y (float)
isHigh (bool)
settings (Settings)
Pivot
Stores Pivot data.
Fields:
x (series int)
y (series float)
isHigh (series bool)
isHigher (series bool)
bias (series bool)
lb (series label)
Theme
Attributes for customizable look and feel.
Fields:
size (series string)
colorDefault (series color)
colorNeutral (series color)
colorBullish (series color)
colorBearish (series color)
colored (series bool)
showTooltips (series bool)
showTooltipName (series bool)
showTooltipValue (series bool)
showTooltipBias (series bool)
Settings
All settings for the pivot.
Fields:
theme (Theme)
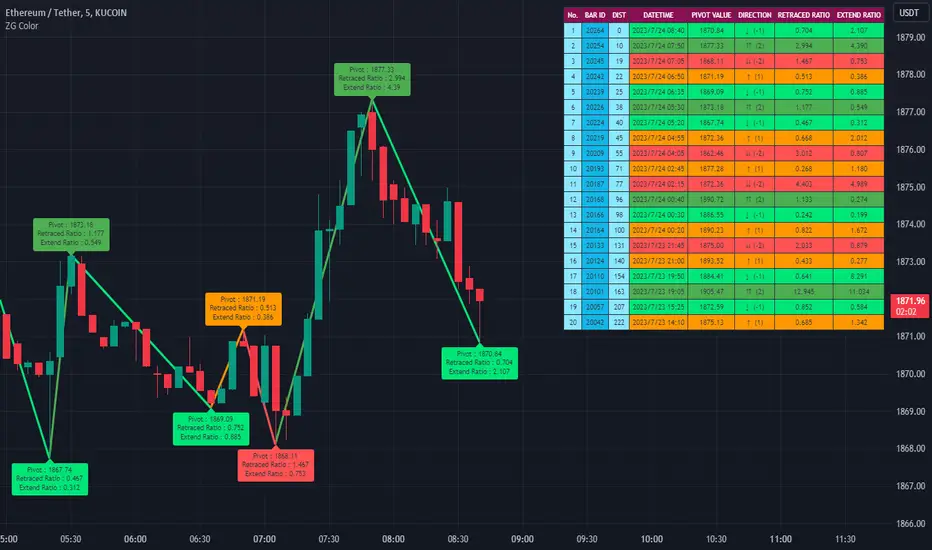
*Zig Zag Price, % Change w/RSI*With immense help from ©SimpleCryptoLife who reimagined this script for me, and to ©mmoiwgg and ©ocaptain who's ideas led to this updated version 5.
This indicator is fairly straight-forward and visually appealing because you get a running zig zag price, price % change with an added bonus - RSI. However you won't find zig zag lines but the script reacts the same by changing the inputs. The higher the value the less data points you'll see on the screen.
The main objective of this indicator is to be able to spot high and low prices easily with the price % change between the same 2 data sets. Additionally and arguably more importantly, with the RSI values associated with the high and low prices, you can spot divergences easily - meaning the price is making a higher high while conversely the RSI value at the next pop (around the same price as previous high) is lower which can mean that momentum has exhausted for the time being and a reversal could be imminent.
This script is meant only as a tool to try to enrich your trading journey and I hope it helps you become a more consistent and profitable trader. If you find it invaluable drop a like and comment. Good luck!

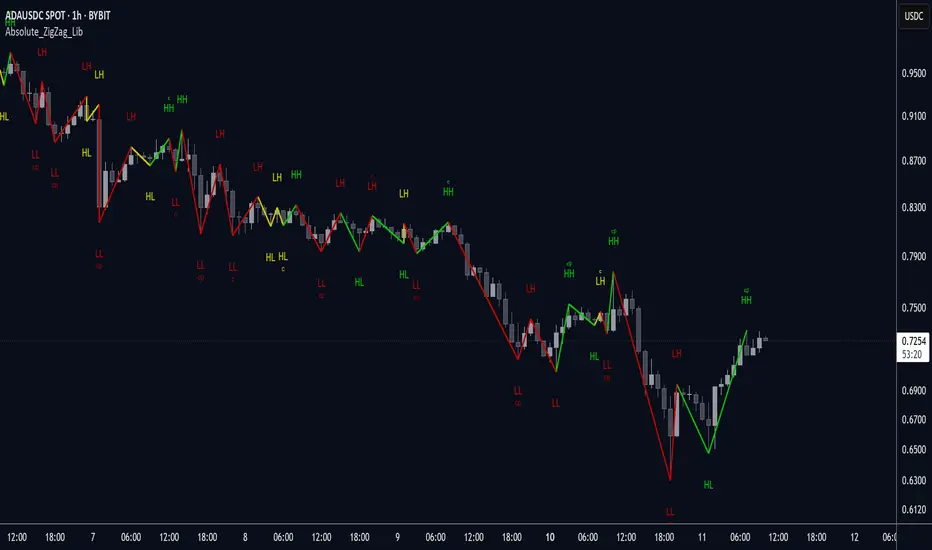
Absolute ZigZag LibLibrary "Absolute_ZigZag_Lib"
This ZigZag Library is a Bit different. Instead of using percentages or looking more than 1 bar left or right, this Zigzag library calculates pivots by just looking at the current bar highs and lows and the ones of one bar earlier.
This is the most accurate way of calculating pivots and it also eliminates lag.
The library also features a solution for bars that have both a higher high and a higher low like seen below.
You can also use your own colors for the labels and the lines.
You can also quickly select a one-colored theme without changing all colors at once
method isHigherHigh(this)
Checks if current pivot is a higher high
Namespace types: Pivot
Parameters:
this (Pivot) : (Pivot) The object to work with.
@return (bool) True if the pivot is a higher high, false if not.
method isLowerHigh(this)
Checks if current pivot is a lower high
Namespace types: Pivot
Parameters:
this (Pivot) : (Pivot) The object to work with.
@return (bool) True if the pivot is a lower high, false if not.
method isHigherLow(this)
Checks if current pivot is a higher low
Namespace types: Pivot
Parameters:
this (Pivot) : (Pivot) The object to work with.
@return (bool) True if the pivot is a higher low, false if not.
method isLowerLow(this)
Checks if current pivot is a lower low
Namespace types: Pivot
Parameters:
this (Pivot) : (Pivot) The object to work with.
@return (bool) True if the pivot is a lower low, false if not.
method getLastPivotHigh(this)
Gets the last Pivot High
Namespace types: Pivot
Parameters:
this (Pivot ) : (array) The object to work with.
@return (Pivot) The latest Pivot High
method getLastPivotLow(this)
Gets the last Pivot Low
Namespace types: Pivot
Parameters:
this (Pivot ) : (array) The object to work with.
@return (Pivot) The latest Pivot Low
method prev(this, index)
Namespace types: Pivot
Parameters:
this (Pivot )
index (int)
method last(this, throwError)
Namespace types: Pivot
Parameters:
this (Pivot )
throwError (bool)
new(highFirst, theme)
Parameters:
highFirst (bool)
theme (Theme)
getLowerTimeframePeriod()
Theme
Used to create a (color) theme to draw Zigzag
Fields:
colorDefault (series color)
colorNeutral (series color)
colorBullish (series color)
colorBearish (series color)
coloredLines (series bool)
Point
Used to determine a coordination on the chart
Fields:
x (series int)
y (series float)
Pivot
Used to determine pivots on the chart
Fields:
point (Point)
isHigh (series bool)
isHigher (series bool)
ln (series line)
lb (series label)
SuperBollingerTrend (Expo)█ Overview
The SuperBollingerTrend indicator is a combination of two popular technical analysis tools, Bollinger Bands, and SuperTrend. By fusing these two indicators, SuperBollingerTrend aims to provide traders with a more comprehensive view of the market, accounting for both volatility and trend direction. By combining trend identification with volatility analysis, the SuperBollingerTrend indicator provides traders with valuable insights into potential trend changes. It recognizes that high volatility levels often accompany stronger price momentum, which can result in the formation of new trends or the continuation of existing ones.
█ How Volatility Impacts Trends
Volatility can impact trends by expanding or contracting them, triggering trend reversals, leading to breakouts, and influencing risk management decisions. Traders need to analyze and monitor volatility levels in conjunction with trend analysis to gain a comprehensive understanding of market dynamics.
█ How to use
Trend Reversals: High volatility can result in more dramatic price fluctuations, which may lead to sharp trend reversals. For example, a sudden increase in volatility can cause a bullish trend to transition into a bearish one, or vice versa, as traders react to significant price swings.
Volatility Breakouts: Volatility can trigger breakouts in trends. Breakouts occur when the price breaks through a significant support or resistance level, indicating a potential shift in the trend. Higher volatility levels can increase the likelihood of breakouts, as they indicate stronger market momentum and increased buying or selling pressure. This indicator triggers when the volatility increases, and if the price is near a key level when the indicator alerts, it might trigger a great trend.
█ Features
Peak Signal Move
The indicator calculates the peak price move for each ZigZag and displays it under each signal. This highlights how much the market moved between the signals.
Average ZigZag Move
All price moves between two signals are stored, and the average or the median is calculated and displayed in a table. This gives traders a great idea of how much the market moves on average between two signals.
Take Profit
The Take Profit line is placed at the average or the median price move and gives traders a great idea of what they can expect in average profit from the latest signals.
-----------------
Disclaimer
The information contained in my Scripts/Indicators/Ideas/Algos/Systems does not constitute financial advice or a solicitation to buy or sell any securities of any type. I will not accept liability for any loss or damage, including without limitation any loss of profit, which may arise directly or indirectly from the use of or reliance on such information.
All investments involve risk, and the past performance of a security, industry, sector, market, financial product, trading strategy, backtest, or individual's trading does not guarantee future results or returns. Investors are fully responsible for any investment decisions they make. Such decisions should be based solely on an evaluation of their financial circumstances, investment objectives, risk tolerance, and liquidity needs.
My Scripts/Indicators/Ideas/Algos/Systems are only for educational purposes!

Steel Step Assistant: Trend Visualizer + Market Flow 1.0This is a market flow signal indicator. Flow with the market and you will find yourself in good hands.
This indicator simply gives you a signal of the RIGHT time to follow a market trend/direction. The indicator is designed with Steel Step strategy rules for determining directions.
It calculates and provides the most market direction signals within a particular period of time.
It also gives a relatively accurate signal of trend reversals. Being an indicator, it is prone to a certain extent of inaccuracy. It is programmed to provide an accurate market direction/flow to the best of its abilities.
Always remember that the Steel Step strategy does not rely on indicators to trade.
The trend visualizer is an ordinary table that shows you trends in different time frames.
This indicator can be used on all charts and markets; crypto, commodities, forex, stock, indices, etc.
It is suitable for intra-day traders.
One way of using this is to enhance your information gathering on trends in order to understand the market structure or direction better.
This indicator helps educate users on the market structure. Users can quickly break down the market into layers, analyze the layers and connect them all to understand the market as a whole. After users understand the market, users need to decide and choose a specific trend they want to trade. The basic idea is to flow with the market.
This indicator can be combined with EW theory to understand the market structure easily.
When I understand the whole market structure, it boosts my trading performance to the maximum.
According to the Steel Step strategy, this indicator is designed to show the trend "one layer" above "the current TF layer". This method has been tested to enhance accuracy. This may sound confusing to some of you. You can find educational materials about the layer logic from my Steel Step strategy.
Find the instructions on how to view signals below.
***SIGNAL GUIDE***
To view signals/set signal alerts:
- To view 15min signals, use 3min chart
- To view 1H signals, use 15min chart
A second version to include more time frame layers and trends will be published soon. Look forward to it!
Please comment below or message me if you have any questions. Enjoy!
*Nobody should use this indicator as a confirmation signal for entry/exit for your trades. Please message me on how to use this indicator correctly. This indicator was designed to be used in conjunction with my Steel Step strategy, hence the name.

[JL] Supertrend Zone Pivot Point with zigzag fibThis is an open-source Pine script that generates a Supertrend Zone Pivot Point with Zigzag Fib indicator for TradingView. The indicator displays the Supertrend Zone, pivot points, and Fibonacci levels on the chart.
One of the unique features of this indicator is that it uses a Zigzag that does not repaint, ensuring accurate high and low points for the pivot points.
Another feature is that when the Supertrend is in an uptrend, only the highest points are taken as pivot points, and when it's in a downtrend, only the lowest points are taken as pivot points.
The Fibonacci levels are calculated based on the previous high and low pivot points, with labels displaying the corresponding levels on the chart.
The indicator also includes options to show/hide the Zigzag and Fibonacci levels.
Overall, this indicator is useful for identifying key pivot points and Fibonacci levels in the Supertrend Zone, providing valuable information for traders to make informed decisions.

GKD-C Swing Line [Loxx]Giga Kaleidoscope GKD-V Swing Line is a Confirmation module included in Loxx's "Giga Kaleidoscope Modularized Trading System".
█ Giga Kaleidoscope Modularized Trading System
What is Loxx's "Giga Kaleidoscope Modularized Trading System"?
The Giga Kaleidoscope Modularized Trading System is a trading system built on the philosophy of the NNFX (No Nonsense Forex) algorithmic trading.
What is the NNFX algorithmic trading strategy?
The NNFX (No-Nonsense Forex) trading system is a comprehensive approach to Forex trading that is designed to simplify the process and remove the confusion and complexity that often surrounds trading. The system was developed by a Forex trader who goes by the pseudonym "VP" and has gained a significant following in the Forex community.
The NNFX trading system is based on a set of rules and guidelines that help traders make objective and informed decisions. These rules cover all aspects of trading, including market analysis, trade entry, stop loss placement, and trade management.
Here are the main components of the NNFX trading system:
1. Trading Philosophy: The NNFX trading system is based on the idea that successful trading requires a comprehensive understanding of the market, objective analysis, and strict risk management. The system aims to remove subjective elements from trading and focuses on objective rules and guidelines.
2. Technical Analysis: The NNFX trading system relies heavily on technical analysis and uses a range of indicators to identify high-probability trading opportunities. The system uses a combination of trend-following and mean-reverting strategies to identify trades.
3. Market Structure: The NNFX trading system emphasizes the importance of understanding the market structure, including price action, support and resistance levels, and market cycles. The system uses a range of tools to identify the market structure, including trend lines, channels, and moving averages.
4. Trade Entry: The NNFX trading system has strict rules for trade entry. The system uses a combination of technical indicators to identify high-probability trades, and traders must meet specific criteria to enter a trade.
5. Stop Loss Placement: The NNFX trading system places a significant emphasis on risk management and requires traders to place a stop loss order on every trade. The system uses a combination of technical analysis and market structure to determine the appropriate stop loss level.
6. Trade Management: The NNFX trading system has specific rules for managing open trades. The system aims to minimize risk and maximize profit by using a combination of trailing stops, take profit levels, and position sizing.
Overall, the NNFX trading system is designed to be a straightforward and easy-to-follow approach to Forex trading that can be applied by traders of all skill levels.
Core components of an NNFX algorithmic trading strategy
The NNFX algorithm is built on the principles of trend, momentum, and volatility. There are six core components in the NNFX trading algorithm:
1. Volatility - price volatility; e.g., Average True Range, True Range Double, Close-to-Close, etc.
2. Baseline - a moving average to identify price trend
3. Confirmation 1 - a technical indicator used to identify trends
4. Confirmation 2 - a technical indicator used to identify trends
5. Continuation - a technical indicator used to identify trends
6. Volatility/Volume - a technical indicator used to identify volatility/volume breakouts/breakdown
7. Exit - a technical indicator used to determine when a trend is exhausted
How does Loxx's GKD (Giga Kaleidoscope Modularized Trading System) implement the NNFX algorithm outlined above?
Loxx's GKD v1.0 system has five types of modules (indicators/strategies). These modules are:
1. GKD-BT - Backtesting module (Volatility, Number 1 in the NNFX algorithm)
2. GKD-B - Baseline module (Baseline and Volatility/Volume, Numbers 1 and 2 in the NNFX algorithm)
3. GKD-C - Confirmation 1/2 and Continuation module (Confirmation 1/2 and Continuation, Numbers 3, 4, and 5 in the NNFX algorithm)
4. GKD-V - Volatility/Volume module (Confirmation 1/2, Number 6 in the NNFX algorithm)
5. GKD-E - Exit module (Exit, Number 7 in the NNFX algorithm)
(additional module types will added in future releases)
Each module interacts with every module by passing data between modules. Data is passed between each module as described below:
GKD-B => GKD-V => GKD-C(1) => GKD-C(2) => GKD-C(Continuation) => GKD-E => GKD-BT
That is, the Baseline indicator passes its data to Volatility/Volume. The Volatility/Volume indicator passes its values to the Confirmation 1 indicator. The Confirmation 1 indicator passes its values to the Confirmation 2 indicator. The Confirmation 2 indicator passes its values to the Continuation indicator. The Continuation indicator passes its values to the Exit indicator, and finally, the Exit indicator passes its values to the Backtest strategy.
This chaining of indicators requires that each module conform to Loxx's GKD protocol, therefore allowing for the testing of every possible combination of technical indicators that make up the six components of the NNFX algorithm.
What does the application of the GKD trading system look like?
Example trading system:
Backtest: Strategy with 1-3 take profits, trailing stop loss, multiple types of PnL volatility, and 2 backtesting styles
Baseline: Hull Moving Average
Volatility/Volume: Volatility Ratio
Confirmation 1: GKD-V Swing Line as shown on the chart above
Confirmation 2: Williams Percent Range
Continuation: Fisher Transform
Exit: Rex Oscillator
Each GKD indicator is denoted with a module identifier of either: GKD-BT, GKD-B, GKD-C, GKD-V, or GKD-E. This allows traders to understand to which module each indicator belongs and where each indicator fits into the GKD protocol chain.
Giga Kaleidoscope Modularized Trading System Signals (based on the NNFX algorithm)
Standard Entry
1. GKD-C Confirmation 1 Signal
2. GKD-B Baseline agrees
3. Price is within a range of 0.2x Volatility and 1.0x Volatility of the Goldie Locks Mean
4. GKD-C Confirmation 2 agrees
5. GKD-V Volatility/Volume agrees
Baseline Entry
1. GKD-B Baseline signal
2. GKD-C Confirmation 1 agrees
3. Price is within a range of 0.2x Volatility and 1.0x Volatility of the Goldie Locks Mean
4. GKD-C Confirmation 2 agrees
5. GKD-V Volatility/Volume agrees
6. GKD-C Confirmation 1 signal was less than 7 candles prior
Continuation Entry
1. Standard Entry, Baseline Entry, or Pullback; entry triggered previously
2. GKD-B Baseline hasn't crossed since entry signal trigger
3. GKD-C Confirmation Continuation Indicator signals
4. GKD-C Confirmation 1 agrees
5. GKD-B Baseline agrees
6. GKD-C Confirmation 2 agrees
1-Candle Rule Standard Entry
1. GKD-C Confirmation 1 signal
2. GKD-B Baseline agrees
3. Price is within a range of 0.2x Volatility and 1.0x Volatility of the Goldie Locks Mean
Next Candle:
1. Price retraced (Long: close < close or Short: close > close )
2. GKD-B Baseline agrees
3. GKD-C Confirmation 1 agrees
4. GKD-C Confirmation 2 agrees
5. GKD-V Volatility/Volume agrees
1-Candle Rule Baseline Entry
1. GKD-B Baseline signal
2. GKD-C Confirmation 1 agrees
3. Price is within a range of 0.2x Volatility and 1.0x Volatility of the Goldie Locks Mean
4. GKD-C Confirmation 1 signal was less than 7 candles prior
Next Candle:
1. Price retraced (Long: close < close or Short: close > close )
2. GKD-B Baseline agrees
3. GKD-C Confirmation 1 agrees
4. GKD-C Confirmation 2 agrees
5. GKD-V Volatility/Volume Agrees
PullBack Entry
1. GKD-B Baseline signal
2. GKD-C Confirmation 1 agrees
3. Price is beyond 1.0x Volatility of Baseline
Next Candle:
1. Price is within a range of 0.2x Volatility and 1.0x Volatility of the Goldie Locks Mean
3. GKD-C Confirmation 1 agrees
4. GKD-C Confirmation 2 agrees
5. GKD-V Volatility/Volume Agrees
█ GKD-V Swing Line
The swing line indicator is a technical analysis tool used in financial markets to identify the direction of a trend. It is also known as the trendline or zigzag indicator.
The swing line indicator plots a series of lines connecting the highs and lows of price movements over a given time period. Each line represents a swing high or swing low in the price action, depending on whether the trend is bullish or bearish.
In an uptrend, the swing line indicator connects each successive higher low, forming an ascending trendline. In a downtrend, the indicator connects each successive lower high, forming a descending trendline. When the trend changes direction, the indicator will create a new line to reflect the new swing high or low.
Traders use the swing line indicator to identify key levels of support and resistance, as well as potential entry and exit points for trades. A break of the trendline can signal a potential trend reversal, while a bounce off the trendline can indicate that the trend is still intact.
The swing line indicator can be used in conjunction with other technical analysis tools, such as moving averages, to confirm trends and reduce false signals. It is commonly used in forex, stock, and commodity markets, and is available on most charting platforms.
Requirements
Inputs
Confirmation 1 and Solo Confirmation: GKD-V Volatility / Volume indicator
Confirmation 2: GKD-C Confirmation indicator
Outputs
Confirmation 2 and Solo Confirmation Complex: GKD-E Exit indicator
Confirmation 1: GKD-C Confirmation indicator
Continuation: GKD-E Exit indicator
Solo Confirmation Simple: GKD-BT Backtest strategy
Additional features will be added in future releases.

Elliott Wave [LuxAlgo]The Elliott Wave indicator allows users to detect Elliott Wave (EW) impulses as well as corrective segments automatically on the chart. These are detected and displayed serially, allowing users to keep track of the evolution of an impulse or corrective wave.
Fibonacci retracements constructed from detected impulse waves are also included.
This script additionally allows users to get alerted on a wide variety of trigger conditions (see the ALERTS section below).
🔶 SETTINGS
🔹 Source
• "high" -> options high, close, maximum of open/close
• "low" -> options low, close, minimum of open/close
🔹 ZigZag
• The source and length are used to check whether a new Pivot Point is found.
Example:
• source = high/low, length = 10:
• There is a new pivot high when:
- previous high is higher than current high
- the highs of 10 bars prior to previous high are all lower
• These pivot points are used to form the ZigZag lines, which in their turn are used for pattern recognition
🔶 USAGE
The basic principles we use to identify Elliott Wave impulses are:
• A movement in the direction of the trend ( Motive/Impulse wave ) is divided in 5 waves (Wave 1 -> 5)
• The Corrective Wave (against the trend) is divided in 3 waves (Wave A -> C)
• The waves can be subdivided in smaller waves
• Wave 2 can’t retrace more than the beginning of Wave 1
• Wave 4 does not overlap with the price territory of Wave 1
Here we see an example:
Let's look at the development:
• 1 bar after point (5) a confirmed 5 Motive Wave pattern is found (1 -> 5; The 5 Waves can also be seen as one large Wave 1 ).
• Next, the script draws a set of Fibonacci lines, which are area's where the Corrective Wave potentially will bounce.
Here we see the fifth wave is getting larger, the previous highest point is updated, and the Wave 5 is larger than Wave 3 :
(At this point, the pattern is invalidated, and it display as dotted)
Further progression in time:
At this point, a confirmed " 3 Corrective Wave pattern " is found (a -> c)
When a new high has developed, a circle is drawn (in the same color of the lines)
However, when the bottom of the drawn box has breached, a red cross will be visualized.
Further progression:
Later on, a bearish confirmed " 5 Motive Wave pattern " is found (1 -> 5):
When a Corrective Wave becomes invalidated, the ABC pattern will display as dashed (not dotted):
🔶 TECHNIQUES
Pine Script™ introduces methods!
• More information can be found here:
• Pine Script™ v5 User Manual 👉 Methods
• Pine Script™ language reference manual 👉 method
🔶 ALERTS
Dynamic alerts are included in the script, you only need to set 1 alert to receive following messages:
• When a new EW Motive Pattern is found (Bullish/Bearish )
• When a new EW Corrective Pattern is found (Bullish/Bearish )
• When an EW Motive Pattern is invalidated (Bullish/Bearish )
• When an EW Corrective Pattern is invalidated (Bullish/Bearish )
• When possible, a start of a new EW Motive Wave is found (Bullish/Bearish )
• Here is information how you can set these alerts()

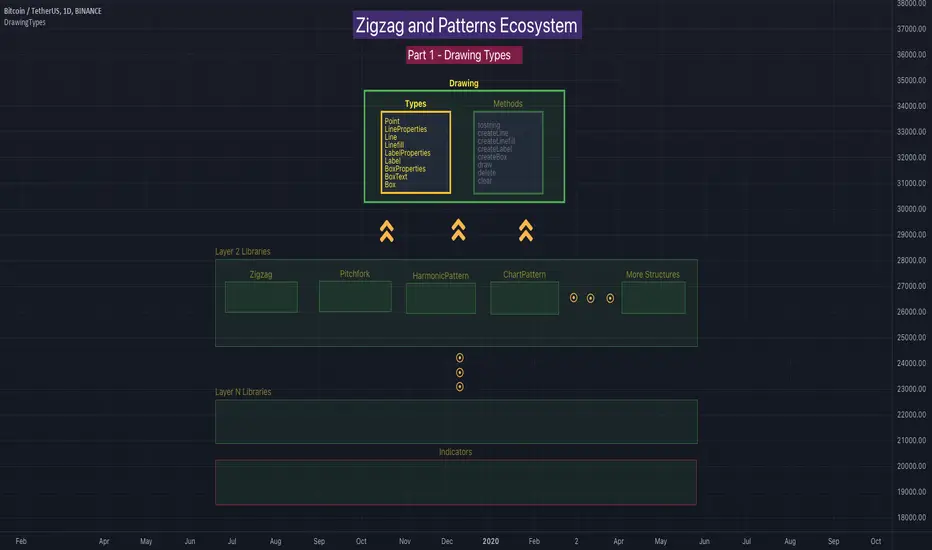
Recursive Zigzag [Trendoscope]Here is an another outcome of Object Oriented Zigzag and Pattern Ecosystem of Libraries.
We already have another implementation of recursive zigzag which makes use of earlier library rzigzag . Here in this example, we make use of similar logic but leverage the new type and method based Zigzag system libraries to derive the indicator.
🎲 Design Overview
Similar to Recursive Auto Pitchfork, here too the indicator code is around 50 lines. Whereas most of the heavy lifting is done by the libraries.
🎲 Base Libraries
Base libraries are those which does not have any dependency. They form basic structures which are later used in other libraries. These libraries need to be crafted carefully so that minimal updates are done later on. Any updates on these libraries will impact all the dependent libraries and scripts.
🎯 Drawing
DrawingTypes - Defines basic drawing types Point, Line, Label, Box, Linefill and related property types.
DrawingMethods - All the methods or functionality surrounding Basic types are defined here.
🎲 Layer 1 Libraries
These are the libraries which has direct dependency on base libraries.
🎯 Zigzag
ZigzagTypes - Types required for defining Zigzag and Divergence
ZigzagMethods - Methods associated with Zigzag Type definitions.
🎲Indicator
Indicator draws zigzags based on given length. And then recursively derives next level zigzags based on previous levels. As per the utility, indicator is useful in several ways
Visualising price structure based on zigzag pivots - which in turn can help visualise patterns.
Ability to add any oscillator makes it easy to spot divergences with choice of indicators.
Programmers can use the derived values to build complex algorithms such as automatic pattern recognition.
🎯 Settings
Settings are explained via tooltips. These are very much straight forward and directly related to zigzag, oscillators and divergence.
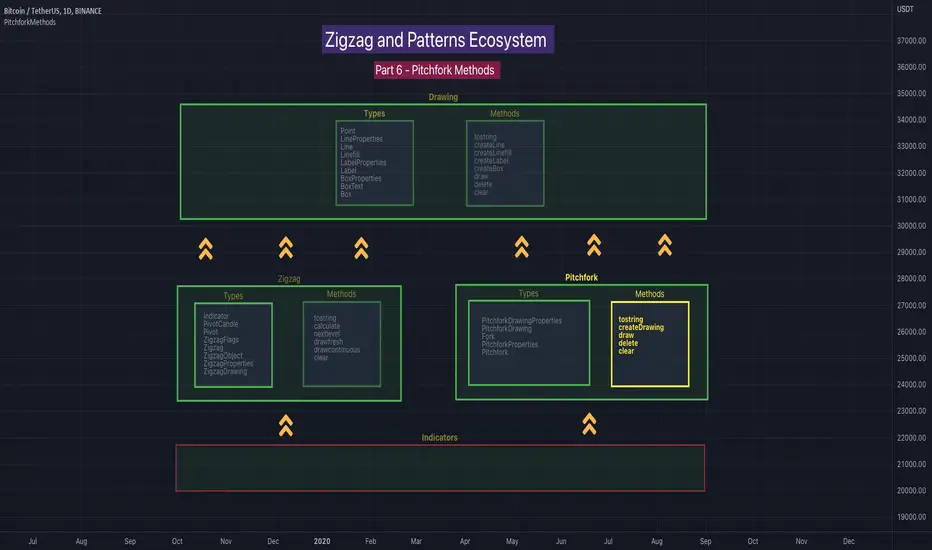
PitchforkMethodsLibrary "PitchforkMethods"
Methods associated with Pitchfork and Pitchfork Drawing. Depends on the library PitchforkTypes for Pitchfork/PitchforkDrawing objects which in turn use DrawingTypes for basic objects Point/Line/LineProperties. Also depends on DrawingMethods for related methods
tostring(this)
Converts PitchforkTypes/Fork object to string representation
Parameters:
this : PitchforkTypes/Fork object
Returns: string representation of PitchforkTypes/Fork
tostring(this)
Converts Array of PitchforkTypes/Fork object to string representation
Parameters:
this : Array of PitchforkTypes/Fork object
Returns: string representation of PitchforkTypes/Fork array
tostring(this, sortKeys, sortOrder)
Converts PitchforkTypes/PitchforkProperties object to string representation
Parameters:
this : PitchforkTypes/PitchforkProperties object
sortKeys : If set to true, string output is sorted by keys.
sortOrder : Applicable only if sortKeys is set to true. Positive number will sort them in ascending order whreas negative numer will sort them in descending order. Passing 0 will not sort the keys
Returns: string representation of PitchforkTypes/PitchforkProperties
tostring(this, sortKeys, sortOrder)
Converts PitchforkTypes/PitchforkDrawingProperties object to string representation
Parameters:
this : PitchforkTypes/PitchforkDrawingProperties object
sortKeys : If set to true, string output is sorted by keys.
sortOrder : Applicable only if sortKeys is set to true. Positive number will sort them in ascending order whreas negative numer will sort them in descending order. Passing 0 will not sort the keys
Returns: string representation of PitchforkTypes/PitchforkDrawingProperties
tostring(this, sortKeys, sortOrder)
Converts PitchforkTypes/Pitchfork object to string representation
Parameters:
this : PitchforkTypes/Pitchfork object
sortKeys : If set to true, string output is sorted by keys.
sortOrder : Applicable only if sortKeys is set to true. Positive number will sort them in ascending order whreas negative numer will sort them in descending order. Passing 0 will not sort the keys
Returns: string representation of PitchforkTypes/Pitchfork
createDrawing(this)
Creates PitchforkTypes/PitchforkDrawing from PitchforkTypes/Pitchfork object
Parameters:
this : PitchforkTypes/Pitchfork object
Returns: PitchforkTypes/PitchforkDrawing object created
createDrawing(this)
Creates PitchforkTypes/PitchforkDrawing array from PitchforkTypes/Pitchfork array of objects
Parameters:
this : array of PitchforkTypes/Pitchfork object
Returns: array of PitchforkTypes/PitchforkDrawing object created
draw(this)
draws from PitchforkTypes/PitchforkDrawing object
Parameters:
this : PitchforkTypes/PitchforkDrawing object
Returns: PitchforkTypes/PitchforkDrawing object drawn
delete(this)
deletes PitchforkTypes/PitchforkDrawing object
Parameters:
this : PitchforkTypes/PitchforkDrawing object
Returns: PitchforkTypes/PitchforkDrawing object deleted
delete(this)
deletes underlying drawing of PitchforkTypes/Pitchfork object
Parameters:
this : PitchforkTypes/Pitchfork object
Returns: PitchforkTypes/Pitchfork object deleted
delete(this)
deletes array of PitchforkTypes/PitchforkDrawing objects
Parameters:
this : Array of PitchforkTypes/PitchforkDrawing object
Returns: Array of PitchforkTypes/PitchforkDrawing object deleted
delete(this)
deletes underlying drawing in array of PitchforkTypes/Pitchfork objects
Parameters:
this : Array of PitchforkTypes/Pitchfork object
Returns: Array of PitchforkTypes/Pitchfork object deleted
clear(this)
deletes array of PitchforkTypes/PitchforkDrawing objects and clears the array
Parameters:
this : Array of PitchforkTypes/PitchforkDrawing object
Returns: void
clear(this)
deletes array of PitchforkTypes/Pitchfork objects and clears the array
Parameters:
this : Array of Pitchfork/Pitchfork object
Returns: void
PitchforkTypesLibrary "PitchforkTypes"
User Defined Types to be used for Pitchfork and Drawing elements of Pitchfork. Depends on DrawingTypes for Point, Line, and LineProperties objects
PitchforkDrawingProperties
Pitchfork Drawing Properties object
Fields:
extend : If set to true, forks are extended towards right. Default is true
fill : Fill forklines with transparent color. Default is true
fillTransparency : Transparency at which fills are made. Only considered when fill is set. Default is 80
forceCommonColor : Force use of common color for forks and fills. Default is false
commonColor : common fill color. Used only if ratio specific fill colors are not available or if forceCommonColor is set to true.
PitchforkDrawing
Pitchfork drawing components
Fields:
medianLine : Median line of the pitchfork
baseLine : Base line of the pitchfork
forkLines : fork lines of the pitchfork
linefills : Linefills between forks
Fork
Fork object property
Fields:
ratio : Fork ratio
forkColor : color of fork. Default is blue
include : flag to include the fork in drawing. Default is true
PitchforkProperties
Pitchfork Properties
Fields:
forks : Array of Fork objects
type : Pitchfork type. Supported values are "regular", "schiff", "mschiff", Default is regular
inside : Flag to identify if to draw inside fork. If set to true, inside fork will be drawn
Pitchfork
Pitchfork object
Fields:
a : Pivot Point A of pitchfork
b : Pivot Point B of pitchfork
c : Pivot Point C of pitchfork
properties : PitchforkProperties object which determines type and composition of pitchfork
dProperties : Drawing properties for pitchfork
lProperties : Common line properties for Pitchfork lines
drawing : PitchforkDrawing object

ZigzagMethodsLibrary "ZigzagMethods"
Object oriented implementation of Zigzag methods. Please refer to ZigzagTypes library for User defined types used in this library
tostring(this, sortKeys, sortOrder, includeKeys)
Converts ZigzagTypes/Pivot object to string representation
Parameters:
this : ZigzagTypes/Pivot
sortKeys : If set to true, string output is sorted by keys.
sortOrder : Applicable only if sortKeys is set to true. Positive number will sort them in ascending order whreas negative numer will sort them in descending order. Passing 0 will not sort the keys
includeKeys : Array of string containing selective keys. Optional parmaeter. If not provided, all the keys are considered
Returns: string representation of ZigzagTypes/Pivot
tostring(this, sortKeys, sortOrder, includeKeys)
Converts Array of Pivot objects to string representation
Parameters:
this : Pivot object array
sortKeys : If set to true, string output is sorted by keys.
sortOrder : Applicable only if sortKeys is set to true. Positive number will sort them in ascending order whreas negative numer will sort them in descending order. Passing 0 will not sort the keys
includeKeys : Array of string containing selective keys. Optional parmaeter. If not provided, all the keys are considered
Returns: string representation of Pivot object array
tostring(this)
Converts ZigzagFlags object to string representation
Parameters:
this : ZigzagFlags object
Returns: string representation of ZigzagFlags
tostring(this, sortKeys, sortOrder, includeKeys)
Converts ZigzagTypes/Zigzag object to string representation
Parameters:
this : ZigzagTypes/Zigzagobject
sortKeys : If set to true, string output is sorted by keys.
sortOrder : Applicable only if sortKeys is set to true. Positive number will sort them in ascending order whreas negative numer will sort them in descending order. Passing 0 will not sort the keys
includeKeys : Array of string containing selective keys. Optional parmaeter. If not provided, all the keys are considered
Returns: string representation of ZigzagTypes/Zigzag
calculate(this, ohlc, indicators, indicatorNames)
Calculate zigzag based on input values and indicator values
Parameters:
this : Zigzag object
ohlc : Array containing OHLC values. Can also have custom values for which zigzag to be calculated
indicators : Array of indicator values
indicatorNames : Array of indicator names for which values are present. Size of indicators array should be equal to that of indicatorNames
Returns: current Zigzag object
calculate(this)
Calculate zigzag based on properties embedded within Zigzag object
Parameters:
this : Zigzag object
Returns: current Zigzag object
nextlevel(this)
Calculate Next Level Zigzag based on the current calculated zigzag object
Parameters:
this : Zigzag object
Returns: Next Level Zigzag object
clear(this)
Clears zigzag drawings array
Parameters:
this : array
Returns: void
drawfresh(this)
draws fresh zigzag based on properties embedded in ZigzagDrawing object
Parameters:
this : ZigzagDrawing object
Returns: ZigzagDrawing object
drawcontinuous(this)
draws zigzag based on the zigzagmatrix input
Parameters:
this : ZigzagDrawing object
Returns:

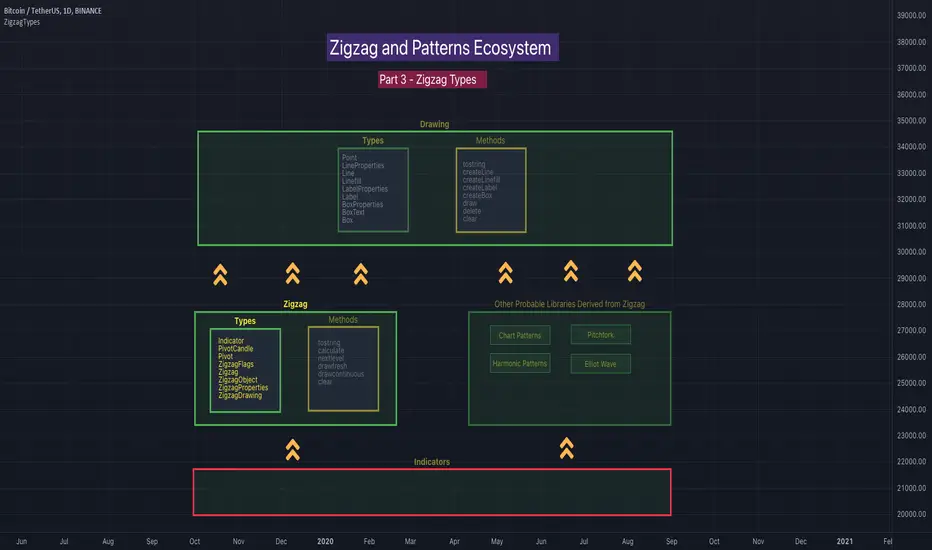
ZigzagTypesLibrary "ZigzagTypes"
Zigzag related user defined types. Depends on DrawingTypes library for basic types
Indicator
Indicator is collection of indicator values applied on high, low and close
Fields:
indicatorHigh : Indicator Value applied on High
indicatorLow : Indicator Value applied on Low
PivotCandle
PivotCandle represents data of the candle which forms either pivot High or pivot low or both
Fields:
_high : High price of candle forming the pivot
_low : Low price of candle forming the pivot
length : Pivot length
pHighBar : represents number of bar back the pivot High occurred.
pLowBar : represents number of bar back the pivot Low occurred.
pHigh : Pivot High Price
pLow : Pivot Low Price
indicators : Array of Indicators - allows to add multiple
Pivot
Pivot refers to zigzag pivot. Each pivot can contain various data
Fields:
point : pivot point coordinates
dir : direction of the pivot. Valid values are 1, -1, 2, -2
level : is used for multi level zigzags. For single level, it will always be 0
ratio : Price Ratio based on previous two pivots
indicatorNames : Names of the indicators applied on zigzag
indicatorValues : Values of the indicators applied on zigzag
indicatorRatios : Ratios of the indicators applied on zigzag based on previous 2 pivots
ZigzagFlags
Flags required for drawing zigzag. Only used internally in zigzag calculation. Should not set the values explicitly
Fields:
newPivot : true if the calculation resulted in new pivot
doublePivot : true if the calculation resulted in two pivots on same bar
updateLastPivot : true if new pivot calculated replaces the old one.
Zigzag
Zigzag object which contains whole zigzag calculation parameters and pivots
Fields:
length : Zigzag length. Default value is 5
numberOfPivots : max number of pivots to hold in the calculation. Default value is 20
offset : Bar offset to be considered for calculation of zigzag. Default is 0 - which means calculation is done based on the latest bar.
level : Zigzag calculation level - used in multi level recursive zigzags
zigzagPivots : array which holds the last n pivots calculated.
flags : ZigzagFlags object which is required for continuous drawing of zigzag lines.
ZigzagObject
Zigzag Drawing Object
Fields:
zigzagLine : Line joining two pivots
zigzagLabel : Label which can be used for drawing the values, ratios, directions etc.
ZigzagProperties
Object which holds properties of zigzag drawing. To be used along with ZigzagDrawing
Fields:
lineColor : Zigzag line color. Default is color.blue
lineWidth : Zigzag line width. Default is 1
lineStyle : Zigzag line style. Default is line.style_solid.
showLabel : If set, the drawing will show labels on each pivot. Default is false
textColor : Text color of the labels. Only applicable if showLabel is set to true.
maxObjects : Max number of zigzag lines to display. Default is 300
xloc : Time/Bar reference to be used for zigzag drawing. Default is Time - xloc.bar_time.
ZigzagDrawing
Object which holds complete zigzag drawing objects and properties.
Fields:
properties : ZigzagProperties object which is used for setting the display styles of zigzag
drawings : array which contains lines and labels of zigzag drawing.
zigzag : Zigzag object which holds the calculations.
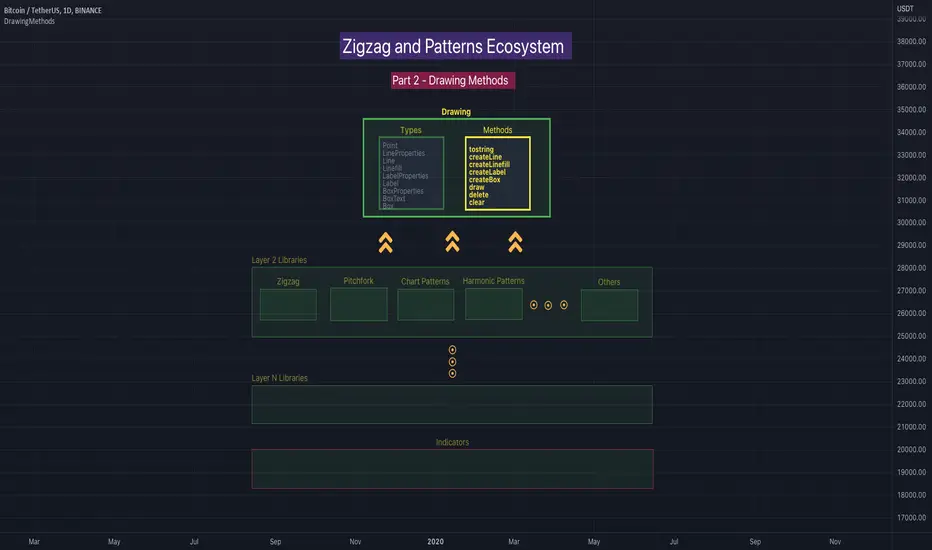
DrawingMethodsLibrary "DrawingMethods"
tostring(this, sortKeys, sortOrder, includeKeys)
Converts DrawingTypes/Point object to string representation
Parameters:
this : DrawingTypes/Point object
sortKeys : If set to true, string output is sorted by keys.
sortOrder : Applicable only if sortKeys is set to true. Positive number will sort them in ascending order whreas negative numer will sort them in descending order. Passing 0 will not sort the keys
includeKeys : Array of string containing selective keys. Optional parmaeter. If not provided, all the keys are considered
Returns: string representation of DrawingTypes/Point
tostring(this, sortKeys, sortOrder, includeKeys)
Converts DrawingTypes/LineProperties object to string representation
Parameters:
this : DrawingTypes/LineProperties object
sortKeys : If set to true, string output is sorted by keys.
sortOrder : Applicable only if sortKeys is set to true. Positive number will sort them in ascending order whreas negative numer will sort them in descending order. Passing 0 will not sort the keys
includeKeys : Array of string containing selective keys. Optional parmaeter. If not provided, all the keys are considered
Returns: string representation of DrawingTypes/LineProperties
tostring(this, sortKeys, sortOrder, includeKeys)
Converts DrawingTypes/Line object to string representation
Parameters:
this : DrawingTypes/Line object
sortKeys : If set to true, string output is sorted by keys.
sortOrder : Applicable only if sortKeys is set to true. Positive number will sort them in ascending order whreas negative numer will sort them in descending order. Passing 0 will not sort the keys
includeKeys : Array of string containing selective keys. Optional parmaeter. If not provided, all the keys are considered
Returns: string representation of DrawingTypes/Line
tostring(this, sortKeys, sortOrder, includeKeys)
Converts DrawingTypes/LabelProperties object to string representation
Parameters:
this : DrawingTypes/LabelProperties object
sortKeys : If set to true, string output is sorted by keys.
sortOrder : Applicable only if sortKeys is set to true. Positive number will sort them in ascending order whreas negative numer will sort them in descending order. Passing 0 will not sort the keys
includeKeys : Array of string containing selective keys. Optional parmaeter. If not provided, all the keys are considered
Returns: string representation of DrawingTypes/LabelProperties
tostring(this, sortKeys, sortOrder, includeKeys)
Converts DrawingTypes/Label object to string representation
Parameters:
this : DrawingTypes/Label object
sortKeys : If set to true, string output is sorted by keys.
sortOrder : Applicable only if sortKeys is set to true. Positive number will sort them in ascending order whreas negative numer will sort them in descending order. Passing 0 will not sort the keys
includeKeys : Array of string containing selective keys. Optional parmaeter. If not provided, all the keys are considered
Returns: string representation of DrawingTypes/Label
tostring(this, sortKeys, sortOrder, includeKeys)
Converts DrawingTypes/Linefill object to string representation
Parameters:
this : DrawingTypes/Linefill object
sortKeys : If set to true, string output is sorted by keys.
sortOrder : Applicable only if sortKeys is set to true. Positive number will sort them in ascending order whreas negative numer will sort them in descending order. Passing 0 will not sort the keys
includeKeys : Array of string containing selective keys. Optional parmaeter. If not provided, all the keys are considered
Returns: string representation of DrawingTypes/Linefill
tostring(this, sortKeys, sortOrder, includeKeys)
Converts DrawingTypes/BoxProperties object to string representation
Parameters:
this : DrawingTypes/BoxProperties object
sortKeys : If set to true, string output is sorted by keys.
sortOrder : Applicable only if sortKeys is set to true. Positive number will sort them in ascending order whreas negative numer will sort them in descending order. Passing 0 will not sort the keys
includeKeys : Array of string containing selective keys. Optional parmaeter. If not provided, all the keys are considered
Returns: string representation of DrawingTypes/BoxProperties
tostring(this, sortKeys, sortOrder, includeKeys)
Converts DrawingTypes/BoxText object to string representation
Parameters:
this : DrawingTypes/BoxText object
sortKeys : If set to true, string output is sorted by keys.
sortOrder : Applicable only if sortKeys is set to true. Positive number will sort them in ascending order whreas negative numer will sort them in descending order. Passing 0 will not sort the keys
includeKeys : Array of string containing selective keys. Optional parmaeter. If not provided, all the keys are considered
Returns: string representation of DrawingTypes/BoxText
tostring(this, sortKeys, sortOrder, includeKeys)
Converts DrawingTypes/Box object to string representation
Parameters:
this : DrawingTypes/Box object
sortKeys : If set to true, string output is sorted by keys.
sortOrder : Applicable only if sortKeys is set to true. Positive number will sort them in ascending order whreas negative numer will sort them in descending order. Passing 0 will not sort the keys
includeKeys : Array of string containing selective keys. Optional parmaeter. If not provided, all the keys are considered
Returns: string representation of DrawingTypes/Box
delete(this)
Deletes line from DrawingTypes/Line object
Parameters:
this : DrawingTypes/Line object
Returns: Line object deleted
delete(this)
Deletes label from DrawingTypes/Label object
Parameters:
this : DrawingTypes/Label object
Returns: Label object deleted
delete(this)
Deletes Linefill from DrawingTypes/Linefill object
Parameters:
this : DrawingTypes/Linefill object
Returns: Linefill object deleted
delete(this)
Deletes box from DrawingTypes/Box object
Parameters:
this : DrawingTypes/Box object
Returns: DrawingTypes/Box object deleted
delete(this)
Deletes lines from array of DrawingTypes/Line objects
Parameters:
this : Array of DrawingTypes/Line objects
Returns: Array of DrawingTypes/Line objects
delete(this)
Deletes labels from array of DrawingTypes/Label objects
Parameters:
this : Array of DrawingTypes/Label objects
Returns: Array of DrawingTypes/Label objects
delete(this)
Deletes linefill from array of DrawingTypes/Linefill objects
Parameters:
this : Array of DrawingTypes/Linefill objects
Returns: Array of DrawingTypes/Linefill objects
delete(this)
Deletes boxes from array of DrawingTypes/Box objects
Parameters:
this : Array of DrawingTypes/Box objects
Returns: Array of DrawingTypes/Box objects
clear(this)
clear items from array of DrawingTypes/Line while deleting underlying objects
Parameters:
this : array
Returns: void
clear(this)
clear items from array of DrawingTypes/Label while deleting underlying objects
Parameters:
this : array
Returns: void
clear(this)
clear items from array of DrawingTypes/Linefill while deleting underlying objects
Parameters:
this : array
Returns: void
clear(this)
clear items from array of DrawingTypes/Box while deleting underlying objects
Parameters:
this : array
Returns: void
draw(this)
Creates line from DrawingTypes/Line object
Parameters:
this : DrawingTypes/Line object
Returns: line created from DrawingTypes/Line object
draw(this)
Creates lines from array of DrawingTypes/Line objects
Parameters:
this : Array of DrawingTypes/Line objects
Returns: Array of DrawingTypes/Line objects
draw(this)
Creates label from DrawingTypes/Label object
Parameters:
this : DrawingTypes/Label object
Returns: label created from DrawingTypes/Label object
draw(this)
Creates labels from array of DrawingTypes/Label objects
Parameters:
this : Array of DrawingTypes/Label objects
Returns: Array of DrawingTypes/Label objects
draw(this)
Creates linefill object from DrawingTypes/Linefill
Parameters:
this : DrawingTypes/Linefill objects
Returns: linefill object created
draw(this)
Creates linefill objects from array of DrawingTypes/Linefill objects
Parameters:
this : Array of DrawingTypes/Linefill objects
Returns: Array of DrawingTypes/Linefill used for creating linefills
draw(this)
Creates box from DrawingTypes/Box object
Parameters:
this : DrawingTypes/Box object
Returns: box created from DrawingTypes/Box object
draw(this)
Creates labels from array of DrawingTypes/Label objects
Parameters:
this : Array of DrawingTypes/Label objects
Returns: Array of DrawingTypes/Label objects
createLabel(this, lblText, tooltip, properties)
Creates DrawingTypes/Label object from DrawingTypes/Point
Parameters:
this : DrawingTypes/Point object
lblText : Label text
tooltip : Tooltip text. Default is na
properties : DrawingTypes/LabelProperties object. Default is na - meaning default values are used.
Returns: DrawingTypes/Label object
createLine(this, other, properties)
Creates DrawingTypes/Line object from one DrawingTypes/Point to other
Parameters:
this : First DrawingTypes/Point object
other : Second DrawingTypes/Point object
properties : DrawingTypes/LineProperties object. Default set to na - meaning default values are used.
Returns: DrawingTypes/Line object
createLinefill(this, other, fillColor, transparency)
Creates DrawingTypes/Linefill object from DrawingTypes/Line object to other DrawingTypes/Line object
Parameters:
this : First DrawingTypes/Line object
other : Other DrawingTypes/Line object
fillColor : fill color of linefill. Default is color.blue
transparency : fill transparency for linefill. Default is 80
Returns: Array of DrawingTypes/Linefill object
createBox(this, other, properties, textProperties)
Creates DrawingTypes/Box object from one DrawingTypes/Point to other
Parameters:
this : First DrawingTypes/Point object
other : Second DrawingTypes/Point object
properties : DrawingTypes/BoxProperties object. Default set to na - meaning default values are used.
textProperties : DrawingTypes/BoxText object. Default is na - meaning no text will be drawn
Returns: DrawingTypes/Box object
createBox(this, properties, textProperties)
Creates DrawingTypes/Box object from DrawingTypes/Line as diagonal line
Parameters:
this : Diagonal DrawingTypes/PoLineint object
properties : DrawingTypes/BoxProperties object. Default set to na - meaning default values are used.
textProperties : DrawingTypes/BoxText object. Default is na - meaning no text will be drawn
Returns: DrawingTypes/Box object
DrawingTypesLibrary "DrawingTypes"
User Defined Types for basic drawing structure. Other types and methods will be built on these.
Point
Point refers to point on chart
Fields:
price : pivot price
bar : pivot bar
bartime : pivot bar time
LineProperties
Properties of line object
Fields:
xloc : X Reference - can be either xloc.bar_index or xloc.bar_time. Default is xloc.bar_index
extend : Property which sets line to extend towards either right or left or both. Valid values are extend.right, extend.left, extend.both, extend.none. Default is extend.none
color : Line color
style : Line style, valid values are line.style_solid, line.style_dashed, line.style_dotted, line.style_arrow_left, line.style_arrow_right, line.style_arrow_both. Default is line.style_solid
width : Line width. Default is 1
Line
Line object created from points
Fields:
start : Starting point of the line
end : Ending point of the line
properties : LineProperties object which defines the style of line
object : Derived line object
LabelProperties
Properties of label object
Fields:
xloc : X Reference - can be either xloc.bar_index or xloc.bar_time. Default is xloc.bar_index
yloc : Y reference - can be yloc.price, yloc.abovebar, yloc.belowbar. Default is yloc.price
color : Label fill color
style : Label style as defined in www.tradingview.com Default is label.style_none
textcolor : text color. Default is color.black
size : Label text size. Default is size.normal. Other values are size.auto, size.tiny, size.small, size.normal, size.large, size.huge
textalign : Label text alignment. Default if text.align_center. Other allowed values - text.align_right, text.align_left, text.align_top, text.align_bottom
text_font_family : The font family of the text. Default value is font.family_default. Other available option is font.family_monospace
Label
Label object
Fields:
point : Point where label is drawn
lblText : label text
tooltip : Tooltip text. Default is na
properties : LabelProperties object
object : Pine label object
Linefill
Linefill object
Fields:
line1 : First line to create linefill
line2 : Second line to create linefill
fillColor : Fill color
transparency : Fill transparency range from 0 to 100
object : linefill object created from wrapper
BoxProperties
BoxProperties object
Fields:
border_color : Box border color. Default is color.blue
bgcolor : box background color
border_width : Box border width. Default is 1
border_style : Box border style. Default is line.style_solid
extend : Extend property of box. default is extend.none
xloc : defines if drawing needs to be done based on bar index or time. default is xloc.bar_index
BoxText
Box Text properties.
Fields:
boxText : Text to be printed on the box
text_size : Text size. Default is size.auto
text_color : Box text color. Default is color.yellow.
text_halign : horizontal align style - default is text.align_center
text_valign : vertical align style - default is text.align_center
text_wrap : text wrap style - default is text.wrap_auto
text_font_family : Text font. Default is
Box
Box object
Fields:
p1 : Diagonal point one
p2 : Diagonal point two
properties : Box properties
textProperties : Box text properties
object : Box object created