Trend Fusion Indicator🎯 Trend Fusion Indicator🎯
Professional trading indicator combining EMA momentum with Supertrend volatility for high-probability signals.
📊KEY FEATURES:
• 9 EMA & Supertrend (10,3) crossover signals
• Visual trend direction with colored fills
• Buy/Sell arrows at crossover points
• Real-time trend tracking
• Clean, professional interface
⚡SIGNAL LOGIC:
✅ BUY: When EMA crosses ABOVE Supertrend
✅ SELL: When EMA crosses BELOW Supertrend
🎨VISUAL INDICATORS:
• Green Zone/Fill: Bullish trend (EMA > Supertrend)
• Red Zone/Fill: Bearish trend (EMA < Supertrend)
• Triangle Arrows: Entry signals
• Background Colors: Trend confirmation
⚙️CUSTOMIZABLE SETTINGS:
• EMA Length (Default: 9)
• Supertrend ATR Length (Default: 10)
• Supertrend Factor (Default: 3.0)
🔔ALERTS INCLUDED:
• Buy Alert: EMA crosses above Supertrend
• Sell Alert: EMA crosses below Supertrend
📈 BEST FOR:
• Swing Trading
• Day Trading
• Trend Following
• Market Reversals
⚠️ DISCLAIMER: This indicator is for educational purposes only.
Trading involves risk. Not financial advice. Use at your own risk.
المتوسط المتحرك الأسي

SB - Ultimate Clean Trend Pro Uses dynamic Moving colour coding for spotting chage of bias. Use set up with keeping VWAP in reference.

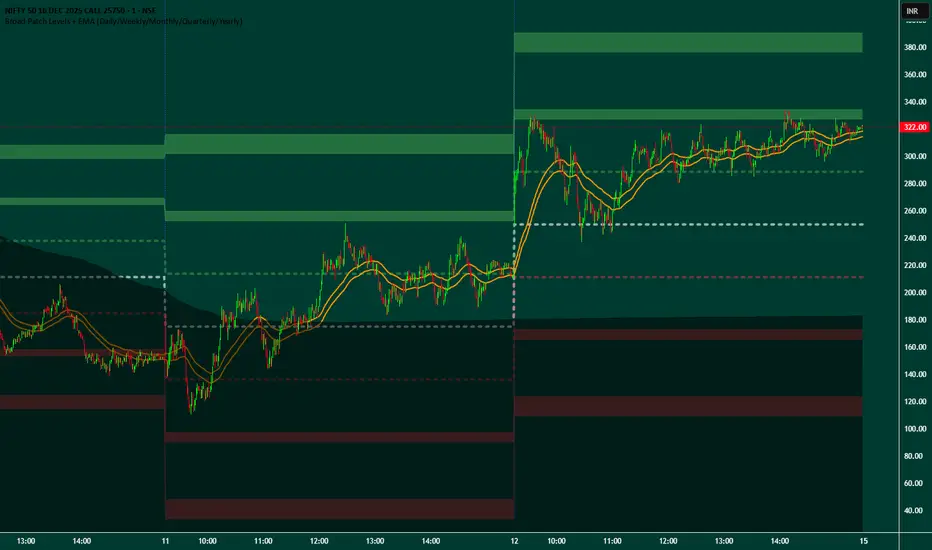
Broad Patch Levels + EMA (Daily/Weekly) with Directional AlertsThis indicator provides dynamic support and resistance levels along with trend guidance using EMA lines for daily or weekly timeframes. It is fully customizable, offering toggles for individual levels, trend lines, and alert notifications.
Key highlights:
Clearly visualize key market levels for potential trade entries and exits.
Monitor trend direction with EMA-based guidance.
Receive alerts when price interacts with important levels or trend zones.
Configurable visibility and alert options for a clean and personalized chart layout.
Ideal for professional traders looking for a structured, easy-to-read market perspective without exposing proprietary methods or calculations.
3 EMA with Alerts 2025This indicator plots three key EMAs (20, 50, and 200) directly on the chart, making it easy to track short-, medium-, and long-term trends. A color-coded table is displayed in the top-right corner for quick reference.
The script also includes smart alerts that trigger only when the state changes:
• 🔵 EMA 20 crossing above EMA 50 & EMA 200 → Bullish signal
• 🔴 EMA 20 crossing below EMA 50 & EMA 200 → Bearish signal
This tool is designed for traders who want clean visuals, reliable alerts, and simplified trend recognition in 2025 markets.

EMA Cross + 12 Indicator Dashboard (Candle Filter)🚀 Ultimate EMA Trend Intelligence + 12-Factor Dashboard
Stop trading blind crossovers. Most moving average strategies fail because they lack context. This script solves that by fusing a robust 6-EMA Trend System with a powerhouse “Consensus Engine” that tracks 12 leading indicators simultaneously.
Unlike standard indicators that repaint or react too fast, this tool utilizes a strict “2-Candle Confirmation Protocol” to filter out market noise and bull/bear traps.
🔥 Why This Indicator Give You an Edge:
🛡️ The “Fakeout Shield” (2-Candle Filter): Every signal is double-checked against the previous bar’s momentum. If the trend isn’t sustained, the signal doesn’t fire. No more getting trapped by wicks.
📊 Institutional-Grade Dashboard: Get a real-time HUD (Heads-Up Display) directly on your chart. Instantly see the bias of RSI, MACD, ADX, Bollinger Bands, Volume, and more without cluttering your screen with oscillating lines.
🎯 High-Probability Confluence: A Buy/Sell signal is ONLY generated when the EMAs cross AND a “Council of 12” indicators agrees on the direction (fully adjustable consensus threshold).
🧠 Smart Volume Integration: Volume must exceed 1.5x the average to validate a move, ensuring you’re trading with the smart money, not against it.
🛠️ Key Features:
6-EMA Ribbon Logic: Covers short-term (9/26) to long-term (60/85/200) trends.
Zero-Repaint Signals: Once a candle closes and the label appears, it stays.
Fully Customizable: Adjust the strictness (e.g., require 8 out of 12 indicators to agree) to fit your trading style—from Scalping to Swing Trading.
Ready to trade with clarity? Add this to your chart and let the consensus guide you.

Ultimate Trading System - DMA/EMA + Volume + Chart PatternsOVERVIEW
Ultimate Trading System (UTS) is a comprehensive technical analysis tool that combines multiple analysis methods into one powerful
indicator. It detects market structure, identifies chart patterns, analyzes volume, and provides actionable trade recommendations.
FEATURES
17 MOVING AVERAGES
• 6 DMAs (Simple): 5, 10, 20, 50, 100, 200
• 11 EMAs (Exponential): 5, 8, 9, 12, 20, 21, 34, 50, 100, 180, 200
• Smart labels with price values
• Golden Cross / Death Cross detection
CHART PATTERN DETECTION
• Triangles: Ascending, Descending, Symmetrical
• Reversals: Head & Shoulders, Double Top, Double Bottom
• Continuation: Bull Flag, Bear Flag
• Confidence scores for each pattern
VOLUME ANALYSIS
• Relative volume vs 20-period average
• Volume trend detection (rising/falling)
• Bullish/Bearish divergence alerts
• Volume confirmation for signals
SMART ANALYSIS TABLE
• Real-time pattern detection
• Probability-based confidence scores
• Clear trade recommendations
• Volume status and divergence warnings
MARKET STRUCTURE DETECTION
• ACCUMULATION - Strong bullish setup
• DISTRIBUTION - Strong bearish setup
• BULL SETUP - Favorable long conditions
• BEAR SETUP - Favorable short conditions
• TRANSITION - Market changing direction
• CHOPPY - Avoid trading
HOW TO USE
1. Check the analysis table for current market bias
2. Look for pattern confirmations (Triangle, H&S, Double Top/Bottom)
3. Verify volume is confirming the move (not diverging)
4. Follow the ACTION recommendation
5. Use MA levels for support/resistance and stop placement
RECOMMENDATIONS
• 80%+ Confidence = Strong signal, consider entry
• 60-80% Confidence = Look for entries on pullbacks
• 40-60% Confidence = Wait for confirmation
• <40% Confidence = Avoid trading
SETTINGS
• Toggle individual MAs on/off
• Customize colors for each MA
• Adjust label offsets
• Set alert sensitivity (Conservative/Medium/Aggressive)
• Show/hide background colors and analysis table
ALERTS
Set alerts for:
• Strong Buy/Sell signals
• Chart pattern detection
• Volume divergences
• Golden/Death crosses
BEST USED ON
• Stocks, Forex, Crypto, Indices
• Timeframes: 5min to Daily
• Works on all markets

EMA Slope Angle# EMA Slope Angle Indicator
A professional, non-repainting overlay indicator that visualizes EMA slope strength as an angle in degrees, providing instant visual feedback through dynamic EMA coloring and comprehensive trend analysis.
## ORIGINALITY
This indicator is original in its approach to slope measurement:
- **Angle-based calculation**: Uses arctangent to calculate slope as an angle in degrees (not percentage), providing a more intuitive measure of trend strength
- **Dynamic visual feedback**: Combines real-time EMA line coloring with regime detection, creating a continuous visual representation of market conditions
- **Comprehensive analysis**: Integrates angle-based trend shift signals with optional statistical analysis in a single, cohesive tool
- **Non-repainting design**: All calculations use confirmed bars only, ensuring reliable, deterministic output
## HOW IT WORKS
The indicator calculates the EMA slope angle using trigonometric functions:
```
Angle = arctan((EMA_current - EMA_past) / lookback_bars) × 180/π
```
This provides an intuitive measure where:
- **Steep angles** = strong trends (visualized with saturated colors)
- **Shallow angles** = weak trends (visualized with lighter colors)
- **Near-zero angles** = flat/consolidation (visualized in gray)
The EMA line color dynamically reflects:
- **Direction**: Green shades for uptrends, red shades for downtrends
- **Strength**: Color intensity based on normalized angle (stronger slopes = more saturated colors)
- **Regime**: Gray for flat conditions when angle is below threshold
## KEY FEATURES
### Dynamic EMA Coloring
- EMA line color changes continuously based on slope strength
- Color intensity reflects trend strength (50-100% opacity range)
- Instant visual feedback without cluttering the chart
### Regime Detection
- Automatically classifies market conditions: **RISING**, **FALLING**, or **FLAT**
- Configurable angle thresholds for regime classification
- Real-time regime updates on confirmed bars only
### Trend-Shift Signals
- Detects transitions from FLAT to RISING/FALLING regimes
- Visual arrows on chart when significant trend shifts occur
- Prevents signal spam by only triggering from FLAT state
- Configurable trigger thresholds for signal sensitivity
### KPI Dashboard
- Real-time angle display (rounded to 1 decimal place)
- Current regime status with color coding
- Last signal tracking (UP/DOWN/NONE)
- Positioned in top-right corner for easy reference
### Advanced Angle Statistics (Optional)
- Detailed breakdown of angle distribution across 9 granular buckets:
- 0-0.2°, 0.2-0.5°, 0.5-1°, 1-1.5°, 1.5-2°, 2-3°, 3-5°, 5-10°, >10°
- Shows count and percentage for each bucket
- Automatically resets on symbol/timeframe changes
- Useful for analyzing historical slope patterns
## SETTINGS
### Main Settings
- **EMA Length**: Period for exponential moving average (default: 50)
- **Slope Lookback Bars**: Number of bars to compare for slope calculation (default: 5)
### Angle Settings
- **Flat Angle Threshold**: Maximum angle for FLAT regime classification (default: 2.0°)
- **Rising Angle Trigger**: Minimum angle to trigger RISING regime and UP signals (default: 1.0°)
- **Falling Angle Trigger**: Maximum angle to trigger FALLING regime and DOWN signals (default: -1.0°)
- **Max Angle for Color Saturation**: Maximum angle for full color intensity (default: 30.0°)
### Display Options
- **Uptrend Color**: Color for rising trends (default: dark green)
- **Downtrend Color**: Color for falling trends (default: dark red)
- **Flat Color**: Color for flat conditions (default: gray)
- **Show Trend-Shift Signals**: Toggle signal arrows on/off (default: true)
- **Show Angle Statistics**: Toggle statistics dashboard on/off (default: false)
## NON-REPAINTING GUARANTEE
- All calculations use confirmed bars only (`barstate.isconfirmed`)
- No future bar references
- No higher timeframe calls using `request.security()`
- Deterministic output - what you see is what you get
- Reliable for backtesting and live trading
## USE CASES
- **Trend Identification**: Instantly identify trend strength and direction at a glance
- **Reversal Detection**: Spot trend reversals early through regime changes
- **Trade Filtering**: Filter trades based on slope strength and regime
- **Consolidation Monitoring**: Identify flat market conditions for range trading
- **Pattern Analysis**: Study historical angle distributions to understand market behavior
- **Momentum Assessment**: Gauge trend momentum through visual color intensity
## LIMITATIONS
- Angle calculation depends on EMA length and lookback period settings
- Regime classification is based on configurable thresholds - adjust to match your trading style
- Signals only trigger when transitioning from FLAT state to prevent spam
- Statistics reset on symbol/timeframe changes (by design)
- Color intensity is normalized to max angle setting - adjust for your market's typical ranges
## TECHNICAL NOTES
- Uses Pine Script v6
- Overlay indicator (plots on price chart)
- No external dependencies
- Compatible with all TradingView chart types
- Works on all timeframes and symbols
## DISCLAIMER
This indicator is designed for visual trend analysis and educational purposes. Always combine with other technical analysis tools, fundamental analysis, and proper risk management strategies. Past performance does not guarantee future results. Trading involves risk of loss.
---
**Perfect for**: Swing traders, day traders, trend followers, and market analysts seeking intuitive trend strength visualization.

EMA/Volume/Institutional Candle (Deep)This indicator is designed for short-term swing trading and intraday trend identification using a combination of EMA structure, momentum shifts, volume confirmation, and institutional footprint analysis.
🔹 Key Features
1. EMA Trend Framework (9, 20, 50, 200)
✔ EMA 9 & EMA 20: Ultra-short-term momentum; ideal for fast trend shifts.
✔ EMA 50: Medium-term trend guide; helps identify pullbacks vs. reversals.
✔ EMA 200: Long-term trend bias and major dynamic support/resistance.
2. EMA 9/20 Crossover Signal
✔ Bullish Crossover → EMA 9 crossing above EMA 20 indicates momentum expansion and early trend reversal.
✔ Bearish Crossover → EMA 9 crossing below EMA 20 shows momentum weakening and possible short-side opportunity.
3. High-Volume Zone Detection
✔ Highlights candles with volume spikes above average, signaling institutional interest.
✔ Useful for identifying breakout validity, liquidity grabs, or trap candles.
4. Institutional Candles (Smart Money Footprint)
✔ Automatically marks institutional order blocks, imbalance zones, or large displacement candles.
✔ Helps traders identify where smart money entered the market and potential mitigation zones.
🎯 How This Indicator Helps You Trade
✔ Quickly spot trend direction with multi-EMA alignment
✔ Identify high-probability entries with EMA 9/20 crossover + volume confirmation
✔ Find institutional zones for sniper-style entries
✔ Filter fake breakouts using volume spikes
✔ Perfect for stocks, indices, crypto, and forex

Triple Moving Average's EMA/SMAThis Pine Script in its final v5 version is a fundamental visual tool that supports traders in quickly identifying the trend and sentiment.
Key Script Goal
This script's primary objective is flexible multi-timeframe analysis of the trend.
The script serves as a universal set of three independent moving averages, which is intended to help you with the visual assessment of the market context:
EMA (20 periods): Serves as dynamic support/resistance for short-term sentiment. It is highly sensitive to recent price action.
SMA1 (50 periods): Typically acts as a medium-term trend indicator. It is often used to identify corrections.
SMA2 (100 periods): Provides a long-term perspective. Its slope and position relative to the price indicate the dominant structural trend.
The script is a base for every trader who relies on technical analysis and Price Action, utilizing moving averages as dynamic S/R levels.

Trinity Ultimate 10 MA Ribbons)I got tired of trying to find a multi MA ribbon that could also color change and allow different types, if it exists then I could not find it... So here it is...
The **Trinity Ultimate 10 MA Ribbon** is a highly customizable, professional-grade moving average ribbon that combines extreme flexibility with beautiful visual feedback. Designed for traders who want full control without sacrificing clarity, it allows you to build a ribbon using up to ten completely independent moving averages — each with its own length, type, color, thickness, and visibility setting — while automatically coloring both the lines and the fills according to bullish or bearish conditions.
### Key Features
- Ten fully independent moving averages that can be mixed and matched exactly as you want.
- Each MA has its own selectable type: EMA (default), SMA, WMA, HMA, RMA, VWMA, or ALMA — perfect for combining fast EMAs with a slow HMA or a classic 200-period SMA.
- Every single MA line automatically changes color in real time: bright green when price is above the MA (bullish) and red when price is below the MA (bearish), making trend strength instantly visible across all timeframes.
- Smart, reactive ribbon fills that appear only between consecutive enabled MAs. Turn any MA on or off and the fills instantly adjust — no gaps, no broken bands, no manual rework.
- Nine layered fills with individually adjustable transparency (default is gradually increasing transparency from the fastest to the slowest MA), creating a smooth, depth-like ribbon effect that looks stunning on any chart background.
- Fill color itself is dynamic: green for bullish candles (close > open) and red for bearish candles, or you can customize both colors to any shade you prefer.
- Full control over every visual element: base colors, line thickness (1–10), lengths, and show/hide toggles for each of the ten MAs.
- Clean and lightweight code that compiles instantly in Pine Script v5 and works on all markets and timeframes without lag.
In short, this is the most flexible and visually informative moving-average ribbon available on TradingView today. Whether you want a classic 9-EMA ribbon, a Guppy-style multiple-timeframe setup, a hybrid EMA/HMA mix, or just three or four key levels, the indicator adapts perfectly while always telling you at a glance where the bulls and bears are in control.

Quicksilver Master Terminal [Institutional]Overview
The Quicksilver Master Terminal is a comprehensive data visualization interface designed to bring institutional-grade market awareness to the retail chart. It replaces the need for multiple cluttered indicators by consolidating Trend, Momentum, Volatility, and Structure into a single Heads-Up Display (HUD).
Designed by Quicksilver Algo Systems, this tool is engineered for precision scalpers and prop firm traders who require instant situational awareness without switching timeframes.
Features
1. The Institutional HUD (Heads-Up Display)
Located in the top-right corner, this live dashboard provides real-time metrics on:
Market Structure: Instantly identifies if the asset is in a Bullish or Bearish regime relative to the 200 EMA.
Momentum Status: Tracks overbought/oversold conditions using smoothed Stochastic logic.
Volatility (ATR): Displays live Average True Range data for precise Stop Loss placement.
Volume Flow: Detects institutional volume spikes (1.5x average).
2. The Trend Cloud
A dynamic visual ribbon that fills the space between the Fast EMA (50) and Slow EMA (200).
Green Cloud: Strong Bullish Trend (Look for Longs).
Red Cloud: Strong Bearish Trend (Look for Shorts).
Cross: Visual warning of trend reversals.
3. Sniper Signal Logic
The script paints "INSTITUTIONAL BUY" and "INSTITUTIONAL SELL" labels only when high-probability confluence occurs:
Exhaustion: Stochastic RSI breaches extreme levels (<20 or >80).
Confirmation: Price action aligns with Heikin Ashi smoothing to filter noise.
Momentum: Fast %K crosses Slow %D.
How to Use
For Scalping (1m - 5m): Wait for the Trend Cloud to align with the Signal. Take "BUY" signals only when the Cloud is Green.
For Risk Management: Use the live "Volatility" number in the HUD to set your Stop Loss (e.g., 1.5x the current Volatility value).
About the Developer
This script is part of the Quicksilver Ecosystem. We build algorithmic solutions focused on capital preservation and risk management for funded traders.
Disclaimer: This tool is for educational market analysis only. Past performance is not indicative of future results.

MA and EMA Cross [Pure Strategy]Simple EMA/SMA Crossover
This indicator signals BUY or SELL entries when the Fast EMA crosses the Slow SMA.
✅ Best For: Catching the start of strong trends.
⚠️ Warning: May give false signals in sideways (choppy) markets.
💡 Tip: Use this as a secondary confirmation for your existing strategy, rather than a standalone tool.

8EMA+BB-SubiProvides the facility to display 8 EMAs along with Bollinger Bands in the same indicator.

Fundamental Analysis DashboardFundamental Analysis Dashboard
Valuation | P/E, P/B, P/S, EV/EBITDA, PEG, FCF Yield
Profitability | ROE, ROA, ROIC, Net Margin, Gross Margin, Operating Margin
Growth | EPS Growth YoY, Revenue Growth YoY, EPS TTM
Financial Health | Debt/Equity, Current Ratio, Quick Ratio, Net Cash, FCF
Dividends | Dividend Yield, Payout Ratio, DPS
Technical Context | Price vs EMA50/200, RSI, 52-Week Position
The dashboard calculates a Fundamental Score (0-100) based on weighted criteria across all sections:
80-100: Excellent
65-79: Good
50-64: Fair
35-49: Weak
0-34: Poor

ShooterViz Lazy Trader EMA SystemShooterViz Lazy Trader EMA System - Complete User Guide
What This Script Does
This is a position scaling indicator that tells you exactly when to enter, add to, and exit trades using a simplified 5-EMA system. It removes the guesswork and decision fatigue from trading by giving you clear visual signals.
The Core Concept
3 entry signals that build your position from 20% → 50% → 100%
2 exit signals that scale you out at 50% → 50% (complete exit)
1 higher timeframe filter that keeps you on the right side of the trend
No Fibonacci calculations, no RSI divergence, no multi-indicator confusion. Just EMAs and price action.
What You'll See On Your Chart
1. Colored EMA Lines
Blue Lines (Entry Zone):
3 EMA (lightest blue) - Early reversal detector
5 EMA (darker blue) - Confirmation line
Green Lines (Add Zone):
21 EMA (bright green) - First add location
34 EMA (lighter green) - Final add location
Red Lines (Exit Zone):
89 EMA (lighter red) - First exit trigger
144 EMA (darker red) - Final exit trigger
Orange Lines (Hyper Frame - optional):
Hyper 21 EMA (from higher timeframe) - Trend direction
Hyper 34 EMA (from higher timeframe) - Bias confirmation
2. Triangle Signals
Green Triangles (Below Price) = BUY/ADD:
Lime triangle with "20%" = Entry 1: Price reclaimed 3→5 EMA (starter position)
Green triangle with "30%" = Entry 2: Price bounced off 21 EMA (first add)
Teal triangle with "50%" = Entry 3: Price broke out from 34 EMA compression (final add)
Red Triangles (Above Price) = SELL:
Orange triangle with "50% OFF" = Exit 1: Price broke below 89 EMA (take half off)
Red triangle with "EXIT ALL" = Exit 2: Price broke below 144 EMA (close remaining position)
3. Background Color (Trend Bias)
Light green background = Hyper frame EMAs trending up (bias LONG)
Light red background = Hyper frame EMAs trending down (bias SHORT)
Gray background = Neutral/choppy (be cautious)
4. Info Table (Top Right Corner)
A live status dashboard showing:
Which entry signals are currently active (✓ or —)
Which exit signals are currently active (⚠ or ⛔)
Current hyper frame bias (🟢 LONG / 🔴 SHORT / ⚪ NEUTRAL)
Which timeframe you're using for hyper frame filtering
How to Install and Set Up
Step 1: Add the Script to TradingView
Open TradingView
Click "Pine Editor" at the bottom of the screen
Copy the entire script code
Paste it into the Pine Editor
Click "Add to Chart"
Step 2: Configure Your Settings
Click the gear icon ⚙️ next to "LazyEMA" in your indicators list.
Critical Settings to Configure:
Hyper Frame Selection (Most Important!)
Location: "Hyper Frame (Pick ONE)" section
Setting: "Timeframe"
What to choose:
Trading 15min or 1H charts? → Use "240" (4-hour)
Trading 4H or Daily charts? → Use "D" (Daily)
Trading Daily or Weekly charts? → Use "W" (Weekly)
Why this matters: This filter keeps you aligned with the bigger trend. Only take longs when this timeframe is green, shorts when it's red.
MA Type (Optional, default is fine)
Location: "MA Config" section
Default: EMA (recommended)
Options: EMA, SMA, WMA, HMA, RMA, VWMA
Most traders should stick with EMA
Visual Toggles (Customize your view)
Entry Zone: Turn individual EMAs on/off (3, 5, 21, 34)
Exit Zone: Turn individual EMAs on/off (89, 144)
Hyper Frame: Toggle the higher timeframe EMAs on/off
Step 3: Clean Up Your Chart
Turn OFF these if visible:
Volume bars (they clutter the view)
Any other indicators you have loaded
Grid lines (optional, but cleaner)
Keep ONLY:
Price candles
Your ShooterViz Lazy Trader EMA System
Maybe support/resistance levels if you manually draw them
How to Trade With This Script
The Basic Workflow
Before the Market Opens:
Check the background color and info table bias
Green background? Look for LONG setups only
Red background? Look for SHORT setups only
Gray background? Stay flat or trade small
During the Trading Session:
LONGS (When hyper frame is bullish):
Wait for Entry 1 signal:
Lime triangle appears with "20%"
Price has reclaimed the 5 EMA after dipping to 3 EMA
Action: Enter 20% of your intended position
Stop loss: Place below the 5 EMA or recent swing low
Wait for Entry 2 signal:
Green triangle appears with "30%"
Price pulled back to 21 EMA and bounced
Action: Add 30% more (you're now at 50% total)
Move stop: Trail it up to below 21 EMA
Wait for Entry 3 signal:
Teal triangle appears with "50%"
Price compressed at 34 EMA and broke out
Action: Add final 50% (you're now 100% loaded)
Move stop: Trail it up to below 34 EMA
Wait for Exit 1 signal:
Orange triangle appears with "50% OFF"
Price broke below 89 EMA
Action: Exit 50% of your position immediately
Move stop on rest: Trail to 89 EMA or lock in profits
Wait for Exit 2 signal:
Red triangle appears with "EXIT ALL"
Price broke below 144 EMA
Action: Exit remaining 50% (you're now flat)
Or: Stop gets hit at 89 EMA (same result)
SHORTS (When hyper frame is bearish):
Same process, but inverted
Triangles appear above price instead of below
Look for breakdowns below EMAs instead of bounces off them
Exit when price reclaims 89 and 144 EMAs
Real-World Example Walkthrough
Setup: Trading ES (S&P 500 Futures) on 1H Chart
Chart Configuration:
Timeframe: 1 Hour
Hyper Frame: 240 (4-hour)
Ticker: ES
Pre-Market Check:
Background is light green
Info table shows "🟢 LONG" for Hyper Bias
Decision: Only look for long entries today
9:30 AM - Market Opens
Price dips and touches 3 EMA
Watch for: Reclaim of 5 EMA
9:45 AM - Entry 1 Triggers
Lime triangle appears below bar
Price closed above 5 EMA at $4,550
Action taken:
Enter long 20% position (2 contracts if targeting 10 total)
Stop loss at $4,545 (below 5 EMA)
Risk: $10 per contract × 2 = $20 risk
10:30 AM - Entry 2 Triggers
Price rallied to $4,565, pulls back
Green triangle appears at 21 EMA ($4,555)
Action taken:
Add 30% (3 more contracts, now have 5 total)
Move stop to $4,550 (below 21 EMA)
Current P/L: +$25 ($5 gain on original 2 contracts, break-even on new 3)
11:15 AM - Entry 3 Triggers
Price consolidates at 34 EMA around $4,560
Teal triangle appears as price breaks to $4,568
Action taken:
Add final 50% (5 more contracts, now have 10 total)
Move stop to $4,555 (below 34 EMA)
Current P/L: +$70
1:00 PM - Price Extends
Price rallies to $4,595 (on track)
89 EMA is at $4,575
No action yet, let it run
2:15 PM - Exit 1 Triggers
Price pulls back from $4,600
Orange triangle appears as price breaks below 89 EMA at $4,580
Action taken:
Exit 50% (5 contracts closed at $4,580)
Keep 5 contracts with stop at 89 EMA ($4,575)
Banked: +$150 average gain on closed 5 contracts
2:45 PM - Exit 2 Triggers
Price continues down
Red triangle appears as price breaks 144 EMA at $4,570
Action taken:
Exit remaining 5 contracts at $4,570
Banked: +$100 on remaining 5 contracts
Final Results:
Total gain: $250 on the trade
Initial risk: $50 (if stopped out at Entry 1)
Risk/Reward: 5:1
Time in trade: ~5 hours
Common Questions
"What if I miss Entry 1? Can I still take Entry 2?"
Yes! Each entry is independent. If you miss the 3→5 reclaim, wait for the 21 EMA bounce. You'll start with a 30% position instead of 20%, but that's fine.
Rule: Never chase. Wait for the next EMA setup.
"What if multiple entry signals trigger at the same bar?"
Rare, but possible. If you see both Entry 1 and Entry 2 trigger together:
Take Entry 1 first (20%)
If the next bar confirms Entry 2 is still valid, add 30%
When in doubt, scale in gradually
"The hyper frame is green but I'm seeing short signals?"
Don't take them. The hyper frame is your bias filter. If it says "go long," ignore short setups. They're usually lower probability and will get stopped out.
"Can I use this for swing trading overnight?"
Absolutely. Just switch your hyper frame:
If you're on Daily charts, use Weekly hyper frame
If you're on 4H charts, use Daily hyper frame
Adjust position sizes for overnight risk
"What if the signal appears right at market close?"
Don't chase it. Wait for the next bar (next day) to confirm. Signals that appear in the last 5 minutes are often noise.
"How do I set up alerts?"
Right-click on the chart
Select "Add Alert"
Choose "LazyEMA" from the condition dropdown
Select which signal you want alerts for:
Entry 1: 3→5 Reclaim
Entry 2: 21 EMA Add
Entry 3: 34 EMA Breakout
Exit 1: 89 EMA Break
Exit 2: 144 EMA Break
Click "Create"
Pro tip: Set up all 5 alerts so you never miss a signal.
Position Sizing Guide see
swingtradenotes.substack.com
Critical Rule: Know your total risk BEFORE you take Entry 1. Don't wing it.
Customization Tips
For Day Traders (Scalpers)
Use 5min or 15min charts
Hyper frame: 1H or 4H
Expect 2-4 setups per day
Tighter stops (0.5% risk per entry)
For Swing Traders
Use 4H or Daily charts
Hyper frame: Daily or Weekly
Expect 1-2 setups per week
Wider stops (1-2% risk per entry)
For Position Traders
Use Daily or Weekly charts
Hyper frame: Weekly or Monthly
Expect 1-2 setups per month
Widest stops (2-3% risk per entry)
The "Don't Be Stupid" Checklist
Before taking ANY signal from this script, ask:
✅ Is the hyper frame bias pointing in my direction?
✅ Is the signal clean (not at a weird time or during news)?
✅ Do I know my stop loss level?
✅ Do I know my position size?
✅ Can I afford to lose if this trade fails?
If you answered "no" to ANY of these, skip the trade.
Troubleshooting
"I'm not seeing any signals"
Possible causes:
The "Show Lazy Trader System" toggle is off (turn it on)
Your chart timeframe is too high (try 1H or 4H)
Market is in a tight range (EMAs are compressed)
You need to refresh the chart
"Too many signals, getting whipsawed"
Fixes:
Increase your chart timeframe (go from 15m to 1H)
Switch to a less volatile ticker
Only trade when hyper frame bias is STRONG (not neutral)
Add a minimum bar count between signals
"The info table is covering my price action"
Fix:
Edit the script
Find the line: table.new(position.top_right, ...
Change position.top_right to position.bottom_right or position.top_left
"Signals appear then disappear"
This is normal (repainting). Some signals (especially compression breakouts) can disappear if the next bar reverses. This is why you:
Wait for bar close before acting
Use alerts that only fire on confirmed bars
Don't chase signals mid-bar
Final Thoughts
This script is a decision-making tool, not a crystal ball. It shows you high-probability setups based on EMA dynamics and trend structure. You still need to:
Manage your risk
Choose your position size
Stick to the rules
Accept losses when they happen
The system works when YOU work the system.
Print this guide, tape it next to your monitor, and follow it religiously for 20 trades before making ANY changes.
Good luck, and stay lazy (the smart way).


Levels v14 BetaCombination of all the important levels that you could possibly need.
Vwap
Daily / Weekly / Monthly - Settlements
Daily / Weekly / Monthly - Openings
Lows / Highs
Pivot Points
ORB
EMA
Recommended to turn off labels to avoid having too many price labels and keeping it clean.
In the settings - style turn off :
Labels on price scale
Values in status line
Inputs in status line
For the ORB setting change the UTC value depending on your time zone

Brahmastra Basic1. Core Purpose and Strategy
This is a multi-timeframe (MTF) indicator designed to identify high-probability entry points for a specific trend-following options selling strategy. It works by confirming a trend on higher timeframes (Daily and Hourly) before waiting for a precise entry trigger on a lower timeframe (15-Minute).
The core principle is confluence: ensuring that the Daily trend bias and the Hourly trend momentum are aligned before looking for a trade. This filters out many false signals that can occur when trading on a single timeframe.
IMPORTANT: This indicator MUST be applied to a 15-minute chart to function correctly.
2. How to Read the Visual Signals on Your Chart
The indicator provides several visual cues to guide you through the trading setup from start to finish.
A. Candle Colors: The "Setup is Ready" Signal
The primary signal to start paying attention is the change in candle color.
Aqua Candles: The market is in a Bullish Alignment. This means both the Daily and Hourly trends are bullish. You should now be preparing for a Put Sell entry. The very first aqua candle in a sequence is your "alert candle."
Yellow Candles: The market is in a Bearish Alignment. This means both the Daily and Hourly trends are bearish. You should now be preparing for a Call Sell entry. The very first yellow candle in a sequence is your "alert candle."
B. Entry Signals: The "Execute Trade" Signal
These signals appear only after the alert candle's level has been breached.
Green "PUT SELL" Label (below candle): This is your signal to enter a Put Sell (or a long position). It appears on the close of the 15-minute candle that breaks above the high of the first aqua alert candle.
Red "CALL SELL" Label (above candle): This is your signal to enter a Call Sell (or a short position). It appears on the close of the 15-minute candle that breaks below the low of the first yellow alert candle.
C. Exit Signals: The "Close Position" Signal
Red 'X' (above candle): This is the signal to close your Put Sell position. It appears when the primary daily trend has reversed to bearish.
Green 'X' (below candle): This is the signal to close your Call Sell position. It appears when the primary daily trend has reversed to bullish.
D. Background & EMA Lines: The "Context"
EMA Lines: The indicator plots two key EMAs from the higher timeframes onto your 15-minute chart so you can see the context.
Orange Line: Daily 5 EMA
Blue Line: Hourly 51 EMA
Faint Background Color: After an entry signal appears, the background will remain faintly colored (green for a bullish trade, red for a bearish trade) to remind you that you are in a hypothetical position.
3. The Step-by-Step Strategy Logic
Here is the precise set of rules the indicator follows to generate its signals:
For a PUT Sell (Bullish Trade):
Alignment Check: The indicator first confirms that:
The Daily Close is above the Daily 5 EMA.
AND the Hourly Close is above the Hourly 51 EMA.
Alert Phase: As soon as this alignment is true, the 15-minute candles turn aqua. The indicator internally notes the high of the very first aqua candle.
Entry Trigger: The indicator waits for a 15-minute candle to close above the high of that first alert candle. When this happens, the green "PUT SELL" label is plotted.
Exit Condition: The position is held until the Daily Close crosses back below the Daily 5 EMA. When this happens, the red 'X' exit signal is plotted.
For a CALL Sell (Bearish Trade):
Alignment Check: The indicator first confirms that:
The Daily Close is below the Daily 5 EMA.
AND the Hourly Close is below the Hourly 51 EMA.
Alert Phase: As soon as this alignment is true, the 15-minute candles turn yellow. The indicator internally notes the low of the very first yellow candle.
Entry Trigger: The indicator waits for a 15-minute candle to close below the low of that first alert candle. When this happens, the red "CALL SELL" label is plotted.
Exit Condition: The position is held until the Daily Close crosses back above the Daily 5 EMA. When this happens, the green 'X' exit signal is plotted.

EMA 21/55/100/200EMA 21/55/100/200 – All-in-one Trend & Swing Trading Toolkit
A clean and practical four-EMA system designed for trend trading, swing trading, and short-to-mid-term market structure analysis.
This indicator includes full visualization and customization options:
1️⃣ Four EMAs with full control (21/55/100/200)
Enable or disable each EMA individually.
All periods, colors, and line widths are fully adjustable for different trading systems.
2️⃣ Strong Trend Background Highlight
When the EMAs form a classic perfect bullish or perfect bearish alignment,
the indicator automatically highlights the chart background to show strong trend conditions.
3️⃣ EMA Cross Signals
Visual markers for key EMA crossovers such as:
• 21 ↗ 55
• 55 ↗ 100
These help identify momentum shifts, trend acceleration, or potential reversals.
4️⃣ EMA Touch Alerts
Alerts trigger whenever price touches any EMA, useful for:
• Trend pullback entries
• Monitoring short-term trend changes
• Validating support and resistance levels
⸻
EMA 21/55/100/200 四合一指标,适用于 EMA 的趋势交易、波段交易与中短线判断。
本指标包含完整的可视化选项:
1️⃣ EMA 21/55/100/200 四线自由开关
可调整周期、颜色、粗细,适配趋势或波段系统。
2️⃣ 多头/空头强势排列背景提示
当 EMA 呈现经典“完美多头 / 空头排列”时,会自动通过背景着色提示市场结构进入强趋势。
3️⃣ EMA 交叉信号提示
支持 21↗55、55↗100 等关键均线交叉标记,便于观察趋势加速或反转。
4️⃣ EMA 触及警报提醒
当价格触及任意 EMA 时,可触发警报,用于:
• 趋势回调买点
• 关注短期趋势变化
• 观察支撑/压力有效性

Veil Trend# Veil Trend (VTrend)
**Veil Trend** is a minimalist trend-following and volatility framework built around a triple-EMA structure and adaptive price bands. It is designed to clearly define trend direction, dynamic support and resistance, and momentum expansion—without clutter.
---
## 🔹 Core Components
### Main EMA (Slow)
Acts as the primary trend axis.
- Price **above** the main EMA → bullish bias
- Price **below** the main EMA → bearish bias
### Medium EMA
Tracks intermediate momentum and trend strength, helping visualize pullbacks within the broader trend.
### Fast EMA (Optional)
Provides short-term momentum sensitivity and early trend shifts.
Hidden by default to maintain a clean chart.
---
## 🔹 Adaptive Veil Bands
Veil Trend wraps the main EMA with adaptive volatility bands (“the veil”) to define normal price movement versus expansion.
- **ATR-Based Bands (Default)**
Bands automatically expand and contract with volatility, adapting to changing market conditions.
- **Percentage-Based Bands (Optional)**
Bands are offset by a fixed percentage from the main EMA, useful for consistent scaling across instruments.
The shaded area between bands represents the **healthy trend zone**, where pullbacks and consolidations typically occur.
---
## 🔹 Signals & Interpretation
*(Disabled by default for a clean visual experience)*
### Band Breaks
- **Break above upper band** → strong bullish momentum
- **Break below lower band** → strong bearish momentum
### Band Bounces
- **Bounce from lower band** → potential bullish continuation
- **Rejection at upper band** → potential bearish continuation
Alerts are included for all band events and can be enabled as needed.
---
## 🔹 Visual Design Philosophy
- Clean, layered EMA structure (“noodles”)
- Subtle volatility bands with optional fill
- Optional status table for quick market context
- Minimalist by default, information-rich when enabled
---
## 🔹 Best Use Cases
- Identifying trend direction and bias
- Trading pullbacks within established trends
- Spotting volatility expansion and breakout conditions
- Works on **stocks, crypto, forex, and indices**
- Effective across all timeframes
---
**Veil Trend doesn’t predict — it reveals.**


