Bitcoin Scalping Strategy (Sampled with: PMARP+MADRID MA RIBBON)
DISCLAIMER:
THE CONTENT WITHIN THIS STRATEGY IS CREATED FROM TWO INDICATORS CREATED BY TWO PINESCRIPTER'S. THE STRATEGY WAS EXECUTED BY MYSELF AND REVERSE-ENGINEERED TO MEET THE CONDITIONS OF THE INTENDED STRATEGY REQUESTOR. I DO NOT TAKE CREDIT FOR THE CONTENT WITHIN THE ESTABLISHED LINES MADE CLEAR BY MYSELF.
The Sampled Scripts and creators:
PMAR/PMARP by @The_Caretaker Link to original script:
Madrid MA RIBBON BAR by @Madrid Link to original script:
Cheat Code's strategy notes:
This sampled strategy (Requested by @elemy_eth) is one combining previously created studies. I reverse-engineered the local scope for the Madrid moving average color plots and set entry and exit conditions for certain criteria met. This strategy is meant to deliver an extremely high hit rate on a daily time frame. This is made possible because of the very low take profit percentage, during the context of a macro downtrend it is made easier to hit 1-3% scalps which is made visible with the strategy using sampled scripts I created here.
How it works:
Entry Conditions:
-Enter Long's if the lime color conditions are met true using the script detailed by Marid's MA
- No re-entry into positions needs to be met true (this prevents pyramiding of orders due to conditions being met true) applicable to both long and short side entries.
- To increase hit rate and prevent traps both the parameters of rsi being sub 80 and no previously engulfing candles need to be met true to enter a long position.
- Enter Short's if the red color conditions of Madrid's moving average are met true.
- Closing Long positions are typically not met within this indicator, however, it still sometimes triggers if necessary. This consists of a pmarp sub 99 and a position size greater than 0.0
- Closing Short positions are typically not met within this indicator, however, it still sometimes triggers if necessary. This consists of a pmarp over 01 and a position size less than 0.0
- Stop Loss: 27.75% Take Profit: 1% (Which does not trigger on ticks over 1% so you will see average trade profits greater than 1%)
BYBIT:BTCUSDT BINANCE:BTCUSDT COINBASE:BTCUSD
Best Of Luck :)
-CheatCode1
المتوسط المتحرك الأسي

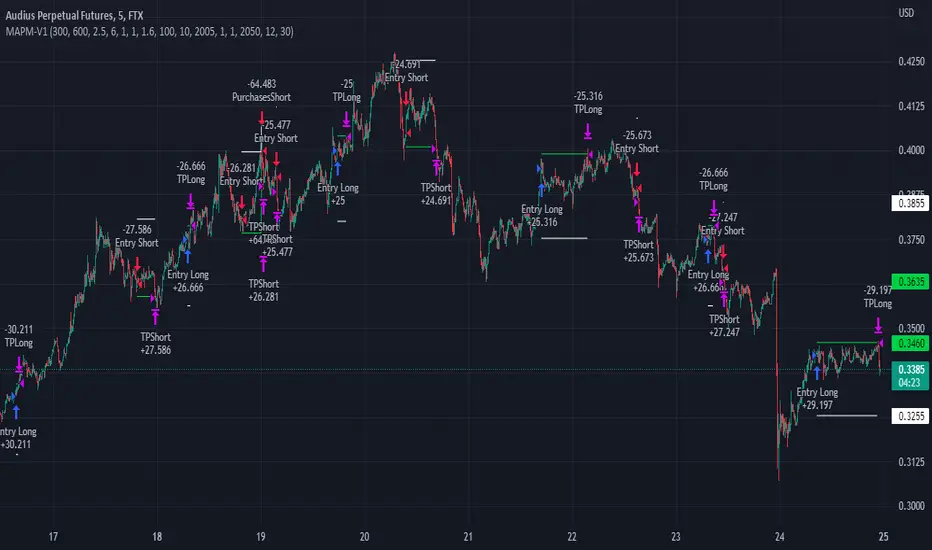
MAPM-V1Greetings dear traders!
I would like to introduce you the script for testing the strategy by crossing two signal EMAs based on the MACD indicator.
In the strategy itself:
The entry is made as a percentage of the deposit by EMA crossings.
There are additional purchases, they are set from the entry price for a given percentage in the opposite direction of the transaction.
The distance in percentage from the entry price, on which the additional purchase is exposed, is set in the StepAddPurchases parameter.
The Martingale parameter increases the initially purchased amount of the base traded cryptocurrency in each additional purchase.
The essence of the strategy is to trade a large number of pairs in order to diversify risks and obtain a stable income.
It is desirable to enter each trading pair with a small percentage of the deposit.
The optimization result shows the trading result for the period of 5000 bars (the platform does not give more history) on 10% of the deposit for the first transaction, the addition will also take place on initially bought amount of base traded cryptocurrency, multiplied by the martingale parameter, raised by the number of addition.
The strategy will still be updated, so see you soon!
sachin5986using EMA 3 and 21 moving average and showing buy and sell signal to on chart with selected time frame

J2S Backtest: 123-Stormer StrategyThis backtest presents the 123-Stormer strategy created by trader Alexandre Wolwacz "Stormer". The strategy is advocates and shared by the trader through his YouTube channel without restrictions.
Note :
This is not an investment recommendation. The purpose of this study is only to share knowledge with the community on tradingview.
What is the purpose of the strategy?
The strategy is to buy the 123-Stormer pattern at the bottom of an uptrend and sell the 123-Stormer pattern at the top of a downtrend, aiming for a short stop for a long profit target.
To which timeframe of a chart is it applicable to?
Recommended for weekly and daily charts, as the signals are more reliable, being that strategy a good option for swing and position trading.
What about risk management and success rate?
The profit target is established by the author as being twice the risk assumed. Also according to the author, the strategy is mathematically positive, reaching around 65% of success rate in tradings.
How are the trends identified in this strategy?
Two averages are plotted to indicate the trend, a fast EMA average with an 8-week close and a slow EMA average with an 80-week close.
Uptrend happens whenever the fast EMA is above the slow EMA and prices are above the fast EMA. In this case, we should start looking for a LONG entry based on the signal of the 123-Stromer pattern to buying.
On the other hand, downtrend happens when the fast EMA is below the slow EMA and prices are below the fast EMA. In this case, we should start looking for a SHORT entry based on the signal of the 123-Stromer pattern to selling.
How to identify the 123-Stormer pattern for a LONG entry?
This pattern consists of three candles. The first candle has a higher low than the second candle's low, and the third candle has a higher low than the second candle's low. In this pattern, we will buy as soon as a trade occurs above the third candle's high, placing a stop as soon as a trade occurs below the second candle's low, with profit target twice the risk assumed. In another words, the amplitude of the prices of the three candles from the third candle’s high upwards. (you can use fibonacci extension to determine your stops and profit targets).
Importantly, the low of the three candles must be above the fast EMA average and in an uptrend.
How to identify the 123-Stormer pattern for a SHORT entry?
This pattern consists of three candles. The first candle has a lower high than the second candle's high, and the third candle has a lower high than the second candle's high. In this pattern, we will sell as soon as a trade occurs below the third candle's low, placing a stop as soon as a trade occurs above the second candle's high, with profit target twice the risk assumed. In other words, the amplitude of prices of the three candles from the third candle’s low down (you can use fibonacci extension to determine your stops and profit targets).
Importantly, the high of the three candles must be below the fast average and in a downtrend.
Tips and tricks
According to the author, the best signal for both LONG or SHORT entry is when the third candle is a inside bar of second candle.
Backtest features
Backtest parameters are fully customizable. The user chooses to validate only LONG or SHORT entries, or both. It is also possible to determine the specific time period for running the backtests, as well as setting a threshold in candels for entry by the 123-Stormer pattern.
Furthermore, for validation purposes, you can choose to activate the best signal of the pattern recommended by the author of the strategy, as well as change the values of the EMA averages or even deactivate them.
Final message
Feel free to provide me with any improvement suggestions for the backtest script. Bear in mind, feel free to use the ideas in my script in your studies.

ComiCo - Joel on Crypto - MACD ScalpingThis is a modified (hopefully improved) version of the "Joel on Crypto - MACD Scalping" indicator. It got turned into a strategy, and added some extra filters, like number of trades after EMA cross, minimal EMA distance (EMA 50's distance from the EMA 200). It is just an experiment to see how good this scalping strategy can get.
Play around with it and let me know if you found good settings, or just have a comment on it.
I could get fairly good results on BTCUSDT 5m with these settings (all others left on default values):
Ticks Avg. Multiplier = 1.4
Max trades after EMA cross = 16
Limit Price Difference = 0
Take Profit = 0.0065
Stop Loss = 0.0085
Min EMA difference = 110
Pyramiding = 3

3ngine Global BoilerplateABOUT THE BOILERPLATE
This strategy is designed to bring consistency to your strategies. It includes a macro EMA filter for filtering out countertrend trades,
an ADX filter to help filter out chop, a session filter to filter out trades outside of desired timeframe, alert messages setup for automation,
laddering in/out of trades (up to 6 rungs), trailing take profit , and beautiful visuals for each entry. There are comments throughout the
strategy that provide further instructions on how to use the boilerplate strategy. This strategy uses `threengine_global_automation_library`
throughout and must be included at the top of the strategy using `import as bot`. This allows you to use dot notation
to access functions in the library - EX: `bot.orderCurrentlyExists(orderID)`.
HOW TO USE THIS STRATEGY
1. Add your inputs
There is a section dedicated for adding your own inputs near the top of the strategy, just above the boilerplate inputs
2. Add your calculations
If your strategy requires calculations, place them in the `Strategy Specific Calculations` section
3. Add your entry criteria
Add your criteria to strategySpecificLongConditions (this gets combined with boilerplate conditions in longConditionsMet)
Add your criteria to strategySpecificShortConditions (this gets combined with boilerplate conditions in shortConditionsMet)
Set your desired entry price (calculated on every bar unless stored as a static variable) to longEntryPrice and shortEntryPrice. ( This will be the FIRST ladder if using laddering capabilities. If you pick 1 for "Ladder In Rungs" this will be the only entry. )
4. Plot anything you want to overlay on the chart in addition to the boilerplate plots and labels. Included in boilerplate:
Average entry price
Stop loss
Trailing stop
Profit target
Ladder rungs

Short Swing Bearish MACD Cross (By Coinrule)This strategy is oriented towards shorting during downside moves, whilst ensuring the asset is trading in a higher timeframe downtrend, and exiting after further downside.
This script can work well on coins you are planning to hodl for long-term and works especially well whilst using an automated bot that can execute your trades for you. It allows you to hedge your investment by allocating a % of your coins to trade with, whilst not risking your entire holding. This mitigates unrealised losses from hodling as it provides additional cash from the profits made. You can then choose to hodl this cash, or use it to reinvest when the market reaches attractive buying levels. Alternatively, you can use this when trading contracts on futures markets where there is no need to already own the underlying asset prior to shorting it.
ENTRY
This script utilises the MACD indicator accompanied by the Exponential Moving Average (EMA) 450 to enter trades. The MACD is a trend following momentum indicator and provides identification of short-term trend direction. In this variation it utilises the 11-period as the fast and 26-period as the slow length EMAs, with signal smoothing set at 9.
The EMA 450 is used as additional confirmation to prevent the script from shorting when price is above this long-term moving average. Once price is above the EMA 450 the script will not open any shorts - preventing the rule from attempting to short uptrends. Due to this, this strategy is ideal for setting and forgetting.
The script will enter trades based on two conditions:
1) When the MACD signals a bearish cross. This occurs when the EMA 11 crosses below the EMA 26 within the MACD signalling the start of a potential downtrend.
2) Price has closed below the EMA 450. Price closing below this long-term EMA signals that the asset is in a sustained downtrend. Price breaking above this could indicate a bullish strength in which shorting would not be profitable.
EXIT
This script utilises a set take-profit and stop-loss from the entry of the trade. The take profit is set at 8% and the stop loss of 4%, providing a risk reward ratio of 2. This indicates the script will be profitable if it has a win ratio greater than 33%.
Take-Profit Exit: -8% price decrease from entry price.
OR
Stop-Loss Exit: +4% price increase from entry price.
Based on backtesting results across a selection of assets, the 45-minute and 1-hour timeframes are the best for this strategy.
The strategy assumes each order is using 30% of the available coins to make the results more realistic and to simulate you only ran this strategy on 30% of your holdings. A trading fee of 0.1% is also taken into account and is aligned to the base fee applied on Binance.
The backtesting data was recorded from December 1st 2021, just as the market was beginning its downtrend. We therefore recommend analysing the market conditions prior to utilising this strategy as it operates best on weak coins during downtrends and bearish conditions, however the EMA 450 condition should mitigate entries during bullish market conditions.

Booz StrategyBooz Backtesting : Booz Backtesting is a method for analyzing the performance of your current trading strategy . Booz Backtesting aims to help you generate results and evaluate risk and return without risking real capital.
The Booz Backtesting is the Booz Super Swing Indicator equivalent but gives you the ability to backtest data on different charts.
This is an Indicator created for the purpose of identifying trends in Multiple Markets, it is based on Moving Average Crossover and extra features.
Swing Trading: This function allows you to navigate the entire trend until it is not strong enough, so you can compare it with fixed parameters such as Take Profit and Stop Loss.
Take Profit and Stop Loss function: With this function you will be able to choose the most optimal parameters and see in real time the results in order to choose the best combination of parameters.
Leverage : We have this function for the futures markets where you can check which is the most appropriate leverage for your operation.
Trend Filter: allows you to take multiple entries in the same direction of the market.
If the market crosses below the 200 moving average, it will take only short entries.
If the market crosses above the 200 moving average, it will take only long entries.
Timeframes
Charting from 1 Hour, 4 Hour, Daily, Weekly, Weekly
Markets :Booz Backtesting can be tested in Cryptocurrency, Stocks and Futures markets.
Background Color : at a glance, you can see what cycle the market is in.
Green background : Shows that the market is in a bullish cycle.
Red background: Shows that the market is in a bearish cycle.

Bozz Strategy
Booz Backtesting : Booz Backtesting is a method for analyzing the performance of your current trading strategy . Booz Backtesting aims to help you generate results and evaluate risk and return without risking real capital.
The Booz Backtesting is the Booz Super Swing Indicator equivalent but gives you the ability to backtest data on different charts.
This is an Indicator created for the purpose of identifying trends in Multiple Markets, it is based on Moving Average Crossover and extra features.
Swing Trading: This function allows you to navigate the entire trend until it is not strong enough, so you can compare it with fixed parameters such as Take Profit and Stop Loss.
Take Profit and Stop Loss function: With this function you will be able to choose the most optimal parameters and see in real time the results in order to choose the best combination of parameters.
Leverage : We have this function for the futures markets where you can check which is the most appropriate leverage for your operation.
Trend Filter: allows you to take multiple entries in the same direction of the market.
If the market crosses below the 200 moving average, it will take only short entries.
If the market crosses above the 200 moving average, it will take only long entries.
Timeframes
Charting from 1 Hour, 4 Hour, Daily, Weekly, Weekly
Markets :Booz Backtesting can be tested in Cryptocurrency, Stocks and Futures markets.
Background Color : at a glance, you can see what cycle the market is in.
Green background : Shows that the market is in a bullish cycle.
Red background: Shows that the market is in a bearish cycle.
Twitter
Website

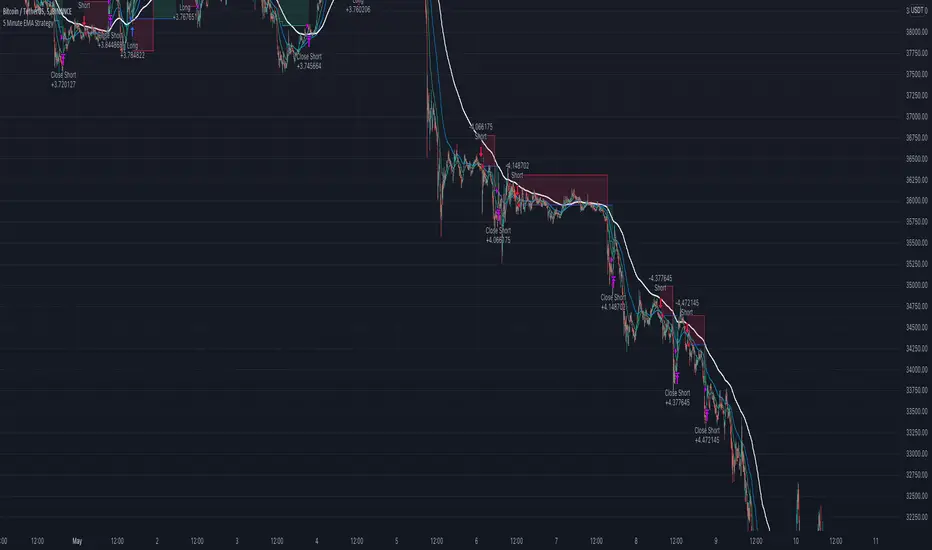
5 Minute Scalping StrategyTaking entrys based on the 1 minute timeframe MACD
only taking longs when all emas are in the correct order and there is a bigger than usual MACD downtick and the RSI is above 51
only taking shorts when all emas are in the opposite order and there is a bigger than usual uptick on the MACD and the RSI is bellow 49
bigger than usual ticks are defined by bollinger bands around the Macd and the ticks have to be higher than 35 and lower than -10
you can change whatever setting you like to make the strategy more profitible. pls share when you find a more profitible setting than me
the stoploss doesnt work correct if it would be hit in the same candle you enter the trade. pls share when you have a solution for this
the stratagy is profitible when i backtested it for the last month, but i dont know how it will play out in the future, so you enter the signals at your own risk

VXD SupercycleVXD is a brand new indicator and still developing. to minimize stop losses and overcome sideways market conditions, Higher Timeframe are recommended
Trend lines
-using Rolling VWAP as trend line to determined if Volume related to a certain price.
-you can switch RVWAP to EMA in the setting
ATR
-trailing 12*ATR and 2.4 Mutiplier
Pivot point and Rejected Block
Pivot show last High and low of a price in past bars
Rejected Block show when that High or Low price are important level to determined if it's Hidden Divergence or Divergence
Symbols on chart show Premium and Discount Prices
X-Cross - show potential reversal trend with weak volume .
O-circle - show potential reversal trend with strong volume .
Setting
Momentum: RSI = 25 , RSI MA = 14
Trend: Rolling VWAP and ATR and Subhag
Trailing STOP: ATR 12 x 2.4
Highlight Bars color when volume is above SMA 6
SMA200 act as TP Line
Risk:Reward Calculation
if Buy your Stoploss will be previous Pivot low
if Sell your Stoploss will be previous Pivot high and will be calculated form there, then show TP in Orange color line
VXD เป็นระบบเทรดที่ผมทดลองเอาหลาย ๆ ไอเดีย ทั้งจาก Youtube facebook และกลุ่มคนต่าง ๆ มารวบรวมไว้ แล้วตกผลึกขึ้นมาเป็นระบบนี้ ใน Timeframe ใหญ่ ๆ สามารถลากได้ทั้ง Cycle กันเลย
Trend lines
-ใช้ Rolling VWAP ของแอพ Tradingview (สามารถตั้งแค่าเป็น EMA ได้)
ATR
-ใช้ค่า ATR 12 Mutiplier 2.4
Pivot point and Rejected Block
Pivot โชว์เส้น High low และมีผลกับออเดอร์ หากแท่งเทียนปิดทะลุเส้นนี้
Rejected Block วาดแนวรับ-ต้าน อัตโนมัติ ใช้ประกอบ RSI ว่ามี Divergence หรือไม่
สัญลักษณ์ต่าง ๆ
X-Cross - แท่งกลืนกิน วอลุ่มน้อย
O-circle - แท่งกลืนกิน มีวอลุ่ม
Setting
Momentum: RSI = 25 , RSI MA = 14
Trend: Rolling VWAP and ATR and Subhag
Trailing STOP: ATR 12 x 2.4
Highlight Bars color when volume is above SMA 6
SMA200 act as TP Line
Risk:Reward Calculation
หาก Buy จุด SL จะอยู่ที่ Pivot low
หาก Sell จุด SL จะอยู่ที่ Pivot high และระบบจะคำนวณจากตรงนั้น จากนั้นแสดงเป็นเส้น TP สีส้ม
This Strategy Combined the following indicators and conditioning by me
ATR , RSI , EMA , SMA
Rolling VWAP - /script/ZU2UUu9T-Rolling-VWAP/
Regression Lines - Subhag form Subhag Ghosh /script/LHHBVpQu-Subhag-Ghosh-Algo-Version-for-banknifty/
Rejection Block , Pivots , High Volume Bars and PPDD form Super OrderBlock / FVG / BoS Tools by makuchaku & eFe /script/aZACDmTC-Super-OrderBlock-FVG-BoS-Tools-by-makuchaku-eFe/
ขอให้รวยครับ.

Short Selling EMA Cross (By Coinrule)BINANCE:AVAXUSDT
This short selling script works best in periods of downtrends and general bearish market conditions, with the ultimate goal to sell as the the price decreases further and buy back before a rebound.
This script can work well on coins you are planning to hodl for long-term and works especially well whilst using an automated bot that can execute your trades for you. It allows you to hedge your investment by allocating a % of your coins to trade with, whilst not risking your entire holding. This mitigates unrealised losses from hodling as it provides additional cash from the profits made. You can then choose to to hodl this cash, or use it to reinvest when the market reaches attractive buying levels.
Entry
The exponential moving average ( EMA ) 20 and EMA 50 have been used for the variables determining the entry to the short. EMAs can operate better than simple moving averages due to the additional weighting placed on the most recent data points, whereas simple moving averages weight all the data the same. This means that price is tracked more closely and the most recent volatile moves can be captured and exploited more efficiently using EMAs.
Our backtesting data revealed that the most profitable timeframe was the 30-minute timeframe, this also enabled a good frequency of trades and high profitability.
A fast (shorter term) exponential moving average , in this strategy the EMA 20, crossing under a slow (longer term) moving average, in this example the EMA 50, signals the price of an asset has started to trend to the downside, as the most recent data signals price is declining compared to earlier data. The entry acts on this principle and executes when the EMA 20 crosses under the EMA 50.
Enter Short: EMA 20 crosses under EMA 50.
Exit
This script utilises a take profit and stop loss for the exit. The take profit is set at -8% and the stop loss is set at +16% from the entry price. This would normally be a poor trade due to the risk:reward equalling 0.5. However, when looking at the backtesting data, the high profitability of the strategy (93.33%) leads to increased confidence and showcases the high probability of success according to historical data.
The take profit (-8%) and the stop loss (+16%) of the strategy are widely placed to ensure the move is captured without being stopped out due to relief rallies. The stop loss also plays a role of mitigating losses and minimising risk of being stuck in a short position once there has been a fundamental trend reversal and the market has become bullish .
Exit Short: -8% price decrease from entry price.
OR
Exit Short: +16% price increase from entry price.
Tip: Research what coins have consistent and large token unlocks / highly inflationary tokenomics, and target these during bear markets to short as they will most likely have substantial selling pressure that outweighs demand - leading to declining prices.
The strategy assumes each order is using 30% of the available coins to make the results more realistic and to simulate you only ran this strategy on 30% of your holdings. A trading fee of 0.1% is also taken into account and is aligned to the base fee applied on Binance.
The backtesting data was recorded from December 1st 2021, just as the market was beginning its downtrend. We therefore recommend analysing the market conditions prior to utilising this strategy as it operates best on weak coins during downtrends and bearish conditions.

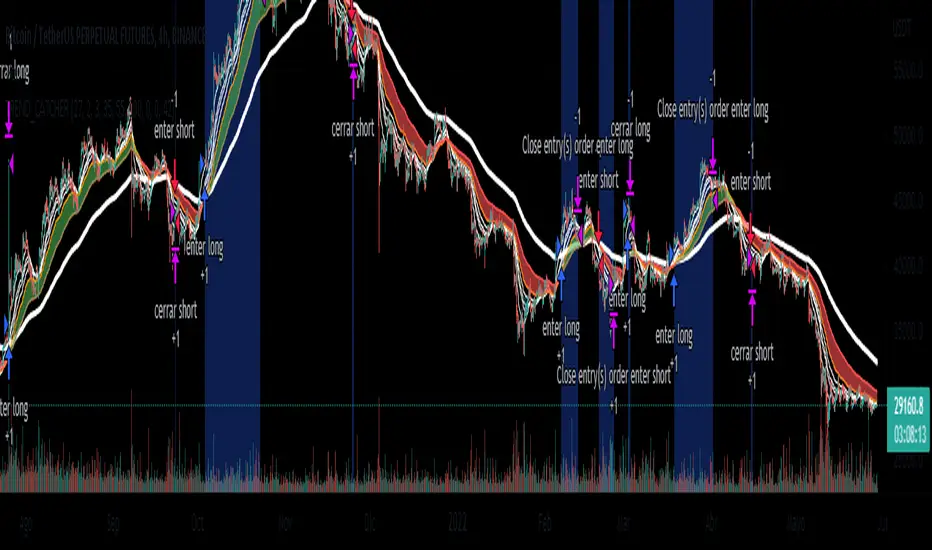
EMA_TREND_CATCHERSimple strategy based on the crossing of moving averages of 50,100 and 200 periods. Designed to identify trends
You are ready to use trading bots (all you have to do is fill in "Variables for Alert"). However, it can also be used for discretionary operations.
BTCUSDT FUTURES BINANCE
4H
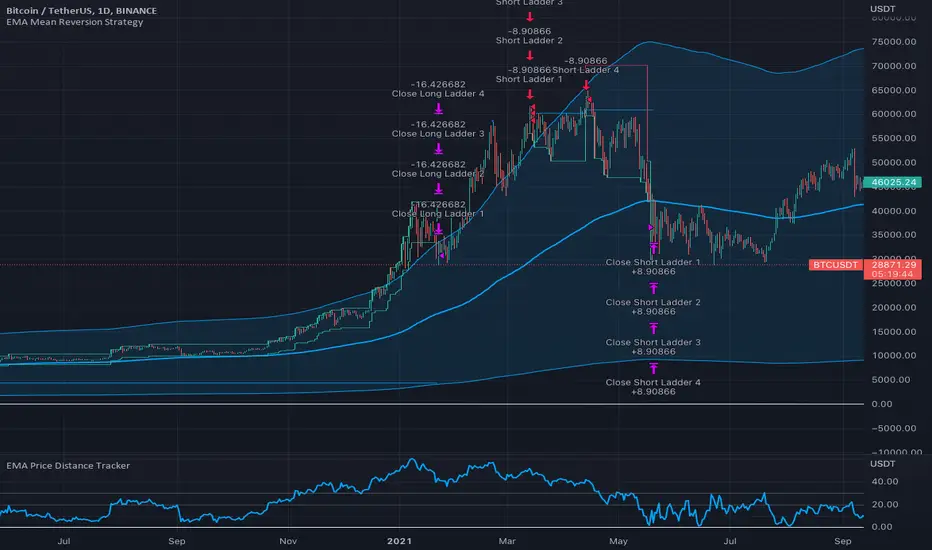
EMA Mean Reversion StrategyThis strategy is built on the simple idea that when the price gets far enough away from an EMA, it's bound to reverse. This strategy uses the percent distance the price is from the EMA to trigger ladder orders and sells when the price crosses a trailing stop. This strategy uses the EMA Price Distance Tracker indicator .
Three EMAs Trend-following Strategy (by Coinrule)Trend-following strategies are great because they give you the peace of mind that you're trading in line with the market.
However, by definition, you're always following. That means you're always a bit later than your want to be. The main challenges such strategies face are:
Confirming that there is a trend
Following the trend, hopefully, early enough to catch the majority of the move
Hopping off the trade when it seems to have run its course
This EMA Trend-following strategy attempts to address such challenges while allowing for a dynamic stop loss.
ENTRY
The trading system requires three crossovers on the same candle to confirm that a new trend is beginning:
Price crossing over EMA 7
Price crossing over EMA 14
Price crossing over EMA 21
The first benefit of using all three crossovers is to reduce false signals. The second benefit is that you know that a strong trend is likely to develop relatively soon, with the help of the fast setup of the three EMAs.
EXIT
The strategy comes with a fixed take profit and a volatility stop, which acts as a trailing stop to adapt to the trend's strength. That helps you get out of the way as soon as market conditions change. Depending on your long-term confidence in the asset, you can edit the fixed take profit to be more conservative or aggressive.
The position is closed when:
The price increases by 4%
The price crosses below the volatility stop.
The best time frame for this strategy based on our backtest is the 4-hr. Shorter timeframes can also work well, although they exhibit larger volatility in their returns. In general, this approach suits medium timeframes. A trading fee of 0.1% is taken into account. The fee is aligned to the base fee applied on Binance, which is the largest cryptocurrency exchange.

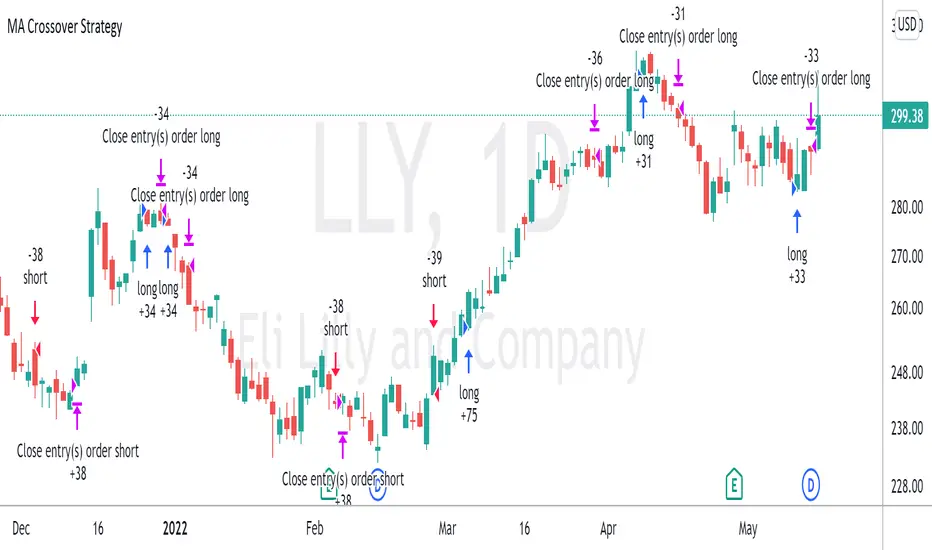
Moving Average Crossover StrategyThe Moving Average Crossover indicator uses 3 moving averages (2 simple moving averages and 1 exponential moving average ) to signal long and short opportunities based on moving average crossovers. This strategy serves as a backtest to that indicator. By taking entry and exit positions based on moving average crossovers, we are able to project profit with this script. You are given the option to select which moving average crossings trigger entry and exit signals. Fast refers to an EMA which should be your shortest MA. Slow refers to the first SMA which will serve as a signal line. Trend refers to a long SMA which will help determine if you should take long positions or short. You can also filter by extra conditions such as minimum volume or RSI. For example, you may have the script trigger a buy signal if the 5ema crosses the 20 sma while RSI reads 60 and sell if it crosses again.
This strategy starts with $100,000 and uses 10% of the account per trade.

Bitcoin trend RVI and Emastrategy with two emas and rvi.
Only long positions when fast ema above slow ema when rvi gives entry.
Only short positions when slow ema above fast ema when rvi gives entry.

Dillon's Double VWAP StrategyThis is based on Dillon's double VWAP strategy.
I enters when the ADX is low (aka not a trending market) and it's not close to the VWAP reset. Check it out.

5 Minute EMA Cross StrategyThis simple Fast/Slow EMA cross strategy is designed to be used with Alertatron to place limit orders and use a trailing stop/take profit.
Features:
Indicators when the fast EMA crosses the slow EMA
Trailing Stop/Take Profit
Bar look back for placing limit order
Macro EMA filter to only trade with the macro trend
Big Snapper Alerts R3.0 + Chaiking Volatility condition + TP RSI//@version=5
//
// Bannos
// #NotTradingAdvice #DYOR
// Disclaimer.
// I AM NOT A FINANCIAL ADVISOR.
// THESE IDEAS ARE NOT ADVICE AND ARE FOR EDUCATION PURPOSES ONLY.
// ALWAYS DO YOUR OWN RESEARCH
//
// Author: Adaptation from JustUncleL Big Snapper by Bannos
// Date: May-2022
// Version: R1.0
//Description of this addon - Script using several new conditions to give Long/short and SL levels which was not proposed in the Big Snapper strategy "Big Snapper Alerts R3.0"
//"
//This strategy is based on the use of the Big Snapper outputs from the JustUncleL script and the addition of several conditions to define filtered conditions selecting signal synchrones with a trend and a rise of the volatility.
//Also the strategy proposes to define proportional stop losses and dynamic Take profit using an RSI strategy.
// After delivering the temporary ong/short signal and ploting a green or purple signal, several conditions are defined to consider a Signal is Long or short.
//Let s take the long signal as example(this is the same process with the opposite values for a short).
//step 1 - Long Definition:
// Snapper long signal stored in the buffer variable Longbuffer to say that in a close future, we could have all conditions for a long
// Now we need some conditions to combine with it:
//the second one is to be over the Ma_medium(55)
//and because this is not selective enough, the third one is a Volatility indicator "Chaikin Volatility" indicator giving an indication about the volatility of the price compared to the 10 last values
// -> Using the volatility indicator gives the possibility to increase the potential rise if the volatility is higher compared to the last periods.
//With these 3 signals, we get a robust indication about a potential long signal which is then stored in the variable "Longe"
//Now we have a long signal and can give a long signal with its Stop Loss
// The Long Signal is automatically given as the 3 conditions above are satisfied.
// The Stop loss is a function of the last Candle sizes giving a stop below the 70% of the overall candle which can be assimilated to a Fibonacci level. Below this level it makes sense to stop the trade as the chance to recover the complete Candle is more than 60%
//Now we are in an open Long and can use all the mentioned Stop loss condition but still need a Take Profit condition
//The take profit condition is based on a RSI strategy consisting in taking profit as soon as the RSI come back from the overbought area (which is here defined as a rsi over 70) and reaching the 63.5 level to trigger the Take Profit
//This TP condition is only active when Long is active and when an entry value as been defined.
//Entry and SL level appreas as soon as a Long or short arrow signal does appears. The Take profit will be conidtioned to the RSI.
//The final step in the cycle is a reinitialization of all the values giving the possibility to detect and treat any long new signal coming from the Big Snapper signal.

Solution Zigma - Fibonacci Impulse'Solution Zigma' is strategy for any securities because this strategy use EMA of Fibonacci Level and Plot Like candle easy for analysis trend impulse. This strategy used DMI(ADX) for filter sideway but not greatest indicator, Please use this strategy with Risk Management.
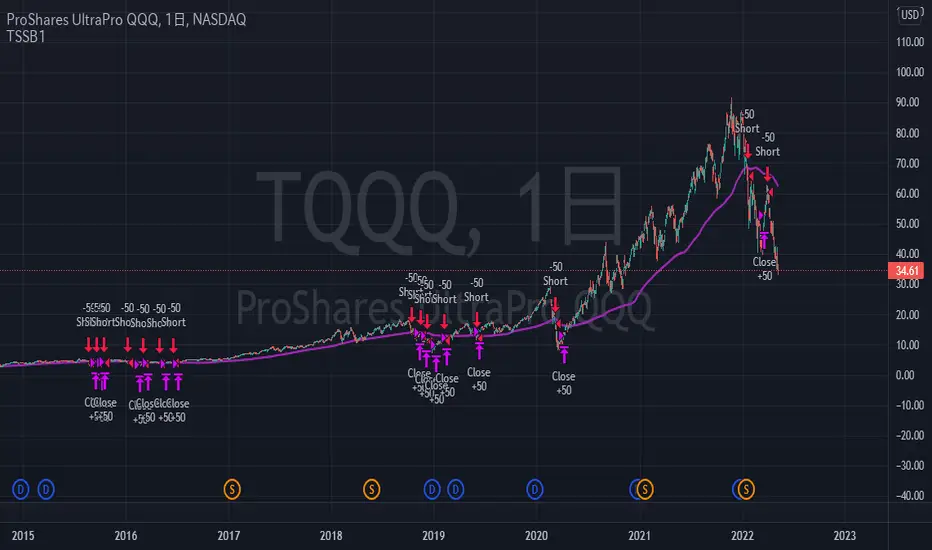
TriautoETF(TQQQ) Short Strategy B1○ Objective.
This is a strategy for the TQQQ NASDAQ:TQQQ short strategy in the TriAuto ETF .
It is used as a hedging short rather than for profit-making purposes.
Entry and close points are indicated.
○ Strategy
The strategy is to hold a short position when the price falls below the moving average line, which is a market-conscious line that is rarely broken.
The close (settlement) is determined by using the moving average.
The moving average is based on the market-conscious QQQ NASDAQ:QQQ .
This script is used on the daily chart of the TQQQ.
It works as a hedge for long positions because open interest is held even at the major bottoms of the China and Corona shocks.
The system is set up to quickly cut its losses even if the moving average is "tricked" into falling below the moving average.