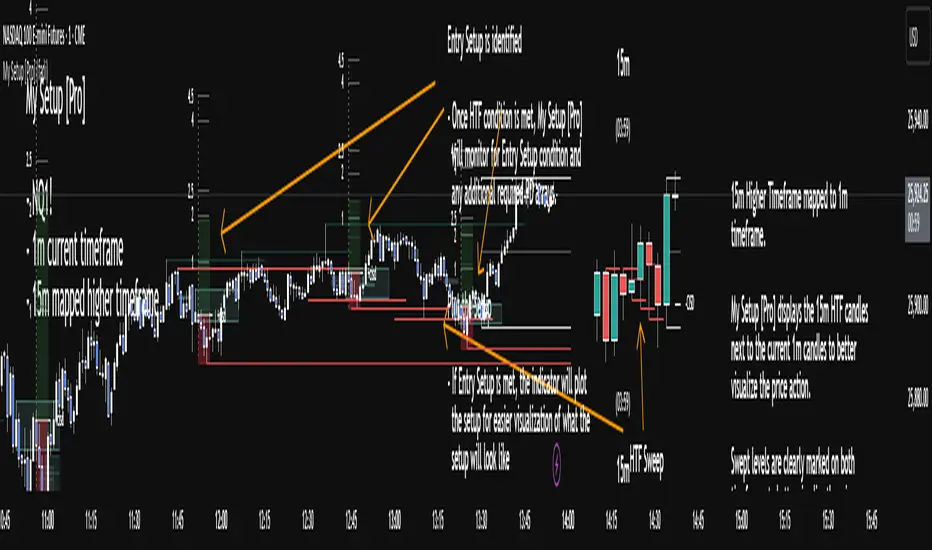
My setup [Pro] (fadi)My Setup is a powerful TradingView indicator that visualizes your trading strategy, helping you find high-probability setups with precision and discipline. It combines Higher Timeframe (HTF) context with Lower Timeframe (LTF) entries on a single chart, streamlining your trading process.
What It Does
Tracks your chosen timeframe and its paired higher timeframe for custom trade setups, so you don’t have to stay glued to the screen.
Plots clear Entry, Stop Loss, and Take Profit levels when your conditions align.
Customizes to your strategy with HTF triggers (e.g., sweeps, liquidity grabs) and LTF entries (e.g., Order Blocks, FVGs, Breakers).
Ensures discipline by only showing setups that meet all your rules, eliminating emotional trading and FOMO.
Backtest your edge by visualizing past setups to refine entries, stops, and confluences.
How It Works
Set Your HTF Trigger: Choose a market event like a sweep of a high/low, pivot point, or liquidity grab on the paired higher timeframe (e.g., 1H for a 5m chart).
Define Your LTF Entry: Select your entry model from a range of institutional concepts, such as Order Block, Fair Value Gap (FVG), Inverted FVG (iFVG), Breaker Block, Unicorn Model, and more, on the chart’s timeframe.
Add Confluence Filters: Stack conditions like requiring an FVG + Breaker for higher-probability setups.
See It on Your Chart: When a setup forms, it’s instantly plotted with Entry, Stop Loss, and Take Profit levels based on your Risk-to-Reward ratio.
Key Features
Multi-Timeframe Sync: Pair your chart’s timeframe (e.g., 5m) with a higher timeframe (e.g., 1H) for seamless analysis.
Institutional Tools: Supports a comprehensive suite of ICT concepts, including Order Blocks, FVGs, iFVGs, Breakers, Unicorn Model, and additional entry models.
Custom Risk Management: Set your Stop Loss and Take Profit levels with fixed R:R or measured moves using large range of entry and stop levels.
Session Filtering: Limit setups to specific trading sessions (e.g., London, New York) with timezone support.
Visual Clarity: Displays HTF candles and key levels on your chart for context, with customizable colors and styles.
Alerts: Get notified the moment a valid setup appears, even on live candles.
Who It’s For
Traders who want to systematize their ICT-based strategy on a single chart.
Those seeking to trade with discipline and avoid impulsive decisions.
Anyone looking to backtest and optimize their setups with clear, visual feedback.
Busy traders who need a tool to track their chart while they focus on life.
Why Choose My Setup ?
Save Time: Let the indicator track your chart and its paired timeframe.
Trade Confidently: Only take A+ setups that match your exact rules.
Learn and Improve: Analyze historical setups to refine your strategy.
Disclaimer of Warranties and Limitation of Liability for [My Setup ]
Please read this disclaimer carefully before using the [My Setup ] indicator (hereafter referred to as "the Software").
1. No Financial Advice
The Software is provided for educational and informational purposes only. The data, calculations, and signals generated by the Software are not, and should not be interpreted as, financial advice, investment advice, trading advice, or a recommendation or solicitation to buy, sell, or hold any security or financial instrument.
2. Assumption of Risk You acknowledge that trading and investing are inherently risky activities that carry a high potential for significant financial loss. All actions you take in the market, including but not limited to trade execution and risk management, are your sole responsibility. You agree to use the Software at your own sole risk. The creator shall not be held responsible or liable for any financial losses or damages you may incur as a result of using the Software.
3. No Warranty; "AS IS" Provision
The Software is provided "AS IS" and "AS AVAILABLE", without any warranties of any kind, either express or implied. The creator disclaims all warranties, including, but not limited to, implied warranties of merchantability, fitness for a particular purpose, accuracy, timeliness, completeness, and non-infringement.
The creator does not warrant that the Software will be error-free, uninterrupted, secure, or free of bugs, viruses, or other harmful components. You acknowledge that software is never wholly free from defects, and you are responsible for implementing your own procedures for data accuracy and security.
4. Limitation of Liability
TO THE MAXIMUM EXTENT PERMITTED BY APPLICABLE LAW, IN NO EVENT SHALL THE CREATOR, FADI ZEIDAN, BE LIABLE FOR ANY CLAIM, DAMAGES, OR OTHER LIABILITY, WHETHER IN AN ACTION OF CONTRACT, TORT, OR OTHERWISE, ARISING FROM, OUT OF, OR IN CONNECTION WITH THE SOFTWARE OR THE USE OR OTHER DEALINGS IN THE SOFTWARE.
This limitation of liability applies to any and all damages, including but not limited to:
Direct, indirect, incidental, special, consequential, or exemplary damages.
Loss of profits, revenue, data, or use.
Financial losses resulting from trading decisions made based on the Software.
Damages arising from software defects, interruptions, or inaccuracies.
5. Indemnification
You agree to indemnify, defend, and hold harmless the creator, Fadi Zeidan, from and against any and all claims, liabilities, damages, losses, or expenses, including reasonable attorneys' fees and costs, arising out of or in any way connected with your access to or use of the Software.
6. Acknowledgment and Agreement
By accessing, installing, or using the [My Setup ] indicator, you acknowledge that you have read, understood, and agree to be bound by the terms of this disclaimer. If you do not agree with these terms, you must not use the Software.
Entrypoint
Silent Trigger Silent Trigger combines widely used concepts under one scoring engine. Each module adds weight only when its conditions are met:
1. Higher-Timeframe (HTF) context
• Requests 1H and the next HTF up (e.g., 4H/D) with request.security(...) on confirmed bars only.
• Uses RSI(14) and a MACD line (EMA12–EMA26 difference) for bias.
• By default HTF weights the score. There is an option to require HTF alignment if you prefer a hard filter.
2. Market regime
• ADX for trend strength.
• Bollinger Band width and a fractal-energy proxy to detect squeeze/coiling vs expansion.
3. Smart-money / Wyckoff structure
• High-volume narrow bars, absorption, spring/upthrust, and liquidity grabs past recent swing highs/lows.
4. Momentum & divergences
• RSI and MACD-line divergences (regular + hidden) and simple exhaustion checks.
5. Fair Value Gaps (FVG)
• 3-bar gap with mid-gap revisit confirmation.
6. Volume context
• Relative volume and a compact 10-bin rolling volume profile to locate HVN proximity.
7. Sessions / time filter
• Optional London/NY “kill zone” participation filter.
8. Correlation (optional)
• Simple BTC trend check for USD-quoted markets.
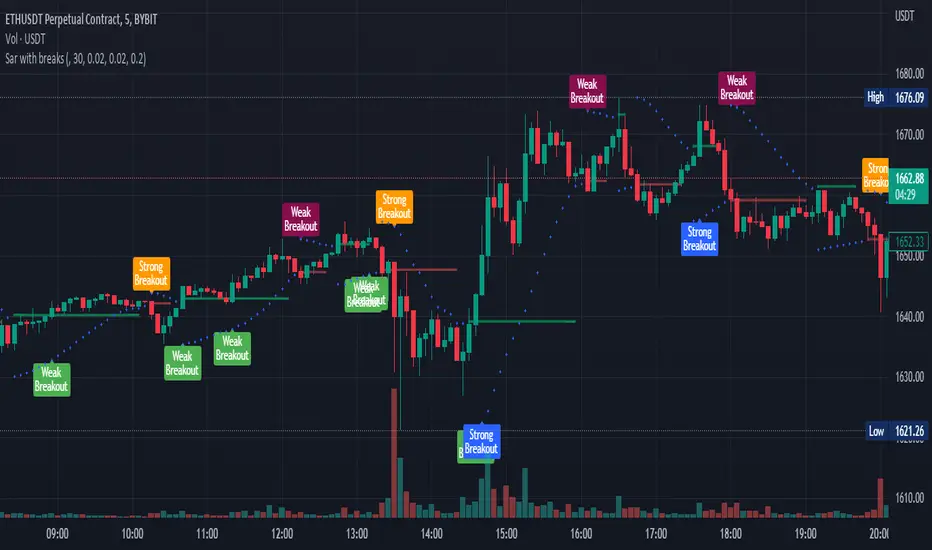
Pre-Move (yellow) logic:
Triggers only when the market is compressed (squeeze/low fractal energy), ADX is rising, the MACD histogram is near zero (pressure building), and there is a money-flow impulse (MFI slope and/or OBV Z-score spike).
The yellow diamond is plotted on the side of the expected move:
• Below for bullish reversals / Above for bullish breakouts.
• Above for bearish reversals / Below for bearish breakouts.
A built-in cooldown keeps yellows from spamming.
⸻
What appears on the chart
• Bull diamond (green): Total score ≥ your threshold and > bear score.
• Bear diamond (magenta): Mirror of the above.
• Pre-move (yellow): Early heads-up; use it with HTF context and structure.
All diamonds are intentionally tiny to minimize clutter.
⸻
Key settings
• Signal Mode & Min Probability – tighten/loosen confirmations.
• Use Higher TF in Scoring – soft weighting (default).
• Require HTF Alignment – optional hard gate.
• Module toggles – Smart Money, Wyckoff, FVG, Correlation, Sessions.
• Pre-Move – enable, cooldown bars, MFI levels, OBV Z-score threshold.
⸻
How to use (practical)
1. Choose a TF that matches your style (5–15m intraday, 1H–4H swing).
2. Read HTF bias first; trade in that direction unless structure clearly supports a reversal.
3. Treat yellow as “get ready.” Act only when a green/magenta prints with structure (S/R, FVG, HVN) and acceptable risk.
4. Place stops beyond the liquidity level or FVG midpoint; size positions conservatively.
⸻
Repainting & HTF policy
• No lookahead is used anywhere.
• request.security is called on confirmed bars; the HTF MACD line is computed inside the HTF context (single series), not by indexing a tuple.
• Signals are designed for bar-close confirmation. Intra-bar alerts can change until the bar closes.
⸻
Limitations (honest)
• Money-flow features depend on volume quality; thin/synthetic volume reduces reliability.
• Pre-moves can fail during unscheduled news shocks or when HTF trend is dominant.
• This is not financial advice. You are responsible for entries, exits, and risk.
⸻
Alerts
Built-in bull/bear alerts include direction and a probability bucket (Basic/Moderate/Strong/Extreme).
Pre-move yellows are primarily visual; you can still set an alert on their plot condition if desired.
⸻
Why this isn’t a “mashup”
• A single probability engine blends HTF bias, structure (liquidity/Wyckoff/FVG), regime, and volume into a score, rather than stacking unrelated indicators.
• A pre-move detector that requires compression + rising trend energy + money-flow impulse, and places the marker on the side of the expected move, with cooldown control.
• A lightweight rolling HVN check to bias continuation vs mean-reversion near key nodes.
⸻
Changelog (summary)
• Current release: pre-move module, HTF hard-gate option, tiny diamonds, clarified HTF/no-repaint policy, session filter tidy-up.

Signalgo CHoCHSignalgo CHoCH: Informative Technical Overview
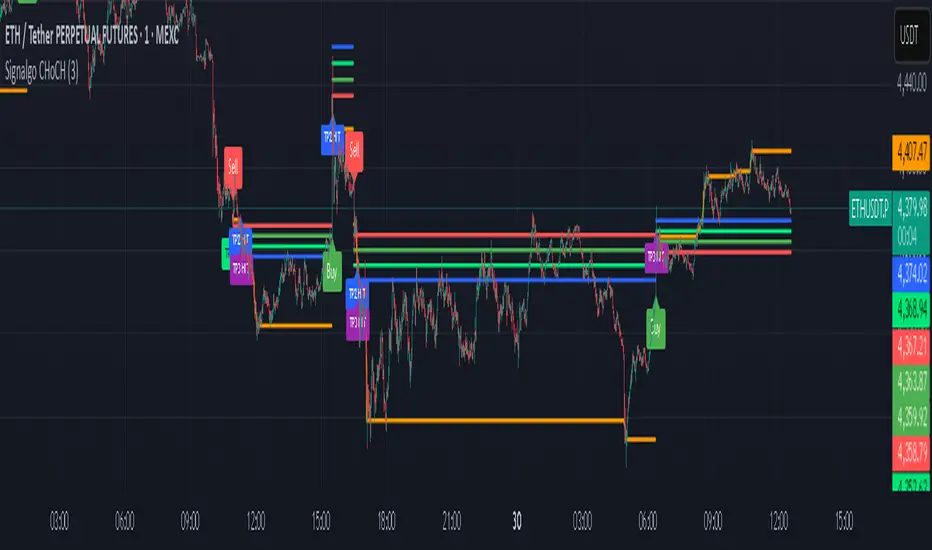
Signalgo CHoCH is a multi-factor indicator designed for TradingView to detect “Change of Character” (CHoCH) shifts in market structure, signaling significant trend reversals and managing trades with risk control. This documentation details how it operates, its customizable parameters, signal methodology, what makes it different from traditional tools, and typical strategy applications.
How Signalgo CHoCH Works
1. Market Structure Detection
Swing High & Low Identification: The indicator uses an adaptive swing length to isolate important pivot highs and lows in price action. These pivots signal points where the market reversed direction or paused, forming the “swing structure” core to this strategy.
Body Strength Validation: Not every pivot break is meaningful. Signalgo CHoCH assesses price bar “body strength”—quantifying if the current candle’s body is disproportionately large compared to a recent average—to filter out weak or indecisive moves, retaining only those breaks likely to indicate genuine momentum.
2. Change of Character (CHoCH) Signal Logic
Bullish CHoCH: Triggered when price closes above the last significant swing low (the most recent support) with a strong candle body, indicating a transition from bearish to bullish market structure.
Bearish CHoCH: Triggered when price closes below the last significant swing high (key resistance) with a strong bearish candle, denoting a shift from bullish to bearish structure.
One-Time Event Recognition: Each break is tracked so that signals are issued only once per directional change, reducing repeated or redundant entries.
3. Higher Timeframe Confirmation
Multi-Timeframe Consistency: The indicator requires the CHoCH signal (on the current trading timeframe) to be confirmed by the market structure status of a selected higher timeframe. This adds an extra layer of validation, ensuring the signal aligns with broader trends.
Inputs
SwingLen: The number of bars used to define swing pivots.
bodyStrength & bodyLookback: Control sensitivity for body size validation, filtering which candle breaks are considered strong enough for signaling.
htfTf: Selects the higher timeframe for multi-timeframe checking.
show_tpsl: Toggle to show/hide automated Take Profit (TP) and Stop Loss (SL) levels on the chart.
ATR, TP/SL/RR/Trailing Settings: Determines how risk and reward are managed, using ATR for stop placement and multi-level profit targets with optional trailing stop activation after TP1.
Entry & Exit Strategy
Entry Logic
Long Entry: When a bullish CHoCH is detected, optionally confirmed by the higher timeframe, it marks a buy opportunity at the close of the breakout candle.
Short Entry: When a bearish CHoCH forms, also with optional higher timeframe confirmation, it identifies a sell entry at the close of the confirmation candle.
Exit & Trade Management
Stop Loss (SL): Automatically placed at a set ATR distance from entry, dynamically adapting to volatility.
Take Profits (TP1, TP2, TP3): Multiple reward targets are calculated and marked for systematic scaling out or profit-taking, based on a defined risk multiple.
Trailing Stop: Once the first profit target is hit, SL moves to breakeven, and a trailing stop engages, incrementally securing further gains if the trend continues.
State Tracking: All TP, SL, and trailing events are labeled on the chart for easy post-trade analysis.
Body Strength and Trend Filtering: Breakouts are only considered if the candle’s body confirms significant momentum, not just a fleeting spike, improving signal quality.
Event-Driven, Not Rolling: Each bullish or bearish “character change” is signaled only at the true point of structural shift, with strict per-event marking, not continuous signal generation as with typical MA cross strategies.
Integrated Multi-Timeframe Logic: higher timeframe validation minimizes false positives from short-term volatility noise, a capability not found in most indicator-based tools.
Automated, Dynamic Trade Management: This indicator overlays a complete trade management suite (TPs, SL, trailing) that moves with market conditions, allowing for risk handling directly from each signal.
Trading Strategy Application
Trend Reversal & Continuation: Suitable for identifying both sudden reversals and structural continuations, adaptable for intraday, swing, or positional trading styles.
Noise Filtering: Multiple checks (body strength, momentum, multi-timeframe) focus signals on genuine trend changes, filtering out most “whipsaws” seen in pure MA systems.
Visual Feedback: All transitions, TPs, SLs, and trailing events are visually annotated, enhancing the educational and review process.
Signalgo VSignalgo V: Technical Overview and Unique Aspects
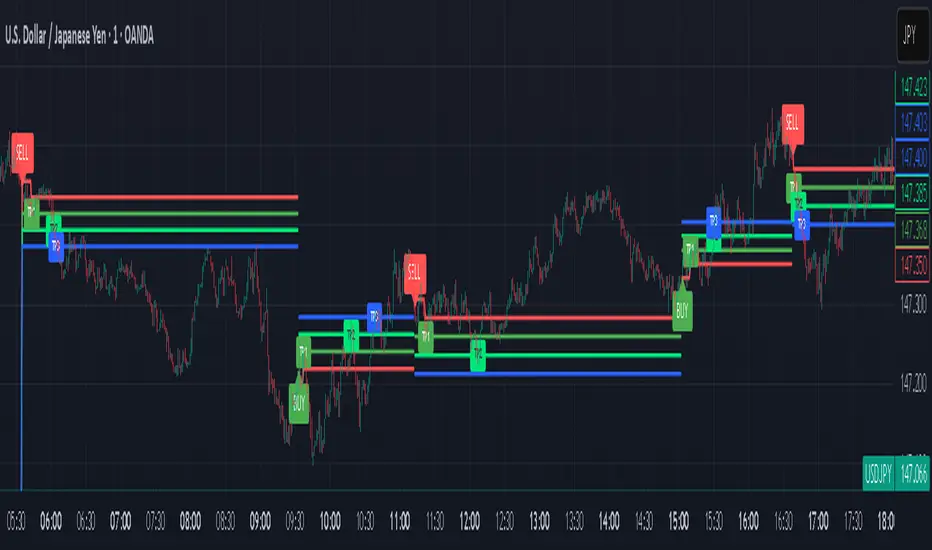
Signalgo V is a technical indicator for TradingView that integrates multiple layers of analysis: moving averages, MACD, Bollinger Bands and RSI to deliver buy and sell signals. Below is an informational breakdown of how the indicator functions, its input parameters, signal logic, exit methodology, and how it stands apart from traditional moving average (MA) tools, without disclosing specifics that allow for code duplication.
How Signalgo V Works
1. Multi-Layered Technical Synthesis
Signalgo V processes several technical studies simultaneously:
Fast/Slow Moving Averages: Uses either EMA or SMA (user-selected) with adjustable periods. These are central to initial trend detection through crossovers.
MACD Filter: MACD line vs. signal line cross-check ensures trend direction is supported by both momentum and MA structure.
RSI Confirmation: The RSI is monitored to verify that signals are not excessively overbought or oversold, tuning the system to changing momentum regimes.
Bollinger Bands Context: Entry signals are only considered when price action is beyond the Bollinger Bands envelope, which further filters for unusually strong movements.
These strict, multi-indicator entry criteria are designed to ensure only the most robust signals are surfaced, each is contingent on the presence of aligned trend, momentum and volatility.
2. Exit Methodology
Take-Profit Levels: After entering a trade, the strategy automatically sets three predefined profit targets (TP1, TP2, TP3). If the price reaches any of these targets, the system marks it, helping you lock in profits at different stages.
Stop-Loss System: Simultaneously, a stop-loss (SL) value is set, protecting you from significant losses if the market moves against your position.
Dynamic Adjustment: When the first profit target (TP1) is hit, the system can automatically move the stop-loss to your entry price. This means your worst-case outcome is break-even from that point, reducing downside risk.
Trailing Stop-Loss: After TP1 is reached, a dynamic trailing stop can activate. This allows the stop-loss to follow the price as it moves in your favor, aiming to capture more profit if the trend continues, while still protecting your gains if the price reverses.
Visual Markers: The system plots all important exit levels (profit targets, stop-loss, trailing stop) directly on the chart. Optional labels also appear whenever a target or stop-loss is hit, making it easy to see progress.
Visual cues (labels) are plotted directly on the bar where a buy or sell signal triggers, clarifying entry points and aiding manual exit/risk management decisions.
Input Parameters
rsiLen: Lookback period for RSI calculation.
rsiOB and rsiOS: Overbought/oversold thresholds, adaptive to the indicator’s multi-layered logic.
maFastLen and maSlowLen: Periods for fast and slow MAs.
maType: EMA or SMA selectable for both MAs.
bbLen: Length for Bollinger Bands mean calculation.
bbMult: Standard deviation multiplier for BB width.
macdFast, macdSlow, macdSig: Standard MACD parameterization for nuanced momentum oversight.
What Separates Signalgo V from Traditional Moving Average Indicators
Composite Signal Architecture: Where traditional MA systems generate signals solely on MA crossovers, Signalgo V requires layered, cross-confirmational logic across trend (MAs), momentum (MACD), volatility (Bollinger Bands), and market strength (RSI).
Adaptive Volatility Context: MA signals only “count” when price is meaningfully breaking out of its volatility envelope, filtering out most unremarkable crosses that plague basic MA strategies.
Integrated Multi-Factor Filters: Strict compliance with all layers of signal logic is enforced. A marked improvement over MA strategies that lack secondary or tertiary confirmation.
Non-Redundant Event Limiting: Each entry is labeled as a unique event. The indicator does not repeat signals on subsequent bars unless all entry conditions are freshly met.
Trading Strategy Application
Trend Identification: By requiring concurrence among MA, MACD, RSI, and BB, this tool identifies only those trends with robust, multifactor support.
Breakout and Momentum Entry: Signals are bias-toward trades that initiate at likely breakout points (outside BB range), combined with fresh momentum and trend alignment.
Manual Discretion for Exits: The design is to empower traders with high-confidence entries and leave risk management or partial profit-taking adaptive to trader style, using visual cues from all component indicators.
Alert Generation: Each buy/sell event optionally triggers an alert, supporting systematic monitoring without constant chart watching.
Signalgo Strategy ISignalgo Strategy I: Technical Overview
Signalgo Strategy I is a systematically engineered TradingView strategy script designed to automate, test, and manage trend-following trades using multi-timeframe price/volume logic, volatility-based targets, and multi-layered exit management. This summary covers its operational structure, user inputs, entry and exit methodology, unique technical features, and practical application.
Core Logic and Workflow
Multi-Timeframe Data Synthesis
User-Defined Timeframe: The user chooses a timeframe (e.g., 1H, 4H, 1D, etc.), on which all strategy signals are based.
Cross-Timeframe Inputs: The strategy imports closing price, volume, and Average True Range (ATR) for the selected interval, independently from the chart’s native timeframe, enabling robust multi-timeframe analysis.
Price Change & Volume Ratio: It calculates the percent change of price per bar and computes a volume ratio by comparing current volume to its 20-bar moving average—enabling detection of true “event” moves vs. normal market noise.
Hype Filtering
Anti-Hype Mechanism: An entry is automatically filtered out if abnormal high volume occurs without corresponding price movement, commonly observed during manipulation or announcement periods. This helps isolate genuine market-driven momentum.
User Inputs
Select Timeframe: Choose which interval drives signal generation.
Backtest Start Date: Specify from which date historical signals are included in the strategy (for precise backtests).
Take-Profit/Stop-Loss Configuration: Internally, risk levels are set as multiples of ATR and allow for three discrete profit targets.
Entry Logic
Trade Signal Criteria:
Price change magnitude in the current bar must exceed a fixed sensitivity threshold.
Volume for the bar must be significantly elevated compared to average, indicating meaningful participation.
Anti-hype check must not be triggered.
Bullish/Bearish Determination: If all conditions are met and price change direction is positive, a long signal triggers. If negative, a short signal triggers.
Signal Debouncing: Ensures a signal triggers only when a new condition emerges, avoiding duplicate entries on flat or choppy bars.
State Management: The script tracks whether an active long or short is open to avoid overlapping entries and to facilitate clean reversals.
Exit Strategy
Take-Profits: Three distinct profit targets (TP1, TP2, TP3) are calculated as fixed multiples of the ATR-based stop loss, adapting dynamically to volatility.
Reversals: If a buy signal appears while a short is open (or vice versa), the existing trade is closed and reversed in a single step.
Time-Based Exit: If, 49 bars after entry, the trade is in-profit but hasn’t reached TP1, it exits to avoid stagnation risk.
Adverse Move Exit: The position is force-closed if it suffers a 10% reversal from entry, acting as a catastrophic stop.
Visual Feedback: Each TP/SL/exit is plotted as a clear, color-coded line on the chart; no hidden logic is used.
Alerts: Built-in TradingView alert conditions allow automated notification for both entries and strategic exits.
Distinguishing Features vs. Traditional MA Strategies
Event-Based, Not Just Slope-Based: While classic moving average strategies enter trades on MA crossovers or slope changes, Signalgo Strategy I demands high-magnitude price and volume confirmation on the chosen timeframe.
Volume Filtering: Very few MA strategies independently filter for meaningful volume spikes.
Real Market Event Focus: The anti-hype filter differentiates organic market trends from manipulated “high-volume, no-move” sessions.
Three-Layer Exit Logic: Instead of a single trailing stop or fixed RR, this script manages three profit targets, time-based closures, and hard adverse thresholds.
Multi-Timeframe, Not Chart-Dependent: The “main” analytical interval can be set independently from the current chart, allowing for in-depth cross-timeframe backtests and system runs.
Reversal Handling: Automatic handling of signal reversals closes and flips positions precisely, reducing slippage and manual error.
Persistent State Tracking: Maintains variables tracking entry price, trade status, and target/stop levels independently of chart context.
Trading Application
Strategy Sandbox: Designed for robust backtesting, allowing users to simulate performance across historical data for any major asset or interval.
Active Risk Management: Trades are consistently managed for both fixed interval “stall” and significant loss, not just via trailing stops or fixed-day closes.
Alert Driven: Can power algorithmic trading bots or notify discretionary traders the moment a qualifying market event occurs.

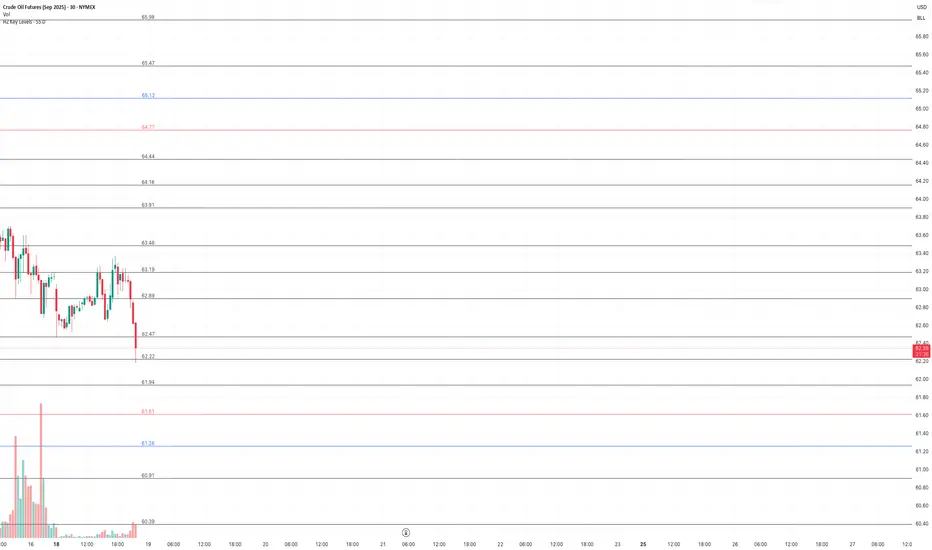
HZ Key LevelsThe HZ Key Levels script is a powerful tool designed to help traders identify sharp and precise entry and take profit levels on their charts. Utilizing a unique proprietary formula, this indicator provides a clear visual guide for strategic trading decisions. The levels are plotted as solid lines with corresponding price values, ensuring they remain relevant across different timeframes. Ideal for traders seeking reliable reference points to enhance their market analysis and execution precision.
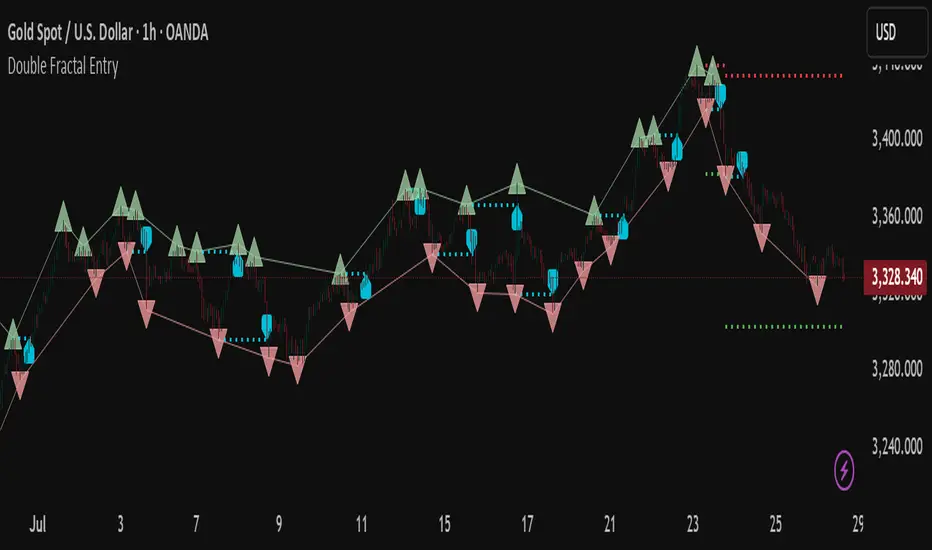
Double Fractal Entry📘 Double Fractal Entry – Original Structure-Based Entry System
Double Fractal Entry is a proprietary indicator that uses dynamic fractal structure to generate actionable buy/sell signals, with automatic Stop-Loss and Take-Profit placement. Unlike classic fractal tools or ZigZag-based visuals, this script constructs real-time structural channels from price extremes and offers precise entry points based on breakout or rejection behavior.
It is designed for traders who want a clear, structured approach to trading price action — without repainting, lagging indicators, or built-in oscillators.
🧠 Core Logic
This script combines three custom-built modules:
1. Fractal Detection and Channel Construction
- Fractals are detected using a configurable number of left/right bars (sensitivity).
- Confirmed upper/lower fractals are connected into two continuous channels.
- These channels represent real-time structure zones that evolve with price.
2. Entry Signal Logic
You can choose between two signal types:
- Breakout Mode – Triggers when price breaks above the upper fractal structure (for buys) or below the lower one (for sells).
- Rebound Mode – Triggers when price approaches a fractal channel and then rejects it (forms a reversal setup).
Each signal includes:
- Entry arrow on the chart
- Horizontal entry line
- Stop-Loss and Take-Profit lines
3. SL/TP Calculation
Unlike tools that use ATR or fixed values, SL and TP are dynamically set using the fractal range — the distance between the most recent upper and lower fractals. This makes the risk model adaptive to market volatility and structure.
📊 Visuals on the Chart
- 🔺 Green/Red triangle markers = confirmed fractals
- 📈 Lime/Red channel lines = evolving upper/lower structure
- 🔵 Blue arrow = signal direction (buy/sell)
- 📉 SL/TP lines = dynamically drawn based on fractal spacing
- 🔁 Signal history = optional, toggleable for backtesting
⚙️ Settings and Customization
- Fractal sensitivity (bars left/right)
- Entry mode: Breakout or Rebound
- SL and TP multiplier (based on fractal range)
- Visibility settings (signal history, lines, colors, etc.)
💡 What Makes It Unique
This is not just a variation of standard fractals or a ZigZag wrapper.
Double Fractal Entry was built entirely from scratch and includes:
- ✅ A dual-channel system that shows the live market structure
- ✅ Entry signals based on price behavior around key zones
- ✅ Volatility-adaptive SL/TP levels for realistic trade management
- ✅ Clean, non-repainting logic for both manual and automated use
The goal is to simplify structure trading and provide precise, repeatable entries in any market condition.
🧪 Use Cases
- Breakout mode – Ideal for trend continuation and momentum entries
- Rebound mode – Great for reversals, pullbacks, and range-bound markets
- Can be used standalone or combined with volume/trend filters
⚠️ Disclaimer
This tool is intended for technical analysis and educational use. It does not predict future market direction and should be used with proper risk management and strategy confirmation.

Double Fractal Entry📘 Double Fractal Entry – Original Structure-Based Entry System
Double Fractal Entry is a proprietary indicator that uses dynamic fractal structure to generate actionable buy/sell signals, with automatic Stop-Loss and Take-Profit placement. Unlike classic fractal tools or ZigZag-based visuals, this script constructs real-time structural channels from price extremes and offers precise entry points based on breakout or rejection behavior.
It is designed for traders who want a clear, structured approach to trading price action — without repainting, lagging indicators, or built-in oscillators.
🧠 Core Logic
This script combines three custom-built modules:
1. Fractal Detection and Channel Construction
- Fractals are detected using a configurable number of left/right bars (sensitivity).
- Confirmed upper/lower fractals are connected into two continuous channels.
- These channels represent real-time structure zones that evolve with price.
2. Entry Signal Logic
You can choose between two signal types:
- Breakout Mode – Triggers when price breaks above the upper fractal structure (for buys) or below the lower one (for sells).
- Rebound Mode – Triggers when price approaches a fractal channel and then rejects it (forms a reversal setup).
Each signal includes:
- Entry arrow on the chart
- Horizontal entry line
- Stop-Loss and Take-Profit lines
3. SL/TP Calculation
Unlike tools that use ATR or fixed values, SL and TP are dynamically set using the fractal range — the distance between the most recent upper and lower fractals. This makes the risk model adaptive to market volatility and structure.
📊 Visuals on the Chart
- 🔺 Green/Red triangle markers = confirmed fractals
- 📈 Lime/Red channel lines = evolving upper/lower structure
- 🔵 Blue arrow = signal direction (buy/sell)
- 📉 SL/TP lines = dynamically drawn based on fractal spacing
- 🔁 Signal history = optional, toggleable for backtesting
⚙️ Settings and Customization
- Fractal sensitivity (bars left/right)
- Entry mode: Breakout or Rebound
- SL and TP multiplier (based on fractal range)
- Visibility settings (signal history, lines, colors, etc.)
💡 What Makes It Unique
This is not just a variation of standard fractals or a ZigZag wrapper.
Double Fractal Entry was built entirely from scratch and includes:
- ✅ A dual-channel system that shows the live market structure
- ✅ Entry signals based on price behavior around key zones
- ✅ Volatility-adaptive SL/TP levels for realistic trade management
- ✅ Clean, non-repainting logic for both manual and automated use
The goal is to simplify structure trading and provide precise, repeatable entries in any market condition.
🧪 Use Cases
- Breakout mode – Ideal for trend continuation and momentum entries
- Rebound mode – Great for reversals, pullbacks, and range-bound markets
- Can be used standalone or combined with volume/trend filters
🔒 Invite-Only Notice
This is an invite-only script with a fully closed source.
All logic is original and developed by the author. It does not use or copy public open-source scripts, built-in indicators (RSI, MA, etc.), or repainting tricks. The entire entry and risk system is based on custom structural logic built from real-time price action.
⚠️ Disclaimer
This tool is intended for technical analysis and educational use. It does not predict future market direction and should be used with proper risk management and strategy confirmation.
Signalgo MASignalgo MA is a TradingView indicator based on moving average (MA) trading by combining multi-timeframe logic, trend strength filtering, and adaptive trade management. Here’s a deep dive into how it works, its features, and why it stands apart from traditional MA indicators.
How Signalgo MA Works
1. Multi-Timeframe Moving Average Analysis
Simultaneous EMA & SMA Tracking: Signalgo MA calculates exponential (EMA) and simple (SMA) moving averages across a wide range of timeframes—from 1 minute to 3 months.
Layered Cross Detection: It detects crossovers and crossunders on each timeframe, allowing for both micro and macro trend detection.
Synchronized Signal Mapping: Instead of acting on a single crossover, the indicator requires agreement across multiple timeframes to trigger signals, filtering out noise and false positives.
2. Trend Strength & Quality Filtering
ADX Trend Filter: Trades are only considered when the Average Directional Index (ADX) confirms a strong trend, ensuring signals are not triggered during choppy or directionless markets.
Volume & Momentum Confirmation: For the strongest signals, the system requires:
A significant volume spike
Price above/below a longer-term EMA (for buys/sells)
RSI momentum confirmation
One-Time Event Detection: Each crossover event is flagged only once per occurrence, preventing repeated signals from the same move.
Inputs
Preset Parameters:
EMA & SMA Lengths: Optimized for both short-term and long-term analysis.
ADX Length & Minimum: Sets the threshold for what is considered a “strong” trend.
Show Labels/Table: Visual toggles for displaying signal and trade management information.
Trade Management:
Show TP/SL Logic: Toggle to display or hide take-profit (TP) and stop-loss (SL) levels.
ATR Length & Multipliers: Fine-tune how SL and TP levels adapt to market volatility.
Enable Trailing Stop: Option to activate dynamic stop movement after TP1.
Entry & Exit Strategy
Entry Logic
Long (Buy) Entry: Triggered when multiple timeframes confirm bullish EMA/SMA crossovers, ADX confirms trend strength, and all volume/momentum filters align.
Short (Sell) Entry: Triggered when multiple timeframes confirm bearish crossunders, with the same strict filtering.
Exit & Trade Management
Stop Loss (SL): Automatically set based on recent volatility (ATR), adapting to current market conditions.
Take Profits (TP1, TP2, TP3): Three profit targets at increasing reward multiples, allowing for flexible trade management.
Trailing Stop: After TP1 is hit, the stop loss moves to breakeven and a trailing stop is activated to lock in further gains.
Event Markers: Each time a TP or SL is hit, a visual label is placed on the chart for full transparency.
Strict Signal Quality Filters: Signals are only generated when volume spikes, momentum, and trend strength all align, dramatically reducing false positives.
Adaptive, Automated Trade Management: Built-in TP/SL and trailing logic mean you get not just signals, but a full trade management suite, rarely found in standard MA indicators.
Event-Driven, Not Static: Each signal is triggered only once per event, eliminating repetitive or redundant entries.
Visual & Alert Integration: Every signal and trade event is visually marked and can trigger TradingView alerts, keeping you informed in real time.
Trading Strategy Application
Versatility: Suitable for scalping, day trading, swing trading, and longer-term positions thanks to its multi-timeframe logic.
Noise Reduction: The layered filtering logic means you only see the highest-probability setups, helping you avoid common MA “fakeouts” and overtrading.
So basically what separates Signalgo MA from traditional MA indicators?
1. Multi-Timeframe Analysis
Traditional MA indicators: Usually measure crossovers or signals within a single timeframe.
Signalgo MA: simultaneously calculates fast/slow EMAs & SMAs for multiple periods. This enables it to create signals based on synchronized or stacked momentum across multiple periods, offering broader trend confirmation and reducing noise from single-timeframe signals.
2. Combinatorial Signal Logic
Traditional: A basic crossover is typically “if fast MA crosses above/below slow MA, signal buy/sell.”
Signalgo MA: Generates signals only when MA crossovers align across several timeframes, plus takes into consideration the presence or absence of conflicting signals in shorter or longer frames. This reduces false positives and increases selectivity.
3. Trend Strength Filtering (ADX Integration)
Traditional: Many MA indicators are “blind” to trend intensity, potentially triggering signals in low volatility or ranging conditions.
Signalgo MA: Employs ADX as a minimum trend filter. Signals will only fire if the trend is sufficiently strong, reducing whipsaws in choppy or sideways markets.
4. Volume & Strict Confirmation Layer
Traditional: Few MA indicators directly consider volume or require confluence with other major indicators.
Signalgo MA: Introduces a “strict signal” filter that requires not only MA crossovers and trend strength, but also (on designated frames):
Significant volume spike,
Price positioned above/below a higher timeframe EMA (trend anchor),
RSI momentum confirmation.
5. Persistent, Multi-Level TP/SL Automated Trade Management
Traditional: Separate scripts or manual management for stop-loss, take-profit, and trailing-stops, rarely fully integrated visually.
Signalgo MA: Auto-plots up to three take-profit levels, initial stop, and a trailing stop (all ATR-based) on the chart. It also re-labels these as they are hit and resets for each new entry, supporting full trade lifecycle visualization directly on the chart.
6. Higher Timeframe SMA Crosses for Long-Term Context
Traditional: Focuses only on the current chart’s timeframe.
Signalgo MA: Incorporates SMA cross logic for weekly, monthly, and quarterly periods, which can contextualize lower timeframe trades within broader cycles, helping filter against counter-trend signals.
7. “Signal Once” Logic to Prevent Over-Trading
Traditional: Will often re-fire the same signal repeatedly as long as the condition is true, possibly resulting in signal clusters and over-trading.
Signalgo MA: Fires each signal only once per condition—prevents duplicate alerts for the same trade context.

Signalgo BBSignalgo BB: Technical Overview
Signalgo BB is a Bollinger Bands (BB) indicator for TradingView, designed to provide a multi-dimensional view of volatility, trend, and trading opportunities within a single overlay. Below is a detailed, impartial explanation of its workings, inputs, and trading logic.
Core Mechanics
Signalgo BB operates on the principle of nested volatility bands and moving averages. It calculates:
Fast & Slow Bands: Two sets of Bollinger Bands (BB), using different moving average types (EMA or SMA), lengths, and standard deviation multipliers.
Volatility Cloud: A dynamic visual layer indicating when price is inside both, one, or neither band.
Filtering: A short-term RSI is used to confirm trend direction and filter out weak signals.
Inputs & Components
MA Type: Choice between EMA, SMA for both fast and slow MA calculations.
Fast/Slow Lengths
Fast/Slow Deviations
RSI Length/Thresholds
Show Cloud: Toggle for the visual volatility cloud.
Signal Mode: Band Break.
Prevent Repeated Signals: Option to suppress duplicate signals in the same direction.
TP/SL & Trailing Logic: Advanced, automated trade management with ATR-based distances, three take-profit levels, and a dynamic trailing stop.
Signal Generation
Band Break: Triggers when price crosses the fast BB band.
RSI Filter: All signals require RSI confirmation.
Prevent Repeated Signals: Optionally only marks the first breakout in a series to reduce overtrading.
Entry/Exit Marks: Labels are plotted for visual clarity, and signals can trigger TradingView alerts.
Trade Management
Stop Loss (SL): Set at a multiple of ATR from the entry price, adapting to current volatility.
Take Profits (TP1, TP2, TP3): Three levels scaled by risk-reward ratios, supporting partial exits.
Trailing Stop: After the first TP is hit, SL moves to breakeven and then trails at a user-defined multiple of ATR, locking in further gains.
Event Markers: Each TP, SL, and trailing stop event is labeled on the chart.
Direction State: The indicator tracks active trades, allowing for only one open position per direction at a time.
Cloud Visualization: The background color changes depending on whether price is inside both, one, or no bands, making it easier to visualize market conditions.
Multiple Signal Logics: It doesn’t just look at breakouts, it includes cloud crossings, mean reversion, and a choice of how to combine them.
Rigorous Filtering: Signals require RSI trend confirmation, reducing false entries during weak phases.
Automated Trade Management: Built-in TP/SL and trailing logic, dynamically adapting to volatility.
Signal Suppression: Option to prevent repeated signals, reducing noise and overtrading.
Customizable MA Types: Supports EMA, SMA, and a selection algorithm for future expansion.
Trading Strategy Application
Volatility Regimes: The cloud’s color indicates whether price is inside, between, or outside the bands, helping traders identify trending, ranging, or breakout conditions.
Signals: entries can be based on breakouts filtered by RSI trend strength.
Risk Management: All active trades are managed by TP/SL logic, trailing stops after TP1, and visual feedback on exits.
Visual Alerts: Both signals and TP/SL events are marked on the chart for manual review.
Flexibility: Users can switch modes or suppress repeated signals as needed, depending on trading style.
Practical Usage
Intraday to Swing: Suitable for timeframes from minutes to days, depending on the MA periods and volatility profile.
Manual or Automated: The visual overlay and alerts support both manual trading and automated strategies.
Education & Review: The colored cloud and event markers make it easy to review past price action and learn from signals.
What separates this indicator from traditional ones:
1. Dual Bollinger Bands
Traditional: Most indicators use a single set of Bollinger Bands (two standard deviations above/below a moving average).
Signalgo BB: Implements two sets of bands—a "fast" set (shorter moving average, narrower deviation) and a "slow" set (longer moving average, wider deviation). This provides both immediate (fast) and broader context (slow) for volatility and price action.
2. Volatility Cloud Visualization
Traditional: Standard Bollinger Bands display as two lines, with the area between sometimes shaded as a "band" but without dynamic color changes.
Signalgo BB: The background is colored differently depending on whether price is within both, one, or neither band, offering a visual "cloud" that distinguishes trending, ranging, or breakout regimes at a glance.
3. RSI Filtering
Traditional: Many indicators either don’t filter signals, or if they do, it’s not always configurable.
Signalgo BB: Adds an optional RSI filter, requiring signals to be confirmed by short-term RSI overbought/oversold conditions. This reduces false signals in range-bound or low-trend environments.
4. Prevention of Repeated Signals
Traditional: Most indicators will keep firing signals as long as conditions are met, which can cause overtrading.
Signalgo BB: Offers a user-toggleable option to suppress repeated signals in the same direction until the opposite signal occurs. This reduces noise for discretionary traders.
5. Integrated Trade Management
Traditional: Manual or separate coding is required for stop-loss, take-profit, and trailing stop logic.
Signalgo BB: Builds in dynamic, ATR-based stop-loss; up to three take-profit levels and a trailing stop that activates after the first TP is hit. All levels are visually plotted on the chart, and events (TP/SL hits) are labeled, aiding strategy review and automation.
6. Event Labeling and Alerts
Traditional: Alerts may exist for entry/exit, but rarely for each TP/SL event.
Signalgo BB: Places labels for every entry, exit, and TP/SL event. It also provides TradingView alertconditions for each event, enabling automated notifications or integration with trading bots.
7. Directional State Tracking
Traditional: Indicators typically do not track the "state" of a trade (e.g., active long/short/flat) beyond simple signals.
Signalgo BB: Maintains persistent variables for entry price, SL, TP, trailing stop, and trade direction, ensuring only one active signal per direction. This prevents overlapping entries and mimics realistic trade management.
8. User Customization
Traditional: Default settings are often hardcoded, or customization is limited.
Signalgo BB: Offers extensive user inputs for MA type and TP/SL logic—making the tool adaptable to many strategies and timeframes.

Signalgo S&DSignalgo S&D
Signalgo S&D is a next-generation indicator designed for traders who want to harness the true power of supply and demand (S&D) in their trading decisions. Unlike traditional S&D indicators, it leverages proprietary multi-timeframe net volume analysis, trend confirmation, and adaptive trade management.
How Signalgo S&D Works
Multi-Timeframe Net Volume Analysis
Net Volume Calculation: At the heart of Signalgo S&D is a unique net volume engine. It doesn’t just look at price or raw volume, but calculates a net volume value for each bar, factoring in both price movement and the true range of the candle. This is done across multiple timeframes—from 1 minute to 3 months—giving a layered, real-time view of market pressure.
Trend Measurement: The indicator tracks changes in net volume over a customizable trend length, identifying when buying or selling pressure is truly shifting.
Intelligent Signal Generation
Directional Shifts: Buy and sell signals are only considered when net volume flips from negative to positive (or vice versa) and the net volume trend confirms the move.
Multi-Timeframe Confirmation: Strong signals require agreement across several timeframes, filtering out noise and dramatically increasing reliability.
Volume & Momentum Filters: Each signal is further filtered using volume spikes, EMA alignment, and RSI momentum, ensuring that only high-quality, high-probability setups are flagged.
One-Time Event Detection: Signals are triggered only once per event, preventing repeated entries on the same move.
Adaptive Trade Management
Automated Entry/Exit Logic: Every trade signal is paired with a fully automated take-profit (TP), stop-loss (SL), and trailing stop system, all dynamically adjusted to current volatility.
Risk-Reward Scaling: Three profit targets (TP1, TP2, TP3) allow for scaling out or partial exits, while trailing stops lock in gains as the trade progresses.
Visual Feedback: All trade events—entries, exits, TPs, SLs—are clearly marked on the chart for transparency and review.
Inputs & User Controls
Preset Parameters:
Trend Length: Controls how sensitive net volume trend detection is.
Show Labels/Table: Visual toggles for displaying signal and trade management information.
Trade Management:
Show TP/SL Logic: Toggle to display or hide trade management levels.
ATR Length & Multipliers: Fine-tune how SL and TP levels adapt to market volatility.
Enable Trailing Stop: Activate or deactivate dynamic stop movement after TP1.
Entry & Exit Strategy
Entry Logic
Long (Buy) Entry: Triggered when net volume flips positive across multiple timeframes, the trend confirms, and all momentum/volume filters align.
Short (Sell) Entry: Triggered when net volume flips negative across multiple timeframes, with trend and momentum confirmation.
Exit & Trade Management
Stop Loss (SL): Automatically set based on recent volatility (ATR), adapting to the current market environment.
Take Profits (TP1, TP2, TP3): Three profit targets at increasing reward multiples, allowing for flexible trade management.
Trailing Stop: After TP1 is hit, the stop loss moves to breakeven and a trailing stop is activated to lock in further gains.
Event Markers: Each time a TP or SL is hit, a visual label is placed on the chart for full transparency.
Multi-Timeframe Synchronization: Instead of focusing on a single timeframe, this indicator requires confirmation across several, providing a market-wide perspective and filtering out false signals.
Dynamic, Adaptive Management: The built-in TP/SL and trailing logic is not static—it adapts to volatility and market conditions, providing a disciplined, automated approach to exits and risk.
Event-Driven, Not Static: Signals are only generated when all conditions align, and each event is marked only once, eliminating repetitive or redundant signals.
Advanced Filtering: Signals are filtered by volume spikes, EMA and RSI momentum, and trend alignment, ensuring only the highest-quality trades are considered.
Visual & Alert Integration: Every signal and trade event is visually marked and can trigger TradingView alerts, keeping you informed in real time.
Trading Strategy Application
Versatility: Suitable for scalping, day trading, swing trading, and even longer-term positions thanks to its multi-timeframe logic.
Systematic Execution: By automating entries, exits, and risk management, Signalgo S&D helps you trade with discipline and confidence, minimizing emotional bias.
Noise Reduction: The advanced, layered filtering logic means you only see the highest-probability setups, helping you avoid common S&D “fakeouts” and overtrading.

Signalgo S/RSignalgo S/R
Signalgo S/R is a cutting-edge TradingView indicator engineered for traders who want to leverage support and resistance (S/R) in a way that goes far beyond traditional methods. This overview will help you understand its unique approach, inputs, entry and exit strategies, and what truly sets it apart.
How Signalgo S/R Works
Multi-Timeframe S/R Detection
Layered Analysis: Signalgo S/R continuously scans price action across a wide spectrum of timeframes, from 1 minute up to 3 months. This multi-layered approach ensures that both short-term and long-term S/R levels are dynamically tracked and updated.
Advanced Pivot Recognition: Instead of simply plotting static lines, the indicator uses a sophisticated pivot recognition system to identify only the most relevant and recent S/R levels, adapting as the market evolves.
Synchronized Structure: By aligning S/R levels across timeframes, it builds a robust market structure that highlights truly significant zones—areas where price is most likely to react.
Intelligent Breakout & Reversal Signals
Close Confirmation: The indicator only triggers a breakout or breakdown signal when price not just touches, but closes beyond a key S/R level, dramatically reducing false signals.
Multi-Timeframe Confirmation: True buy or sell signals require agreement across several timeframes, filtering out noise and improving reliability.
One-Time Event Detection: Each breakout or breakdown is recognized only once per occurrence, eliminating repetitive signals from the same event.
Inputs & User Controls
Preset Parameters:
Pivot Length: Adjusts how sensitive the S/R detection is to price swings.
Label Offset: Fine-tunes the placement of visual labels for clarity.
Trade Management Controls:
Show TP/SL Logic: Toggle to display or hide take-profit (TP) and stop-loss (SL) levels.
ATR Length & Multipliers: Adapt SL and TP distances to current volatility.
Enable Trailing Stop: Option to activate dynamic stop movement after TP1 is reached.
Entry & Exit Strategy
Entry Logic
Long (Buy) Entry: Triggered when multiple timeframes confirm a breakout above resistance, signaling strong upward momentum.
Short (Sell) Entry: Triggered when multiple timeframes confirm a breakdown below support, indicating strong downward momentum.
Exit & Trade Management
Stop Loss (SL): Automatically set based on recent volatility, always adapting to current market conditions.
Take Profits (TP1, TP2, TP3): Three profit targets are set at increasing reward multiples, allowing for partial exits or scaling out.
Trailing Stop: After the first profit target is reached, the stop loss moves to breakeven and a trailing stop is activated, locking in gains as the trade continues.
Event Markers: Each time a TP or SL is hit, a visual label is placed on the chart for full transparency.
What Separates Signalgo S/R from Traditional S/R Indicators?
True Multi-Timeframe Synchronization: Most S/R tools only look at a single timeframe or plot static levels. Signalgo S/R dynamically aligns levels across all relevant timeframes, providing a comprehensive market map.
Event-Driven, Not Static: Instead of plotting every minor swing, it intelligently filters for only the most actionable S/R levels and signals—reducing chart clutter and focusing attention on what matters.
Breakout Confirmation Logic: Requires a close beyond S/R, not just a wick, to validate breakouts or breakdowns. This greatly reduces false positives.
Automated, Adaptive Trade Management: Built-in TP/SL and trailing logic mean you get not just signals, but a full trade management suite—something rarely found in standard S/R indicators.
Visual & Alert Integration: Every signal, TP/SL event, and trailing stop is visually marked and can trigger TradingView alerts, keeping you informed in real time.
Trading Strategy Application
Scalping to Swing Trading: The multi-timeframe logic makes it suitable for all trading styles, from fast intraday moves to longer-term position trades.
Systematic, Disciplined Execution: By automating entries, exits, and risk management, Signalgo S/R helps you trade with confidence and consistency, removing emotion from the process.
Noise Reduction: The advanced filtering logic means you only see the highest-probability setups, helping you avoid common S/R “fakeouts.”

Signalgo XSignalgo X
Signalgo X is a sophisticated indicator crafted for traders who demand a disciplined, multi-layered approach to market analysis and trade management. This overview will help you understand its capabilities, logic, and how it can elevate your trading.
Core Concept
Signalgo X is built to:
Scan multiple timeframes simultaneously for price, volume, and volatility patterns.
Filter out unreliable signals during periods of market hype or manipulation.
Automate trade management with dynamic take-profit (TP), stop-loss (SL), and trailing logic.
Deliver actionable, visual signals and alerts for timely, confident decisions.
Inputs & Controls
Preset System Parameters:
News Sensitivity: Determines how responsive the indicator is to price moves.
Hype Filter Strength: Sets how aggressively the system avoids volatile, manipulated, or news-driven periods.
User-Configurable:
Show TP/SL Logic: Turn on/off the display of take-profit and stop-loss levels directly on your chart.
How Signalgo X Works
1. Multi-Timeframe Market Analysis
Signalgo X continuously monitors:
Closing price
Trading volume
Volatility (ATR)
across six distinct timeframes, from 1 hour to 3 months. This layered approach ensures that signals are validated by both short-term momentum and long-term trends.
2. Price, Volume, and Volatility Synthesis
Price Change: The system tracks percentage changes over each timeframe to gauge momentum.
Volume Ratio: By comparing current volume to a moving average, it detects unusual spikes that may signal institutional activity or manipulation.
Volatility: Measures the intensity of price movements relative to average ranges, helping to identify breakout or exhaustion scenarios.
3. Proprietary Anti-Hype Filter
A unique scoring mechanism evaluates:
Volume spikes without corresponding price action
Sudden jumps in volatility
Conflicting signals across timeframes
Social hype proxies (e.g., sharp moves on low volume)
If the market is deemed “hyped,” all trading signals are suppressed and a clear warning is shown, keeping you out of unpredictable conditions.
4. Signal Classification & Mapping
Significant Moves: Only price actions that exceed a sensitivity threshold and are confirmed by volume/volatility are considered.
Bullish/Bearish Signals: Generated for each timeframe.
Signal Strength: Categorized as regular, or strong based on multi-timeframe agreement.
Entry & Exit Strategy
Entry Logic
Long (Buy) Entry: Triggered when bullish signals are detected (of any strength) and no hype is present.
Short (Sell) Entry: Triggered when bearish signals are detected and no hype is present.
Exit & Trade Management
Stop Loss (SL): Placed at a calculated distance from entry, adapting to recent volatility.
Take Profits (TP1, TP2, TP3): Three profit targets, each at a greater reward multiple.
Trailing Stop: After the first take-profit is hit, the stop-loss moves to breakeven and a trailing stop is activated to protect further gains.
Event Tracking: The indicator visually marks when each TP or SL is hit, providing real-time feedback.
Chart Plots: All relevant SL, TP, and trailing stop levels are clearly marked for both long and short trades.
Labels: Entry, exit, and signal strength events are color-coded and visually prominent.
Alerts: Built-in alert conditions allow you to set up TradingView notifications for strong/regular buy/sell signals and hype warnings.
Trading Strategy Application
Multi-Timeframe Confirmation: Only strong signals confirmed by several timeframes are acted upon, reducing false positives.
Volume & Volatility Awareness: The indicator avoids low-quality, “fakeout” signals by requiring confirmation from both price and volume/volatility.
Hype Avoidance: Keeps you out of the market during news-driven or manipulated periods, helping to protect your capital.
Automated Discipline: The TP/SL logic enforces a rules-based exit strategy, helping you lock in profits and limit losses without emotional interference.
Who Should Use Signalgo X?
Signalgo X is ideal for traders who want:
Systematic, high-confidence signals
Automated and disciplined trade management
Protection against unpredictable market events
Clear, actionable visuals and alerts

Range Average Retest Model [LuxAlgo]The Range Average Retest Model tool highlights setups from the range average retest entry model, a model using the retest of the average between two opposite swing points as an entry.
This tool uses long-term volatility coupled with user-defined multipliers to filter out swing areas and set take profit and stop loss levels for all trades.
Key features include:
Draw up to 165 swing areas and their associated trades
Filter out swing areas using Pivot Length , Selection Mode and Threshold parameters
Filter out trades with Maximum Distance and Minimum Distance parameters
Enable or disable swing areas and select default colors
Enable or disable overlapping trades and change the default colors for Take Profit and Stop Loss zones
🔶 USAGE
The "Range Average Retest Model" is an entry model that enters a position when the price retests the average made between two swing points. Users can determine the period of the detected swing points from the "Pivot Length" setting.
The conditions for long or short trades, regardless of whether the swing area is bullish or bearish, are as follows:
Long positions: the current bar close is below the swing area average and the last bar close was above it.
Short positions: the current bar close is above the swing area average price and the last bar close was below it.
Each trade is displayed on the chart with a line connecting it to its swing area highlighting the range average, a green area for the take profit, and a red area for the stop loss.
Both the Take Profit and Stop Loss levels are calculated by applying your own multiplier in the settings panel to the long-term volatility measure, in this case, the average true range over the last 200 bars.
Trades will remain open until they reach either the Stop Loss or Take Profit price levels.
🔹 Filtering Swing Areas
The daily chart of the Nasdaq-100 futures (NQ) with pivot length 2 and bullish selection mode: it only detects bullish swing areas, but they are smaller and more numerous.
Traders can manipulate the behavior of the swing areas from the settings panel.
The Selection mode will filter areas by bias: it will detect bullish areas, bearish areas, or both.
The Threshold parameter is applied to the long-term volatility to filter out areas where the average prices are too close together; the higher the value, the greater the difference between the average prices must be.
🔹 Trades
3-minute chart of the Nasdaq-100 futures (NQ) with pivot length 5, bearish selection mode maximum distance 4, and stop loss 2: many trades detected with very asymmetric risk/reward.
The behavior of the trades is also manipulated from the settings panel.
The maximum and minimum distance parameters specify the number of bars a trade must be away from a swing area.
The Take Profit and Stop Loss parameters are applied to the long-term volatility to obtain their respective price levels.
🔹 Overlapping Trades
Same chart as before, but with overlapping trades: messy, right?
By default the tool does not show overlapping trades, this allows for a cleaner chart.
In the settings panel traders can enable overlapping mode, in which case the tool will show all available trades.
Traders must be aware that the chart can be very crowded.
🔶 SETTINGS
🔹 Swings
Pivot Length: How many bars are used to confirm a swing point. The larger this parameter is, the larger and fewer swing areas will be detected.
Selection Mode: Swing area detection mode, detect only bullish swings, only bearish swings, or both.
Threshold: Swing area comparator. This threshold is multiplied by a measure of volatility (average true range over the last 200 bars), for a new swing area to be detected it must have an average level that is sufficiently distant from the average level of any untouched swing area, this parameter controls that distance.
🔹 Trades
Maximum distance: Maximum distance allowed between a swing area and a trade.
Minimum distance: Minimum distance allowed between a swing area and a trade.
Take profit: The size of the take profit - this threshold is multiplied by a measure of volatility (the average true range over the last 200 bars).
Stop loss: The size of the stop-loss: this threshold is multiplied by a measure of volatility (the average true range over the last 200 bars).

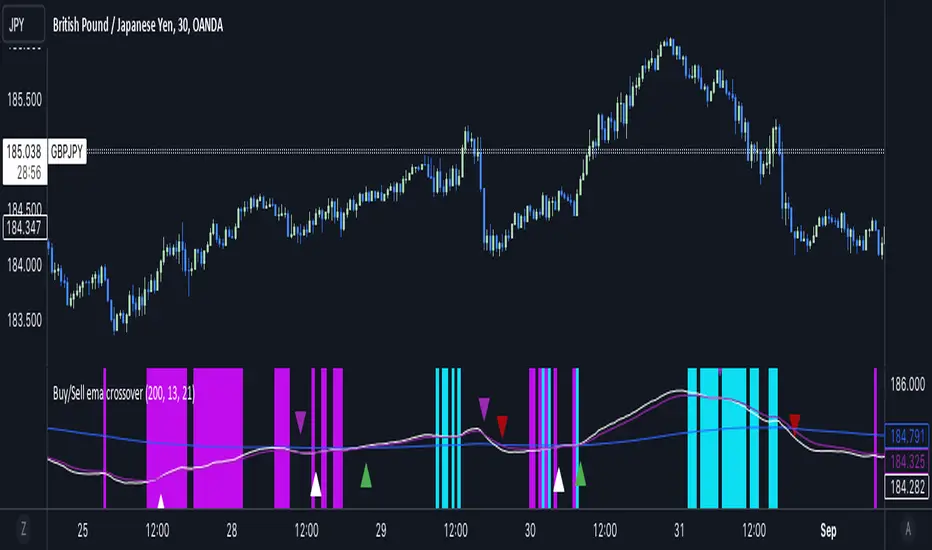
Buy/Sell EMA CrossoverThe indicator identifies potential trading opportunities within the market. It is entirely based on the combination of exponential moving averages by drawing triangles on the chart that identify buy or sell signals combined with vertical bars that create areas of interest.
Specifically, when a buy signal occurs, the indicator draws a vertical bar with an azure background, indicating a possible buy area. Similarly, a sell signal is represented by a vertical bar with a fuchsia background, indicating a possible sell area.
These areas represent the main point of the indicator which uses exponential moving averages which, based on the direction of prices, identify the trend and color the background of the graph in order to visually highlight the predominant trend.
The green triangles above the bars of the chart suggest possible upside opportunities (good bullish entry points) when the 21 ema crosses the 200 ema.
While on the contrary the red triangles, 21 ema lower than the 200 ema, can indicate possible bearish trends (good bearish entry points).
While the white and purple triangles reveal moments of potential indecision or market change.
We can think of them as situations of uncertain trend in which it is possible to place a long or short order near some conditions that we are going to see.
The white triangles below, which are created when the 13 ema is higher than the 21 ema, indicate a possible bullish zone while the purple triangles above (13 ema lower than the 21) could suggest a bearish reflex
Colored lines represent moving averages blue = 200, 21= fuchsia and 13 = white. If the price is above the 200 period line then it could be a bullish opportunity, otherwise it could be a bearish one.
An interesting strategy to adopt is to evaluate, for example, the inputs near the vertical bars (azure - long) (fuchsia - short) when a white or purple triangle appears.
The more prominent green triangle indicates that the trend is going in a long direction.
On the contrary, the red (short) triangles are the opposite of the green ones and have the same importance as input logic.
The white triangle instead present more often inside the indicator identifies interesting buying areas of short duration, it is important to consider that the closer the triangles are to the vertical blue bars the stronger the entry signal.
Finally, the purple triangles are the short-term bearish trends whose entry near the fuchsia vertical bars defines a short.
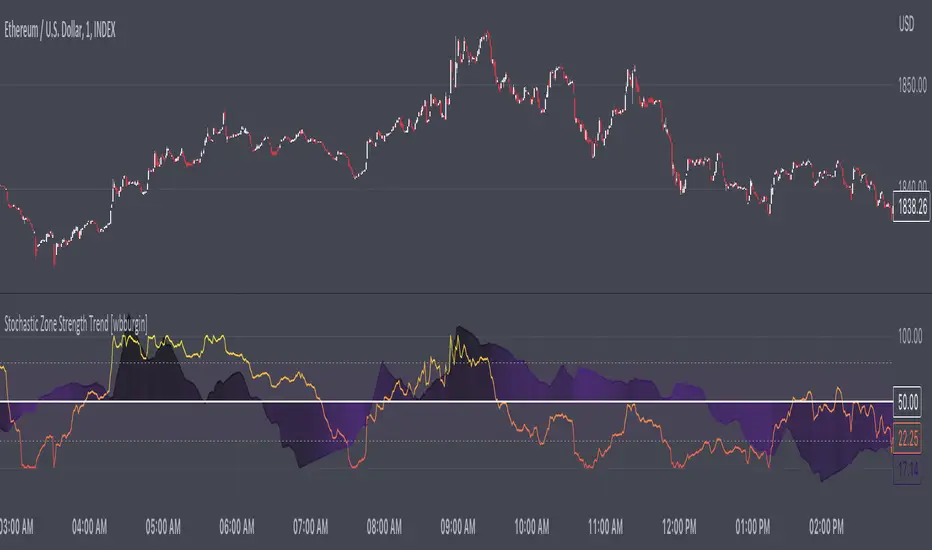
Stochastic Zone Strength Trend [wbburgin]The Stochastic Zone Strength Trend indicator is a very powerful momentum and trend indicator that 1) identifies trend direction and strength, 2) determines pullbacks and reversals (including possible entry/exit conditions), 3) works on every instrument, and 4) can filter out ranges. I have some examples below on how to use it to its full effectiveness. It is composed of two components: Stochastic Zone Strength and Stochastic Trend Strength .
Stochastic Zone Strength
At its most basic level, the stochastic Zone Strength plots the momentum of the price action of the instrument, and identifies bearish and bullish changes with a high degree of accuracy. Think of the stochastic Zone Strength as a much more robust version of the RSI. Momentum-change thresholds are demonstrated by the "20" and "80" levels on the indicator (see below image).
Stochastic Trend Strength
The stochastic Trend Strength component of the script uses resistance in each candlestick to calculate the trend strength of the instrument. I will go more into detail about the settings after my description of how to use the indicator, but there are two forms of the stochastic Trend Strength:
Anchored at 50 (directional stochastic Trend Strength:
The directional stochastic Trend Strength can be used similarly to the MACD difference or other histogram-like indicators : a rising plot indicates an upward trend, while a falling plot indicates a downward trend.
Anchored at 0 (nondirectional stochastic Trend Strength:
The nondirectional stochastic Trend Strength can be used similarly to the ADX or other non-directional indicators : a rising plot indicates increasing trend strength, and look at the stochastic Zone Strength component and your instrument to determine if this indicates increasing bullish strength or increasing bearish strength (see photo below):
(In the above photo, a bearish divergence indicated that the high Trend Strength predicted a strong downwards move, which was confirmed shortly after. Later, a bullish move upward by the Zone Strength while the Trend Strength was elevated predicated a strong upwards move, which was also confirmed. Note the period where the Trend Strength never reached above 80, which indicated a ranging period (and thus unprofitable to enter or exit)).
How to Use the Indicator
The above image is a good example on how to use the indicator to determine divergences and possible pivot points (lines and circles, respectively). I recommend using both the stochastic Zone Strength and the stochastic Trend Strength at the same time, as it can give you a robust picture of where momentum is in relation to the price action and its trajectory. Every color is changeable in the settings.
Settings
The Amplitude of the indicator is essentially the high-low lookback for both components.
The Wavelength of the indicator is how stretched-out you want the indicator to be: how many amplitudes do you want the indicator to process in one given bar.
A useful analogy that I use (and that I derived the names from) is from traditional physics. In wave motion, the Amplitude is the up-down sensitivity of the wave, and the Wavelength is the side-side stretch of the wave.
The Smoothing Factor of the settings is simply how smoothed you want the stochastic to be. It's not that important in most circumstances.
Trend Anchor was covered above (see my description of Trend Strength). The "Trend Transform MA Length" is the EMA length of the Trend Strength that you use to transform it into the directional oscillator. Think of the EMA being transformed onto the 50 line and then the Trend Strength being dragged relative to that.
Finally, the colors are changeable on the bottom.
Final Notes
As with previous and future invite-only scripts, I only restrict access to 1) maintain effectiveness of scripts, 2) because I use these scripts myself heavily, and/or 3) to support myself. Additionally, I will never make an restricted indicator that is not completely original in idea, scope, and execution.
Yours,
wbburgin
[TT] Entry ProIndicators doesnt make money, it is the concept behind the indicator that makes money. Please read and understand before contact. This is not for beginners or people who are looking for Buy Sell signals. Purely for those who can understand the concept of confluence.
This indicator will help you identify the Entry candle with confluence of SMC or Pivots or any other analysis that you use.
Rules to follow :-
1. Identify Support Resistance (Smart Money Concept), Pivots, Trendlines (Choice is Yours)
2. Once Identified S&R Look for Bearish Candle at resistance or Bullish signal at Support, mark the areas
NSE:NIFTY
3. At Support as shown above in examples if the pink candle or the confirmation candle doesnt close break the support but closes above the support area, we do not consider it as break down. Some time breakdown happens and then at retest we get the bearish signal, that will be a good entry.
4. Like wise at resistance if you cant see a bullish signal breaking the resistance area, we do not consider break out. Same as above sometimes we get a signal after breakout and while retesting. Bullish SIgnal At support example is given below
NSE:BANKNIFTY
5. Enter in to a trade right when you get the signal use less lot size when you do and once you see price coming in to the range of the colored candle keep accumulating more at OHLC areas, first at high of colored candle and then close and then HL2 areas likewise, this helps to reduce your SL.
Note:
Areas to remember and not to get confused. At Important levels (Support or Resistance) once you get a relavent signal while retesting that signal you get a counter signal do not get confused by that and exit the trade. once you enter a trade you have to remain there as long as your SL is not hit. Remember that You have to use this retest candles to enter in to a trade, but not to get scared.
How to Use this in Swing or Long term trading? Futures or Stocks !!!
Look at the setup below Use weekly Chart to analyze for investment. In the below chart you can see there is a breakout of Swing high with candle and then a retest happened Twice but that area is intact. The best strategy to consider confluence is SMC. Thats what my perfect Setup is. You can use Orderblock to see if that orderblock is valid or not. Below you can see NSE:BANKNIFTY
Few more Stocks for Example. NSE:AXISBANK
BITSTAMP:BTCUSD
OANDA:EURUSD
Strictly Not assuring any 100% results. You need to least be confident on one concept of trading to aquire results.

Three-Day Rolling PivotThe three-day rolling pivot is another pivot concept,
which may be used by intermediate positions, for several days or even weeks.
It can be utilized in many ways, such as to determine an entry point or trailing stop.
As the name suggests, this pivot is based on the last three days.
I learned this concept of the book "The logical Trader" by Mark Fisher.
Kudos go to him!
My version of the Three-Day Rolling Pivot uses actual data!
And all similar scripts I have found so far calculate future data and don't take into account the original data.
I hope this script will help some people to do some better decisions.
And I am pleased to get some advice to make this script even better!
Future data vs original data
Pine Script v5 Reference Manual:
Merge strategy for the requested data position... This merge strategy can lead to undesirable effect of getting data from "future" on calculation on history. This is unacceptable in backtesting strategies, but can be useful in indicators.
e2e4 on Stack Overflow said:
Pine v1-v2's security() function is using the lookahead parameter by default, which could be modified in v3-v5...
stackoverflow.com
I haven't found a script which put this into account jet.
I leave this option available for people that wanna more speculated data. But it's disabled by default.
Long/Short Example
You can enter Long when the market cross over the upper line (default color is green) and you should put your trailing stop 1-5 ticks below the lower line (default color is red).
The opposite when Shorting, then the market has to cross down the lower line and your trailing stop should be 1-5 ticks above the upper line.
How does this script work:
First it fetches the highest high of ...
yesterday,
the day before yesterday,
and the day before that.
After that the script looks for the highest high of all three.
Next it does the same for previous lowest low.
Last but not least, it fetches the closing price of the last day.
After that it adds all three prices together and divide them by three.
This result in a three day pivot price.
Then it adds the highest high and lowest low of the three last days and divide it by two.
This gives us the second number we need to calculate the differential.
The differential is the gap between the three day pivot price and the second number.
Sometimes the second number is bigger than the three day pivot price so I took that into account too. Other wise the colors plotted would be on the wrong site.
Finally, the script is rounding the numbers to the nearest minimum tick of that security.

Position Tools [Lot,Profit,Loss,Entry,RR,Balance][Mir Nader]This indicator is the advanced version of the position tool in Trading View. When I opened a trade in Metatrader, I had to switch between the MetaTrader and Trading View programs for the amount of profit or loss, that's why I thought of writing an indicator that shows the exact amount of profit, loss, size and other values of the open trade. It came to my mind.
Also, when you use the reply section for backtesting, this indicator helps you to use all the necessary information in each Trade to accurately calculate Trades.
To enter, it is enough to specify the three entry points, target and stop loss according to the message that is displayed to you, so that all the necessary information will be displayed for you.
Well, let's get to the main explanation about how the indicator works :
The indicator consists of two parts :
1 - the calculation table
2 - trade on the chart
Calculation table
This table shows the exact calculations of your trade live.
As you can see, this table consists of 10 sections, which I will describe each.
1 - Your trade entry point on the chart
2 - Your Stop Loss point along with the loss Pip amount
3 - Your Take Profit point along with the Profit Pip amount
4- The fourth part of the table, which is the most important part in my view, shows your current profit amount according to the risk percentage and your Broker Commission per Lot you have defined for Trade, and according to the balance, risk, Tp and Sl value, just like a Risk Management. It suggests the volume of your input based on the lot.
5 - Show the percentage change of the main market according to your trade live
6 - Display the value of Risk to Reward both according to Target Profit and live
7 - This section and the next section of the table show the amount of profit live according to the amount of the lot determined by you and without the risk of the transaction.
8 - Display the current amount of your balance according to whether the trade is in profit or loss
trade on the chart
The second part of the indicator includes the events that are being displayed on your chart
This section supports three types of display modes for buying or selling trades.
The first condition of your trade is that the price has not yet reached the entry point.
The second state is your trade that has not yet hit your target or stop
And the third state of your trade is that your target or stop has been hit.
Further Details :
I am still working on many conditions to add to the indicator and this will take more time.
For example, showing RR live on the chart after each touch has been added for buying Trade but this part is still problematic for selling Trade In the picture below, you can see that your Trade has already passed 3R profit
I have placed three labels next to each Trade for you so that you can see the values of Tp, Stop and Live without needing a table. These values will soon be visible with more options.
All calculations with precise mathematical formulas for accurate performance have been done by myself.
I will be at your service soon with more updates, I will be happy if you send me your suggestions to improve the indicator.

Consolidated IndicatorI have attempted to combine all the parameters to decide on the entry and exit points for stocks. The indicator combines
1) EMAs
2)PSAR
3)ATR
The script also attempts to show the risk-reward
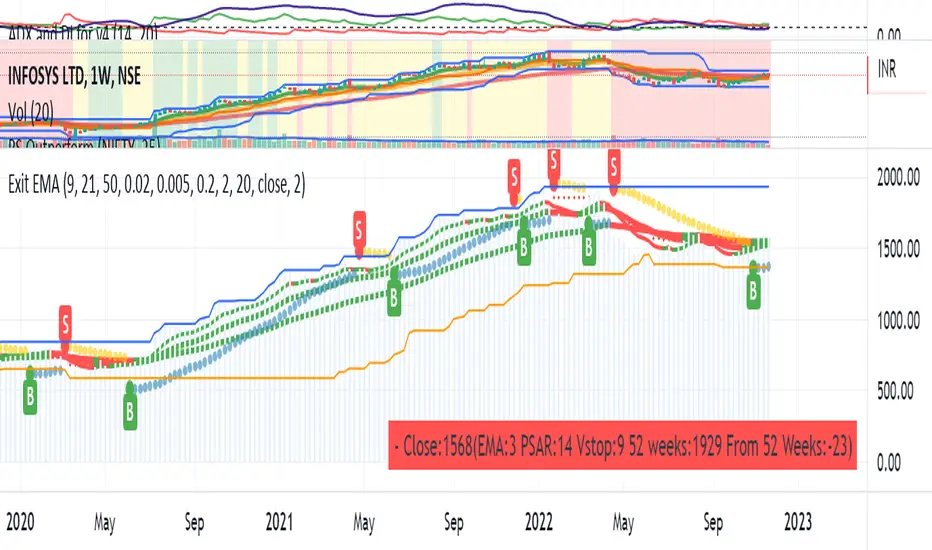
Price based ATR%This script shows upto two lines that represent a deviation from the price based on a multiple of the ATR%
close + ( (close / 100) * ( atr * upperMultiplier) )
and
close - ( (close / 100) * ( atr * lowerMultiplier) )
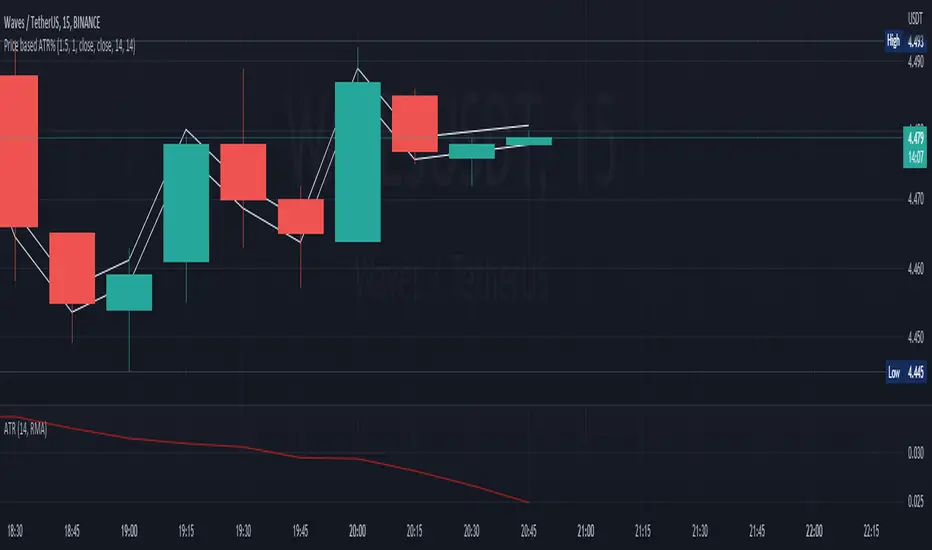
Risk:RewardThis Indicator displays Entry and Exits levels. The display is done under 3 modes:
- Risk/Reward mode (the one by default. It is set to a 1:1 ratio)
- Multiples TP Levels
- Custom Levels
Click to Set entry Price on chart
The displaying is static by default
to make it dynamic disable the "Use custom Entry ?" input.
Disclaimer: Scripts that I post publicly are experimental. They are not financial advices. Always backtest your ideas using your own methodologies.

Parabolic sar with breaksThis plots a Parabolic sar and a break line on the previous sar point before the parabolic sar flips.
This is looking to be a very popular entry signal for lots of strats.
How to use:
In conjunction with other confirmation indicators;
Long : Enter long when the Parabolic sar is below the price and the price breaks above (and closes) the break line.
Short : Enter short when the Parabolic sar is above the price and the price breaks below (and closes) the break line.
A great indicator combination for this is to use a 200 ema for price trend and volume flow.