[LTG]UP_FibonacciA moving Fibonacci Sequence that automatically draws on your charts to predict extensions based around the retracement levels. The targets and retracements are colour coordinated to allow for quick decision making and allows you to find the best entries and targets. For example, if the market pulls back to the red zone 61.8% Fibonacci level then the most probable extension will be to the red 161.8% level. The target is clearly visible with a white dashed line.
امتدادات فيبوناتشي

[LTG]DOWN_FibonacciA moving Fibonacci Sequence that automatically draws on your charts to predict extensions based around the retracement levels. The targets and retracements are colour coordinated to allow for quick decision making and allows you to find the best entries and targets. For example, if the market pulls back to the red zone 61.8% Fibonacci level then the most probable extension will be to the red 161.8% level. The target is clearly visible with a white dashed line.

ES-STF Fib2666.25 to 3180.50 (STF) - Maroon, Green, White (ES)This is a Shorter Time Frame Fib level indicator. To be used with Longer Time frame Indicator. Though it can be used independently. It shows where the market is looking to go and where it has been. When the market get above one level ( white bar, for example) look for price action to continue to the next level. If it breaks below the white bar look for price action to go the next level below for support. It is fractal in nature. It is fib levels inside longer time frame fib levels. I hope it will impress! It is great for having targets and support levels. It helps in knowing why the market may continue in a direction. For example: When the price action has already moved up, why does it keep going up, because it hasn't reached targeted fib level, yet. Same reason price action may move lower once it breaks a particular level. It is looking for its fib level support. Use with ES-STF 1902.25 to 2666.25 fib levels also, depending on price action is.
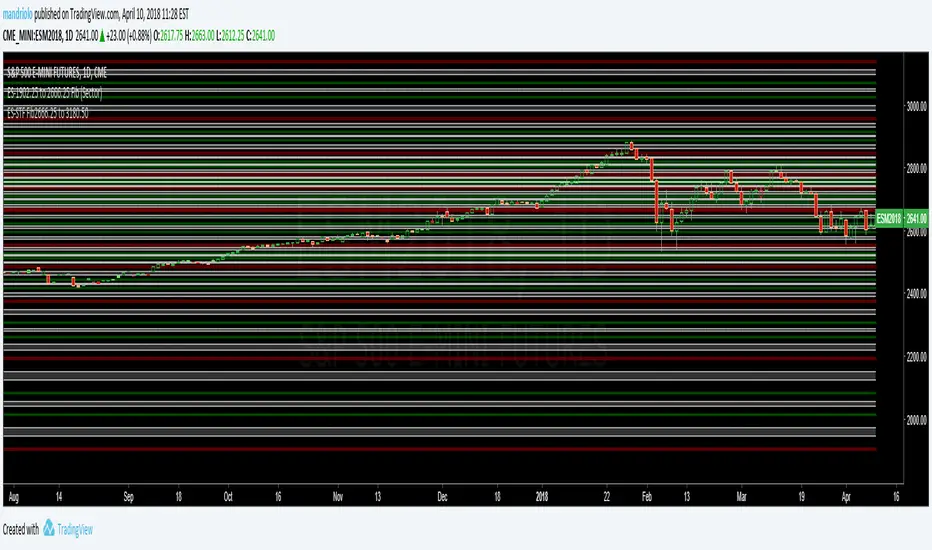
ES-665.75 to 3902.75 (LTF) - Maroon, Green, White (ES)This is a Longer Time Frame Fib level indicator. It shows where the market is looking to go and where it has been. When the market get above one level ( white bar, for example) look for price action to continue to the next level. If it breaks below the white bar look for it to go the next level below for support. I will also publish levels inside these levels for those looking to see them on smaller time frames. I hope it will impress! It is great for having targets. It helps in knowing why the market may continue in a direction. For example: When the price action has already moved up, why does it keep going up, because it hasn't reached targeted fib level yet. Same reason price action may move lower. It is looking for its fib level support. I will publish the fractal or inner fibs too. I also have the SPY fib out. With two plug number it will work for any instrument.

SPY 390.275 to 266.6216 (SPY-STF) - Maroon, Green, White (SPY)This is a Shorter Time Frame Fib level indicator. To be used with Longer Time frame Indicator. Though it can be used independently. It shows where the market is looking to go and where it has been. When the market get above one level ( white bar, for example) look for price action to continue to the next level. If it breaks below the white bar look for price action to go the next level below for support. It is fractal in nature. It is fib levels inside longer time frame fib levels. I hope it will impress! It is great for having targets and support levels. It helps in knowing why the market may continue in a direction. For example: When the price action has already moved up, why does it keep going up, because it hasn't reached targeted fib level, yet. Same reason price action may move lower once it breaks a particular level. It is looking for its fib level support.

SPY-190.225 to 266.625 (STF) - Maroon, Green, White (SPY)This is a Shorter Time Frame Fib level indicator. To be used with Longer Time frame Indicator. Though it can be used independently. It shows where the market is looking to go and where it has been. When the market get above one level ( white bar, for example) look for price action to continue to the next level. If it breaks below the white bar look for it to go the next level below for support. It is fractal in nature. It is fib levels inside longer time frame fib levels. I hope it will impress! It is great for having targets. It helps in knowing why the market may continue in a direction. For example: When the price action has already moved up, why does it keep going up, because it hasn't reached targeted fib level yet. Same reason price action may move lower once it breaks a particular level. It is looking for its fib level support.
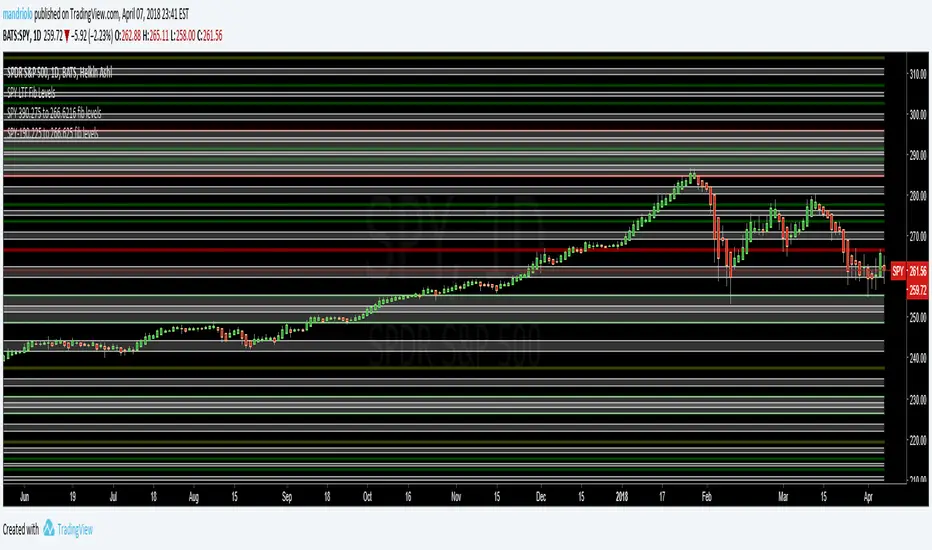
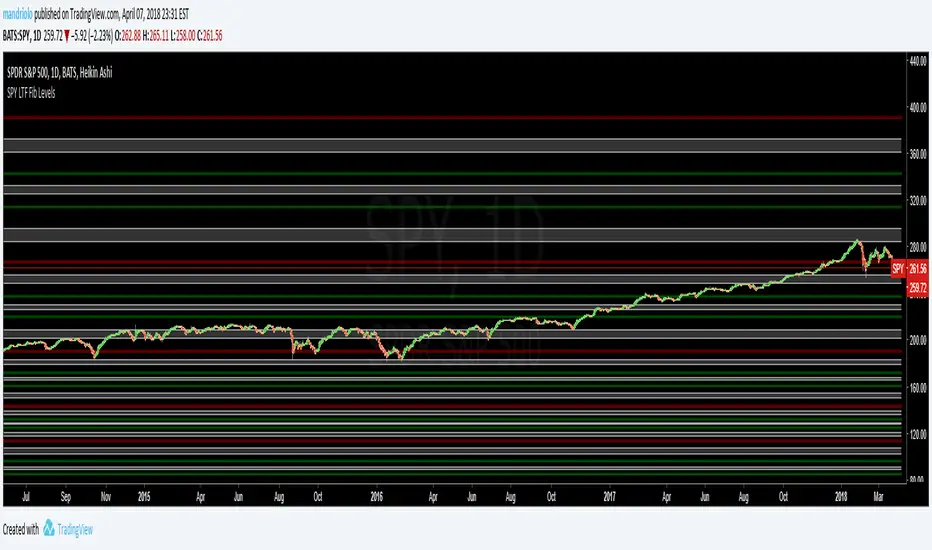
SPY LongerTimeFrame (LTF) - Maroon, Green, White (SPY)This is a Longer Time Frame Fib level indicator. It shows where the market is looking to go and where it has been. When the market get above one level ( white bar, for example) look for price action to continue to the next level. If it breaks below the white bar look for it to go the next level below for support. I will also publish levels inside these levels for those looking to see them on smaller time frames. I hope it will impress! It is great for having targets. It helps in knowing why the market may continue in a direction. For example: When the price action has already moved up, why does it keep going up, because it hasn't reached targeted fib level yet. Same reason price action may move lower. It is looking for its fib level support.
Fibon-IchimokuThis is a highly modified version of the classic Ichimoku cloud indicator. It incorporates Fibonacci retracement levels into the display. Hence the name "Fibon-Ichimoku"
As well as the standard short term Tenken-sen (blue line) and medium term Kinjun-sen (red line), it also includes a long term perspective line as well (in white).
The Tenken-sen and Kinjun-sen lines have been adjusted to work with 24hr Cryptocurrency markets.
Each line can also have the option to show 38.2% and 61.8% Fibonacci levels, however, I suggest not using them all at once, as there is a lot of information on the screen.
There is also a faint green and red thin line showing the top and bottom limits of the long term period.
Plotted above the candles, is a Fibonacci extension target line as a "possible" sell target level, this uses the Kinjun-sen time frame to find the swing low and swing high.
The extension target value is customisable by value as well as by forward or backward display offset.
The target level will show if the closing prices, from current bar to 2 periods back, is greater than the long term 50% line and the current Kinjun-sen 61.8% level is greater than the current long term 50% level.
After that if the Tenken-sen line is above the Kinjun-sen line, then the target will be green indicating a stronger trend. If it's less, then it will show as yellow.
BUT WAIT THERE"S MORE!!!
======================
Just for the sake of it, it also includes as an option to show inside bar alerts and price bar direction.
an "X" means an inside bar, arrows up or down indicate the direction of movement if it's not an inside bar.
The middle points of the bars determine the colouring of the alert.
If the current middle is greater than the previous, then it's green.
If the current middle is less than the previous, then it's red.
If there is no change then it's yellow.
