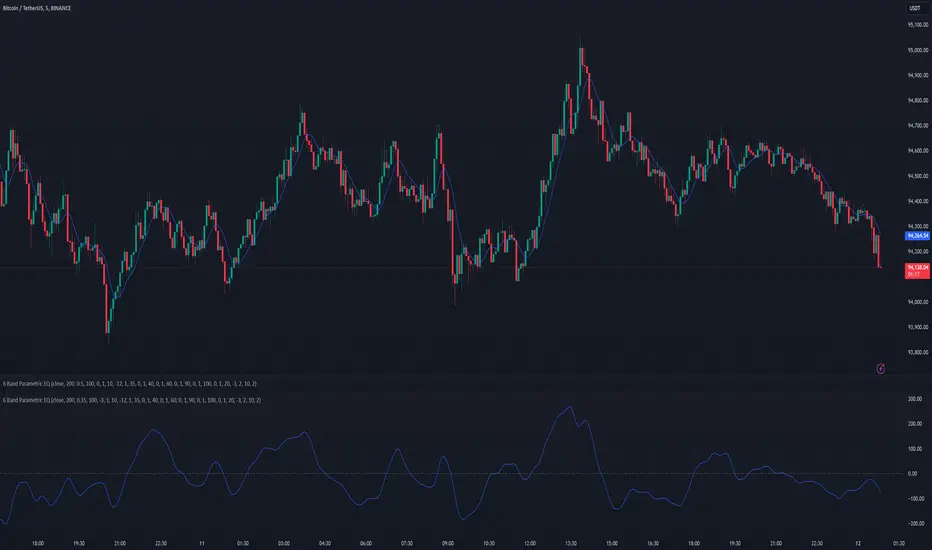
6 Band Parametric EQThis indicator implements a complete parametric equalizer on any data source using high-pass and low-pass filters, high and low shelving filters, and six fully configurable bell filters. Each filter stage features standard audio DSP controls including frequency, Q factor, and gain where applicable. While parametric EQ is typically used for audio processing, this implementation raises questions about the nature of filtering in technical analysis. Why stop at simple moving averages when you can shape your signal's frequency response with surgical precision? The answer may reveal more about our assumptions than our indicators.
Filter Types and Parameters
High-Pass Filter:
A high-pass filter attenuates frequency components below its cutoff frequency while passing higher frequencies. The Q parameter controls resonance at the cutoff point, with higher values creating more pronounced peaks.
Low-Pass Filter:
The low-pass filter does the opposite - it attenuates frequencies above the cutoff while passing lower frequencies. Like the high-pass, its Q parameter affects the resonance at the cutoff frequency.
High/Low Shelf Filters:
Shelf filters boost or cut all frequencies above (high shelf) or below (low shelf) the target frequency. The slope parameter determines the steepness of the transition around the target frequency , with a value of 1.0 creating a gentle slope and lower values making the transition more abrupt. The gain parameter sets the amount of boost or cut in decibels.
Bell Filters:
Bell (or peaking) filters create a boost or cut centered around a specific frequency. A bell filter's frequency parameter determines the center point of the effect, while Q controls the width of the affected frequency range - higher Q values create a narrower bandwidth. The gain parameter defines the amount of boost or cut in decibels.
All filters run in series, processing the signal in this order: high-pass → low shelf → bell filters → high shelf → low-pass. Each stage can be independently enabled or bypassed.
The frequency parameter for all filters represents the period length of the targeted frequency component. Lower values target higher frequencies and vice versa. All gain values are in decibels, where positive values boost and negative values cut.
The 6-Band Parametric EQ combines these filters into a comprehensive frequency shaping tool. Just as audio engineers use parametric EQs to sculpt sound, this indicator lets you shape market data's frequency components with surgical precision. But beyond its technical implementation, this indicator serves as a thought experiment about the nature of filtering in technical analysis. While traditional indicators often rely on simple moving averages or single-frequency filters, the parametric EQ takes this concept to its logical extreme - offering complete control over the frequency domain of price action. Whether this level of filtering precision is useful for analysis is perhaps less important than what it reveals about our assumptions regarding market data and its frequency components.
Filter
Wave Smoother [WS]The Wave Smoother is a unique FIR filter built from the interaction of two trigonometric waves. A cosine carrier wave is modulated by a sine wave at half the carrier's period, creating smooth transitions and controlled undershoot. The Phase parameter (0° to 119°) adjusts the modulating wave's phase, affecting both response time and undershoot characteristics. At 30° phase the impulse response starts at 0.5 and exhibits gentle undershoot, providing balanced smoothing. Higher phase values reduce ramp-up time and increase undershoot - this undershoot in the impulse response creates overshooting behavior in the filter's output, which helps reduce lag and speed up the response. The default 70° phase setting provides maximum speed while maintaining stability, though practical settings can range from 30° to 70°. The filter's impulse response consists entirely of smooth curves, ensuring consistent behavior across all settings. This design offers traders flexible control over the smoothing-speed trade-off while maintaining reliable signal generation.

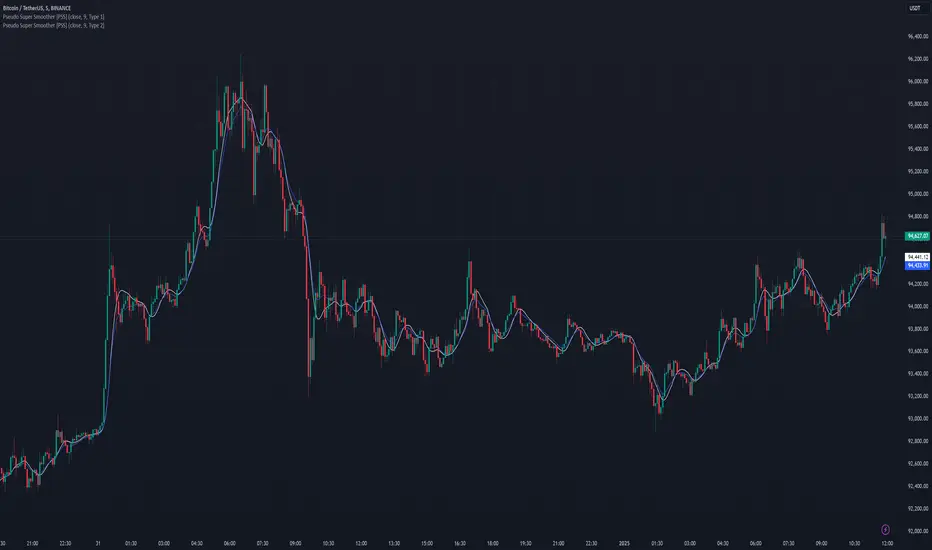
Pseudo Super Smoother [PSS]The Pseudo Super Smoother (PSS) is a a Finite Impulse Response (FIR) filter. It provides a smoothed representation of the underlying data. This indicator can be considered a variation of a moving average, offering a unique approach to filtering price or other data series.
The PSS is inspired by the Super Smoother filter, known for its ability to reduce noise while maintaining a relatively low delay. However, the Super Smoother is an Infinite Impulse Response (IIR) filter. The PSS attempts to approximate some characteristics of the Super Smoother using an FIR design, which offers inherent stability.
The indicator offers two distinct filter types, selectable via the "Filter Style" input: Type 1 and Type 2 . Type 1 provides a smoother output with a more gradual response to changes in the input data. It is characterized by a greater attenuation of high-frequency components. Type 2 exhibits increased reactivity compared to Type 1 , allowing for a faster response to shifts in the underlying data trend, albeit with a potential overshoot. The choice between these two types will depend on the specific application and the preference for responsiveness versus smoothness.
The PSS calculates the FIR filter coefficients based on a decaying exponential function, adjusted according to the selected filter type and the user-defined period. The filter then applies these coefficients to a window of past data, effectively creating a weighted average that emphasizes more recent data points to varying degrees. The PSS uses a specific initialization technique that uses the first non-null data point to pre-fill the input window, which helps it start right away.
The PSS is an approximation of the Super Smoother filter using an FIR design. While it try's to emulate some of the Super Smoother's smoothing characteristics, users should be aware that the frequency response and overall behavior will differ due to it being a rough approximation. The PSS should be considered an experimental indicator and used in conjunction with other analysis techniques. This is, effectively, just another moving average, but its novelty lies in its attempt to bridge the gap between FIR and IIR filter designs for a specific smoothing goal.
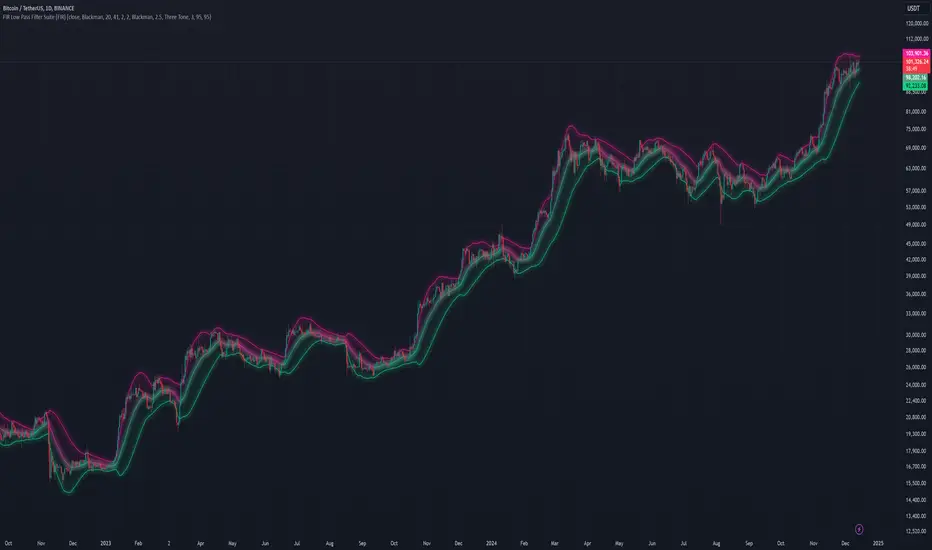
FIR Low Pass Filter Suite (FIR)The FIR Low Pass Filter Suite is an advanced signal processing indicator that applies finite impulse response (FIR) filtering techniques to price data. At its core, the indicator uses windowed-sinc filtering, which provides optimal frequency response characteristics for separating trend from noise in financial data.
The indicator offers multiple window functions including Kaiser, Kaiser-Bessel Derived (KBD), Hann, Hamming, Blackman, Triangular, and Lanczos. Each window type provides different trade-offs between main-lobe width and side-lobe attenuation, allowing users to fine-tune the frequency response characteristics of the filter. The Kaiser and KBD windows provide additional control through an alpha parameter that adjusts the shape of the window function.
A key feature is the ability to operate in either linear or logarithmic space. Logarithmic filtering can be particularly appropriate for financial data due to the multiplicative nature of price movements. The indicator includes an envelope system that can adaptively calculate bands around the filtered price using either arithmetic or geometric deviation, with separate controls for upper and lower bands to account for the asymmetric nature of market movements.
The implementation handles edge effects through proper initialization and offers both centered and forward-only filtering modes. Centered mode provides zero phase distortion but introduces lag, while forward-only mode operates causally with no lag but introduces some phase distortion. All calculations are performed using vectorized operations for efficiency, with carefully designed state management to handle the filter's warm-up period.
Visual feedback is provided through customizable color gradients that can reflect the current trend direction, with optional glow effects and background fills to enhance visibility. The indicator maintains high numerical precision throughout its calculations while providing smooth, artifact-free output suitable for both analysis and visualization.
Heikin Ashi Processed Generalized Smooth StepDisclaimer : This is my attempt of smoothing and improving @tarasenko_ script. Find the originial author here :
Overview:
The Smooth Step Heikin Ashi Indicator is an enhanced version of the original script developed by tarasenko_. This advanced TradingView tool integrates Heikin Ashi candlestick calculations with a sophisticated smoothing oscillator, offering traders improved trend visualization and dynamic alert capabilities.
Key Enhancements:
Refined Heikin Ashi Calculations: The indicator computes smoothed Open, High, Low, and Close (OHLC) values with adjustable factors, allowing for more precise trend analysis. It also includes an optional second-level modified Heikin Ashi calculation for additional smoothing.
Advanced Smooth Step Oscillator: Utilizing Pascal’s triangle, this oscillator provides a visual representation of price momentum. Traders can configure the lookback period, equation order, and threshold to tailor the oscillator to specific trading strategies.
Enhanced Customization Options: Users can toggle between standard and Heikin Ashi candles, adjust smoothing parameters, and set display preferences to align with their analytical needs.
Noise Reduction: Smoothes out market fluctuations using customizable Heikin Ashi factors. Introduces a second-level smoothing option for even greater noise reduction, allowing traders to focus on the core trend.
Original Indicator :
Heikin Ashi processed version :
Visualization Features:
Heikin Ashi Candles: Displays candles with customizable colors and visibility settings, aiding in clearer trend identification.
Smooth Step Oscillator Line: Plots a line that reflects trend strength and momentum, assisting traders in making informed decisions.
Threshold Line: Provides a visual reference point to facilitate quick assessments of market conditions.
Conclusion:
Building upon tarasenko_'s original work, the Smooth Step Heikin Ashi Indicator delivers a robust tool for traders seeking refined market analysis. Its combination of advanced smoothing techniques and dynamic alert features makes it a valuable addition to any trader's toolkit.

Hodrick-Prescott Cycle Component (YavuzAkbay)The Hodrick-Prescott Cycle Component indicator in Pine Script™ is an advanced tool that helps traders isolate and analyze the cyclical deviations in asset prices from their underlying trend. This script calculates the cycle component of the price series using the Hodrick-Prescott (HP) filter, allowing traders to observe and interpret the short-term price movements around the long-term trend. By providing two views—Percentage and Price Difference—this indicator gives flexibility in how these cyclical movements are visualized and interpreted.
What This Script Does
This indicator focuses exclusively on the cycle component of the price, which is the deviation of the current price from the long-term trend calculated by the HP filter. This deviation (or "cycle") is what traders analyze for mean-reversion opportunities and overbought/oversold conditions. The script allows users to see this deviation in two ways:
Percentage Difference: Shows the deviation as a percentage of the trend, giving a normalized view of the price’s distance from its trend component.
Price Difference: Shows the deviation in absolute price terms, reflecting how many price units the price is above or below the trend.
How It Works
Trend Component Calculation with the HP Filter: Using the HP filter, the script isolates the trend component of the price. The smoothness of this trend is controlled by the smoothness parameter (λ), which can be adjusted by the user. A higher λ value results in a smoother trend, while a lower λ value makes it more responsive to short-term changes.
Cycle Component Calculation: Percentage Deviation (cycle_pct) calculated as the difference between the current price and the trend, divided by the trend, and then multiplied by 100. This metric shows how far the price deviates from the trend in relative terms. Price Difference (cycle_price) simply the difference between the current price and the trend component, displaying the deviation in absolute price units.
Conditional Plotting: The user can choose to view the cycle component as either a percentage or a price difference by selecting the Display Mode input. The indicator will plot the chosen mode in a separate pane, helping traders focus on the preferred measure of deviation.
How to Use This Indicator
Identify Overbought/Oversold Conditions: When the cycle component deviates significantly from the zero line (shown with a dashed horizontal line), it may indicate overbought or oversold conditions. For instance, a high positive cycle component suggests the price may be overbought relative to the trend, while a large negative cycle suggests potential oversold conditions.
Mean-Reversion Strategy: In mean-reverting markets, traders can use this indicator to spot potential reversal points. For example, if the cycle component shows an extreme deviation from zero, it could signal that the price is likely to revert to the trend. This can help traders with entry and exit points when the asset is expected to correct back toward its trend.
Trend Strength and Cycle Analysis: By comparing the magnitude and duration of deviations, traders can gauge the strength of cycles and assess if a new trend might be forming. If the cycle component remains consistently positive or negative, it may indicate a persistent market bias, even as prices fluctuate around the trend.
Percentage vs. Price Difference Views: Use the Percentage Difference mode to standardize deviations and compare across assets or different timeframes. This is especially helpful when analyzing assets with varying price levels. Use the Price Difference mode when an absolute deviation (price units) is more intuitive for spotting overbought/oversold levels based on the asset’s actual price.
Using with Hodrick-Prescott: You can also use Hodrick-Prescott, another indicator that I have adapted to the Tradingview platform, to see the trend on the chart, and you can also use this indicator to see how far the price is deviating from the trend. This gives you a multifaceted perspective on your trades.
Practical Tips for Traders
Set the Smoothness Parameter (λ): Adjust the λ parameter to match your trading timeframe and asset characteristics. Lower values make the trend more sensitive, which might suit short-term trading, while higher values smooth out the trend for long-term analysis.
Cycle Component as Confirmation: Combine this indicator with other momentum or trend indicators for confirmation of overbought/oversold signals. For example, use the cycle component with RSI or MACD to validate the likelihood of mean-reversion.
Observe Divergences: Divergences between price movements and the cycle component can indicate potential reversals. If the price hits a new high, but the cycle component shows a smaller deviation than previous highs, it could signal a weakening trend.

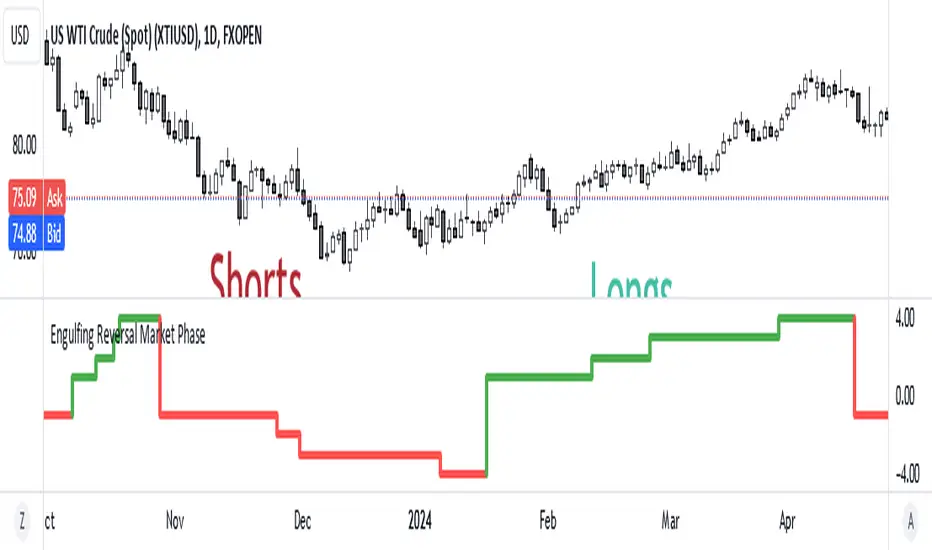
Engulfing Reversal Market PhaseStay at the right side of the market.
This indicator detects bullish and bearish phase in the market based on recent reversal.
It is designed to help filter your trades.
Open only long trades if indicator shows green and open only short trades when indicator shows red.
This indicator will detect bullish and bearish engulfing reversal pattern on the chart.
Bullish engulfing occurs when current candle closes below the bars that created the high.
Bearish engulfing occurs when current candle closes below the bars that created the high.
The reversal pattern occurs not only on a trend change, but can be also be present as a trend continuation pattern or a breakout pattern.
The indicator is able to detect 3 candle patterns and multi candle patterns if detects inside bars in the pattern.
H-Infinity Volatility Filter [QuantAlgo]Introducing the H-Infinity Volatility Filter by QuantAlgo 📈💫
Enhance your trading/investing strategy with the H-Infinity Volatility Filter , a powerful tool designed to filter out market noise and identify clear trend signals in volatile conditions. By applying an advanced H∞ filtering process, this indicator assists traders and investors in navigating uncertain market conditions with improved clarity and precision.
🌟 Key Features:
🛠 Customizable Noise Parameters: Adjust worst-case noise and disturbance settings to tailor the filter to various market conditions. This flexibility helps you adapt the indicator to handle different levels of market volatility and disruptions.
⚡️ Dynamic Trend Detection: The filter identifies uptrends and downtrends based on the filtered price data, allowing you to quickly spot potential shifts in the market direction.
🎨 Color-Coded Visuals: Easily differentiate between bullish and bearish trends with customizable color settings. The indicator colors the chart’s candles according to the detected trend for immediate clarity.
🔔 Custom Alerts: Set alerts for trend changes, so you’re instantly informed when the market transitions from bullish to bearish or vice versa. Stay updated without constantly monitoring the charts.
📈 How to Use:
✅ Add the Indicator: Add the H-Infinity Volatility Filter to your favourites and apply it to your chart. Customize the noise and disturbance parameters to match the volatility of the asset you are trading/investing. This allows you to optimize the filter for your specific strategy.
👀 Monitor Trend Shifts: Watch for clear visual signals as the filter detects uptrends or downtrends. The color-coded candles and line plots help you quickly assess market conditions and potential reversals.
🔔 Set Alerts: Configure alerts to notify you when the trend changes, allowing you to react quickly to potential market shifts without needing to manually track price movements.
🌟 How It Works and Academic Background:
The H-Infinity Volatility Filter is built on the foundations of H∞ (H-infinity) control theory , a mathematical framework originating from the field of engineering and control systems. Developed in the 1980s by notable engineers such as George Zames and John C. Doyle , this theory was designed to help systems perform optimally under uncertain and noisy conditions. H∞ control focuses on minimizing the worst-case effects of disturbances and noise, making it a powerful tool for managing uncertainty in complex environments.
In financial markets, where unpredictable price fluctuations and noise often obscure meaningful trends, this same concept can be applied to price data to filter out short-term volatility. The H-Infinity Volatility Filter adopts this approach, allowing traders and investors to better identify potential trends by reducing the impact of random price movements. Instead of focusing on precise market predictions, the filter increases the probability of highlighting significant trends by smoothing out market noise.
This indicator works by processing historical price data through an H∞ filter that continuously adjusts based on worst-case noise levels and disturbances. By considering several past states, it estimates the current price trend while accounting for potential external disruptions that might influence price behavior. Parameters like "worst-case noise" and "disturbance" are user-configurable, allowing traders to adapt the filter to different market conditions. For example, in highly volatile markets, these parameters can be adjusted to manage larger price swings, while in more stable markets, they can be fine-tuned for smoother trend detection.
The H-Infinity Volatility Filter also incorporates a dynamic trend detection system that classifies price movements as bullish or bearish. It uses color-coded candles and plots—green for bullish trends and red for bearish trends—to provide clear visual cues for market direction. This helps traders and investors quickly interpret the trend and act on potential signals. While the indicator doesn’t guarantee accuracy in trend prediction, it significantly reduces the likelihood of false signals by focusing on meaningful price changes rather than random fluctuations.
How It Can Be Applied to Trading/Investing:
By applying the principles of H∞ control theory to financial markets, the H-Infinity Volatility Filter provides traders and investors with a sophisticated tool that manages uncertainty more effectively. Its design makes it suitable for use in a wide range of markets—whether in fast-moving, volatile environments or calmer conditions.
The indicator is versatile and can be used in both short-term trading and medium to long-term investing strategies. Traders can tune the filter to align with their specific risk tolerance, asset class, and market conditions, making it an ideal tool for reducing the effects of market noise while increasing the probability of detecting reliable trend signals.
For investors, the filter can help in identifying medium to long-term trends by filtering out short-term price swings and focusing on the broader market direction. Whether applied to stocks, forex, commodities, or cryptocurrencies, the H-Infinity Volatility Filter helps traders and investors interpret market behavior with more confidence by offering a more refined view of price movements through its noise reduction techniques.
Disclaimer:
The H-Infinity Volatility Filter is designed to assist in market analysis by filtering out noise and volatility. It should not be used as the sole tool for making trading or investment decisions. Always incorporate other forms of analysis and risk management strategies. No statements or signals from this indicator or us should be considered financial advice. Past performance is not indicative of future results.

Adaptive RSI-Stoch with Butterworth Filter [UAlgo]The Adaptive RSI-Stoch with Butterworth Filter is a technical indicator designed to combine the strengths of the Relative Strength Index (RSI), Stochastic Oscillator, and a Butterworth Filter to provide a smooth and adaptive momentum-based trading signal. This custom-built indicator leverages the RSI to measure market momentum, applies Stochastic calculations for overbought/oversold conditions, and incorporates a Butterworth Filter to reduce noise and smooth out price movements for enhanced signal reliability.
By utilizing these combined methods, this indicator aims to help traders identify potential market reversal points, momentum shifts, and overbought/oversold conditions with greater precision, while minimizing false signals in volatile markets.
🔶 Key Features
Adaptive RSI and Stochastic Oscillator: Calculates RSI using a configurable period and applies a dual-smoothing mechanism with Stochastic Oscillator values (K and D lines).
Helps in identifying momentum strength and potential trend reversals.
Butterworth Filter: An advanced signal processing filter that reduces noise and smooths out the indicator values for better trend identification.
The filter can be enabled or disabled based on user preferences.
Customizable Parameters: Flexibility to adjust the length of RSI, the smoothing factors for Stochastic (K and D values), and the Butterworth Filter period.
🔶 Interpreting the Indicator
RSI & Stochastic Calculations:
The RSI is calculated based on the closing price over the user-defined period, and further smoothed to generate Stochastic Oscillator values.
The K and D values of the Stochastic Oscillator provide insights into short-term overbought or oversold conditions.
Butterworth Filter Application:
What is Butterworth Filter and How It Works?
The Butterworth Filter is a type of signal processing filter that is designed to have a maximally flat frequency response in the passband, meaning it doesn’t distort the frequency components of the signal within the desired range. It is widely used in digital signal processing and technical analysis to smooth noisy data while preserving the important trends in the underlying data. In this indicator, the Butterworth Filter is applied to the trigger value, making the resulting signal smoother and more stable by filtering out short-term fluctuations or noise in price data.
Key Concepts Behind the Butterworth Filter:
Filter Design: The Butterworth filter works by calculating weighted averages of current and past inputs (price or indicator values) and outputs to produce a smooth output. It is characterized by the absence of ripple in the passband and a smooth roll-off after the cutoff frequency.
Cutoff Frequency: The period specified in the indicator acts as a control for the cutoff frequency. A higher period means the filter will remove more high-frequency noise and retain longer-term trends, while a lower period means it will respond more to short-term fluctuations in the data.
Smoothing Process: In this script, the Butterworth Filter is calculated recursively using the following formula,
butterworth_filter(series float input, int period) =>
float wc = math.tan(math.pi / period)
float k1 = 1.414 * wc
float k2 = wc * wc
float a0 = k2 / (1 + k1 + k2)
float a1 = 2 * a0
float a2 = a0
float b1 = 2 * (k2 - 1) / (1 + k1 + k2)
float b2 = (1 - k1 + k2) / (1 + k1 + k2)
wc: This is the angular frequency, derived from the period input.
k1 and k2: These are intermediate coefficients used in the filter calculation.
a0, a1, a2: These are the feedforward coefficients, which determine how much of the current and past input values will contribute to the filtered output.
b1, b2: These are feedback coefficients, which determine how much of the past output values will contribute to the current output, effectively allowing the filter to "remember" past behavior and smooth the signal.
Recursive Calculation: The filter operates by taking into account not only the current input value but also the previous two input values and the previous two output values. This recursive nature helps it smooth the signal by blending the recent past data with the current data.
float filtered_value = a0 * input + a1 * prev_input1 + a2 * prev_input2
filtered_value -= b1 * prev_output1 + b2 * prev_output2
input: The current input value, which could be the trigger value in this case.
prev_input1, prev_input2: The previous two input values.
prev_output1, prev_output2: The previous two output values.
This means the current filtered value is determined by the combination of:
A weighted sum of the current input and the last two inputs.
A correction based on the last two output values to ensure smoothness and remove noise.
In conclusion when filter is enabled, the Butterworth Filter smooths the RSI and Stochastic values to reduce market noise and highlight significant momentum shifts.
The filtered trigger value (post-Butterworth) provides a cleaner representation of the market's momentum.
Cross Signals for Trade Entries:
Buy Signal: A bullish crossover of the K value above the D value, particularly when the values are below 40 and when the Stochastic trigger is below 1 and the filtered trigger is below 35.
Sell Signal: A bearish crossunder of the K value below the D value, particularly when the values are above 60 and when the Stochastic trigger is above 99 and the filtered trigger is above 90.
These signals are plotted visually on the chart for easy identification of potential trading opportunities.
Overbought and Oversold Zones:
The indicator highlights the overbought zone when the filtered trigger surpasses a specific threshold (typically above 100) and the oversold zone when it drops below 0.
The color-coded fill areas between the Stochastic and trigger lines help visualize when the market may be overbought (likely a reversal down) or oversold (potential reversal up).
🔶 Disclaimer
Use with Caution: This indicator is provided for educational and informational purposes only and should not be considered as financial advice. Users should exercise caution and perform their own analysis before making trading decisions based on the indicator's signals.
Not Financial Advice: The information provided by this indicator does not constitute financial advice, and the creator (UAlgo) shall not be held responsible for any trading losses incurred as a result of using this indicator.
Backtesting Recommended: Traders are encouraged to backtest the indicator thoroughly on historical data before using it in live trading to assess its performance and suitability for their trading strategies.
Risk Management: Trading involves inherent risks, and users should implement proper risk management strategies, including but not limited to stop-loss orders and position sizing, to mitigate potential losses.
No Guarantees: The accuracy and reliability of the indicator's signals cannot be guaranteed, as they are based on historical price data and past performance may not be indicative of future results.

Sinc Bollinger BandsKaiser Windowed Sinc Bollinger Bands Indicator
The Kaiser Windowed Sinc Bollinger Bands indicator combines the advanced filtering capabilities of the Kaiser Windowed Sinc Moving Average with the volatility measurement of Bollinger Bands. This indicator represents a sophisticated approach to trend identification and volatility analysis in financial markets.
Core Components
At the heart of this indicator is the Kaiser Windowed Sinc Moving Average, which utilizes the sinc function as an ideal low-pass filter, windowed by the Kaiser function. This combination allows for precise control over the frequency response of the moving average, effectively separating trend from noise in price data.
The sinc function, representing an ideal low-pass filter, provides the foundation for the moving average calculation. By using the sinc function, analysts can independently control two critical parameters: the cutoff frequency and the number of samples used. The cutoff frequency determines which price movements are considered significant (low frequency) and which are treated as noise (high frequency). The number of samples influences the filter's accuracy and steepness, allowing for a more precise approximation of the ideal low-pass filter without altering its fundamental frequency response characteristics.
The Kaiser window is applied to the sinc function to create a practical, finite-length filter while minimizing unwanted oscillations in the frequency domain. The alpha parameter of the Kaiser window allows users to fine-tune the trade-off between the main-lobe width and side-lobe levels in the frequency response.
Bollinger Bands Implementation
Building upon the Kaiser Windowed Sinc Moving Average, this indicator adds Bollinger Bands to provide a measure of price volatility. The bands are calculated by adding and subtracting a multiple of the standard deviation from the moving average.
Advanced Centered Standard Deviation Calculation
A unique feature of this indicator is its specialized standard deviation calculation for the centered mode. This method employs the Kaiser window to create a smooth deviation that serves as an highly effective envelope, even though it's always based on past data.
The centered standard deviation calculation works as follows:
It determines the effective sample size of the Kaiser window.
The window size is then adjusted to reflect the target sample size.
The source data is offset in the calculation to allow for proper centering.
This approach results in a highly accurate and smooth volatility estimation. The centered standard deviation provides a more refined and responsive measure of price volatility compared to traditional methods, particularly useful for historical analysis and backtesting.
Operational Modes
The indicator offers two operational modes:
Non-Centered (Real-time) Mode: Uses half of the windowed sinc function and a traditional standard deviation calculation. This mode is suitable for real-time analysis and current market conditions.
Centered Mode: Utilizes the full windowed sinc function and the specialized Kaiser window-based standard deviation calculation. While this mode introduces a delay, it offers the most accurate trend and volatility identification for historical analysis.
Customizable Parameters
The Kaiser Windowed Sinc Bollinger Bands indicator provides several key parameters for customization:
Cutoff: Controls the filter's cutoff frequency, determining the divide between trends and noise.
Number of Samples: Sets the number of samples used in the FIR filter calculation, affecting the filter's accuracy and computational complexity.
Alpha: Influences the shape of the Kaiser window, allowing for fine-tuning of the filter's frequency response characteristics.
Standard Deviation Length: Determines the period over which volatility is calculated.
Multiplier: Sets the number of standard deviations used for the Bollinger Bands.
Centered Alpha: Specific to the centered mode, this parameter affects the Kaiser window used in the specialized standard deviation calculation.
Visualization Features
To enhance the analytical value of the indicator, several visualization options are included:
Gradient Coloring: Offers a range of color schemes to represent trend direction and strength for the moving average line.
Glow Effect: An optional visual enhancement for improved line visibility.
Background Fill: Highlights the area between the Bollinger Bands, aiding in volatility visualization.
Applications in Technical Analysis
The Kaiser Windowed Sinc Bollinger Bands indicator is particularly useful for:
Precise trend identification with reduced noise influence
Advanced volatility analysis, especially in the centered mode
Identifying potential overbought and oversold conditions
Recognizing periods of price consolidation and potential breakouts
Compared to traditional Bollinger Bands, this indicator offers superior frequency response characteristics in its moving average and a more refined volatility measurement, especially in centered mode. These features allow for a more nuanced analysis of price trends and volatility patterns across various market conditions and timeframes.
Conclusion
The Kaiser Windowed Sinc Bollinger Bands indicator represents a significant advancement in technical analysis tools. By combining the ideal low-pass filter characteristics of the sinc function, the practical benefits of Kaiser windowing, and an innovative approach to volatility measurement, this indicator provides traders and analysts with a sophisticated instrument for examining price trends and market volatility.
Its implementation in Pine Script contributes to the TradingView community by making advanced signal processing and statistical techniques accessible for experimentation and further development in technical analysis. This indicator serves not only as a practical tool for market analysis but also as an educational resource for those interested in the intersection of signal processing, statistics, and financial markets.
Related:
Sinc MAKaiser Windowed Sinc Moving Average Indicator
The Kaiser Windowed Sinc Moving Average is an advanced technical indicator that combines the sinc function with the Kaiser window to create a highly customizable finite impulse response (FIR) filter for financial time series analysis.
Sinc Function: The Ideal Low-Pass Filter
At the core of this indicator is the sinc function, which represents the impulse response of an ideal low-pass filter. In signal processing and technical analysis, the sinc function is crucial because it allows for the creation of filters with precise frequency cutoff characteristics. When applied to financial data, this means the ability to separate long-term trends from short-term fluctuations with remarkable accuracy.
The primary advantage of using a sinc-based filter is the independent control over two critical parameters: the cutoff frequency and the number of samples used. The cutoff frequency, analogous to the "length" in traditional moving averages, determines which price movements are considered significant (low frequency) and which are treated as noise (high frequency). By adjusting the cutoff, analysts can fine-tune the filter to respond to specific market cycles or timeframes of interest.
The number of samples used in the filter doesn't affect the cutoff frequency but instead influences the filter's accuracy and steepness. Increasing the sample size results in a better approximation of the ideal low-pass filter, leading to sharper transitions between passed and attenuated frequencies. This allows for more precise trend identification and noise reduction without changing the fundamental frequency response characteristics.
Kaiser Window: Optimizing the Sinc Filter
While the sinc function provides excellent frequency domain characteristics, it has infinite length in the time domain, which is impractical for real-world applications. This is where the Kaiser window comes into play. By applying the Kaiser window to the sinc function, we create a finite-length filter that approximates the ideal response while minimizing unwanted oscillations (known as the Gibbs phenomenon) in the frequency domain.
The Kaiser window introduces an additional parameter, alpha, which controls the trade-off between the main-lobe width and side-lobe levels in the frequency response. This parameter allows users to fine-tune the filter's behavior, balancing between sharp cutoffs and minimal ripple effects.
Customizable Parameters
The Kaiser Windowed Sinc Moving Average offers several key parameters for customization:
Cutoff: Controls the filter's cutoff frequency, determining the divide between trends and noise.
Length: Sets the number of samples used in the FIR filter calculation, affecting the filter's accuracy and computational complexity.
Alpha: Influences the shape of the Kaiser window, allowing for fine-tuning of the filter's frequency response characteristics.
Centered and Non-Centered Modes
The indicator provides two operational modes:
Non-Centered (Real-time) Mode: Uses half of the windowed sinc function, suitable for real-time analysis and current market conditions.
Centered Mode: Utilizes the full windowed sinc function, resulting in a zero-phase filter. This mode introduces a delay but offers the most accurate trend identification for historical analysis.
Visualization Features
To enhance the analytical value of the indicator, several visualization options are included:
Gradient Coloring: Offers a range of color schemes to represent trend direction and strength.
Glow Effect: An optional visual enhancement for improved line visibility.
Background Fill: Highlights the area between the moving average and price, aiding in trend visualization.
Applications in Technical Analysis
The Kaiser Windowed Sinc Moving Average is particularly useful for precise trend identification, cycle analysis, and noise reduction in financial time series. Its ability to create custom low-pass filters with independent control over cutoff and filter accuracy makes it a powerful tool for analyzing various market conditions and timeframes.
Compared to traditional moving averages, this indicator offers superior frequency response characteristics and reduced lag in trend identification when properly tuned. It provides greater flexibility in filter design, allowing analysts to create moving averages tailored to specific trading strategies or market behaviors.
Conclusion
The Kaiser Windowed Sinc Moving Average represents an advanced approach to price smoothing and trend identification in technical analysis. By making the ideal low-pass filter characteristics of the sinc function practically applicable through Kaiser windowing, this indicator provides traders and analysts with a sophisticated tool for examining price trends and cycles.
Its implementation in Pine Script contributes to the TradingView community by making advanced signal processing techniques accessible for experimentation and further development in technical analysis. This indicator serves not only as a practical tool for market analysis but also as an educational resource for those interested in the intersection of signal processing and financial markets.
Related script:

Ehlers Band-Pass FilterHeyo,
This indicator is an original translation from Ehlers' book "Cycle Analytics for Traders Advanced".
First, I describe the indicator as usual and later you can find a very insightful quote of the book.
Key Features
Signal Line: Represents the output of the band-pass filter, highlighting the dominant cycle in the data.
Trigger Line: A leading indicator derived from the signal line, providing early signals for potential market reversals.
Dominant Cycle: Measures the dominant cycle period by counting the number of bars between zero crossings of the band-pass filter output.
Calculation:
The band-pass filter is implemented using a combination of high-pass and low-pass filters.
The filter's parameters, such as period and bandwidth, can be adjusted to tune the filter to specific market cycles.
The signal line is normalized using an Automatic Gain Control (AGC) to provide consistent amplitude regardless of price swings.
The trigger line is derived by applying a high-pass filter to the signal line, creating a leading
waveform.
Usage
The indicator is effective in identifying peaks and valleys in the market data.
It works best in cyclic market conditions and may produce false signals during trending periods.
The dominant cycle measurement helps traders understand the prevailing market cycle length, aiding in better decision-making.
Quoted from the Book
Band-Pass Filters
“A little of the data narrowly passed,” said Tom broadly.
Perhaps the least appreciated and most underutilized filter in technical analysis is the band-pass filter. The band-pass filter simultaneously diminishes the amplitude at low frequencies, qualifying it as a detrender, and diminishes the amplitude at high frequencies, qualifying it as a data smoother.
It passes only those frequency components from input to output in which the trader is interested. The filtering produced by a band-pass filter is superior because the rejection in the stop bands is related to its bandwidth. The degree of rejection of undesired frequency components is called selectivity. The band-stop filter is the dual of the band-pass filter. It rejects a band of frequency components as a notch at the output and passes all other frequency components virtually unattenuated. Since the bandwidth of the deep rejection in the notch is relatively narrow and since the spectrum of market cycles is relatively broad due to systemic noise, the band-stop filter has little application in trading.
Measuring the Cycle Period
The band-pass filter can be used as a relatively simple measurement of the dominant cycle.
A cycle is complete when the waveform crosses zero two times from the last zero crossing. Therefore, each successive zero crossing of the indicator marks a half cycle period. We can establish the dominant cycle period as twice the spacing between successive zero crossings.
When we measure the dominant cycle period this way, it is best to widen the pass band of the band-pass filter to avoid distorting the measurement simply due to the selectivity of the filter. Using an input bandwidth of 0.7 produces an octave-wide pass band. For example, if the center period of the filter is 20 and the relative bandwidth is 0.7, the bandwidth is 14. That means the pass band of the filter extends from 13-bar periods to 27-bar periods.
That is, roughly an octave exists because the longest period is twice the shortest period of the pass band. It is imperative that a high-pass filter is tuned one octave below the half-bandwidth edge of the band-pass filter to ensure a nominal zero mean of the filtered output. Without a zero mean, the zero crossings can have a substantial error.
Since the measurement of the dominant cycle can vary dramatically from zero crossing to zero
crossing, the code limits the change between measurements to be no more than 25 percent.
While measuring the changing dominant cycle period via zero crossings of the band-pass waveform is easy, it is not necessarily the most accurate method.
Best regards,
simwai
Good Luck with your trading! 🙌

Biquad Low Pass FilterThis indicator utilizes a biquad low pass filter to smooth out price data, helping traders identify trends and reduce noise in their analysis.
The Length parameter acts as the length of the moving average, determining the smoothness and responsiveness of the filter. Adjusting this parameter changes how quickly the filter reacts to price changes.
The Q Factor controls the sharpness of the filter. A higher Q value results in a narrower frequency band, enhancing the precision of the filter. However, be cautious when setting the Q factor too high, as it can induce resonance, amplifying certain frequencies and potentially making the filter less effective by introducing noise.
Key Features of Biquad Filters
Biquad filters are a type of digital filter that provides a combination of low-pass, high-pass, band-pass, and notch filtering capabilities. In this implementation, the biquad filter is configured as a low pass filter, which allows low-frequency signals to pass while attenuating higher-frequency noise. This is particularly useful in trading to smooth out price data, making it easier to spot underlying trends and patterns.
Biquad filters are known for their smooth response and minimal phase distortion, making them ideal for technical analysis. The customizable length and Q factor allow for flexible adaptation to different trading strategies and market conditions. Designed for real-time charting, the biquad filter operates efficiently without significant lag, ensuring timely analysis.
By incorporating this biquad low pass filter into your trading toolkit, you can enhance your chart analysis with clearer insights into price movements, leading to more informed trading decisions.

Filtered MACD with Backtest [UAlgo]The "Filtered MACD with Backtest " indicator is an advanced trading tool designed for the TradingView platform. It combines the Moving Average Convergence Divergence (MACD) with additional filters such as Moving Average (MA) and Average Directional Index (ADX) to enhance trading signals. This indicator aims to provide more reliable entry and exit points by filtering out noise and confirming trends. Additionally, it includes a comprehensive backtesting module to simulate trading strategies and assess their performance based on historical data. The visual backtest module allows traders to see potential trades directly on the chart, making it easier to evaluate the effectiveness of the strategy.
🔶 Customizable Parameters :
Price Source Selection: Users can choose their preferred price source for calculations, providing flexibility in analysis.
Filter Parameters:
MA Filter: Option to use a Moving Average filter with types such as EMA, SMA, WMA, RMA, and VWMA, and a customizable length.
ADX Filter: Option to use an ADX filter with adjustable length and threshold to determine trend strength.
MACD Parameters: Customizable fast length, slow length, and signal smoothing for the MACD indicator.
Backtest Module:
Entry Type: Supports "Buy and Sell", "Buy", and "Sell" strategies.
Stop Loss Types: Choose from ATR-based, fixed point, or X bar high/low stop loss methods.
Reward to Risk Ratio: Set the desired take profit level relative to the stop loss.
Backtest Visuals: Display entry, stop loss, and take profit levels directly on the chart with
colored backgrounds.
Alerts: Configurable alerts for buy and sell signals.
🔶 Filtered MACD : Understanding How Filters Work with ADX and MA
ADX Filter:
The Average Directional Index (ADX) measures the strength of a trend. The script calculates ADX using the user-defined length and applies a threshold value.
Trading Signals with ADX Filter:
Buy Signal: A regular MACD buy signal (crossover of MACD line above the signal line) is only considered valid if the ADX is above the set threshold. This suggests a stronger uptrend to potentially capitalize on.
Sell Signal: Conversely, a regular MACD sell signal (crossunder of MACD line below the signal line) is only considered valid if the ADX is above the threshold, indicating a stronger downtrend for potential shorting opportunities.
Benefits: The ADX filter helps avoid whipsaws or false signals that might occur during choppy market conditions with weak trends.
MA Filter:
You can choose from various Moving Average (MA) types (EMA, SMA, WMA, RMA, VWMA) for the filter. The script calculates the chosen MA based on the user-defined length.
Trading Signals with MA Filter:
Buy Signal: A regular MACD buy signal is only considered valid if the closing price is above the MA value. This suggests a potential uptrend confirmed by the price action staying above the moving average.
Sell Signal: Conversely, a regular MACD sell signal is only considered valid if the closing price is below the MA value. This suggests a potential downtrend confirmed by the price action staying below the moving average.
Benefits: The MA filter helps identify potential trend continuation opportunities by ensuring the price aligns with the chosen moving average direction.
Combining Filters:
You can choose to use either the ADX filter, the MA filter, or both depending on your strategy preference. Using both filters adds an extra layer of confirmation for your signals.
🔶 Backtesting Module
The backtesting module in this script allows you to visually assess how the filtered MACD strategy would have performed on historical data. Here's a deeper dive into its features:
Backtesting Type: You can choose to backtest for buy signals only, sell signals only, or both. This allows you to analyze the strategy's effectiveness in different market conditions.
Stop-Loss Types: You can define how stop-loss orders are placed:
ATR (Average True Range): This uses a volatility measure (ATR) multiplied by a user-defined factor to set the stop-loss level.
Fixed Point: This allows you to specify a fixed dollar amount or percentage value as the stop-loss.
X bar High/Low: This sets the stop-loss at a certain number of bars (defined by the user) above/below the bar's high (for long positions) or low (for short positions).
Reward-to-Risk Ratio: Define the desired ratio between your potential profit and potential loss on each trade. The backtesting module will calculate take-profit levels based on this ratio and the stop-loss placement.
🔶 Disclaimer:
Use with Caution: This indicator is provided for educational and informational purposes only and should not be considered as financial advice. Users should exercise caution and perform their own analysis before making trading decisions based on the indicator's signals.
Not Financial Advice: The information provided by this indicator does not constitute financial advice, and the creator (UAlgo) shall not be held responsible for any trading losses incurred as a result of using this indicator.
Backtesting Recommended: Traders are encouraged to backtest the indicator thoroughly on historical data before using it in live trading to assess its performance and suitability for their trading strategies.
Risk Management: Trading involves inherent risks, and users should implement proper risk management strategies, including but not limited to stop-loss orders and position sizing, to mitigate potential losses.
No Guarantees: The accuracy and reliability of the indicator's signals cannot be guaranteed, as they are based on historical price data and past performance may not be indicative of future results.

Kalman Volume Filter [ChartPrime]The "Kalman Volume Filter" , aims to provide insights into market volume dynamics by filtering out noise and identifying potential overbought or oversold conditions. Let's break down its components and functionality:
Settings:
Users can adjust various parameters to customize the indicator according to their preferences:
Volume Length: Defines the length of the volume period used in calculations.
Stabilization Coefficient (k): Determines the level of noise reduction in the signals.
Signal Line Length: Sets the length of the signal line used for identifying trends.
Overbought & Oversold Zone Level: Specifies the threshold levels for identifying overbought and oversold conditions.
Source: Allows users to select the price source for volume calculations.
Volume Zone Oscillator (VZO):
Calculates a volume-based oscillator indicating the direction and intensity of volume movements.
Utilizes a volume direction measurement over a specified period to compute the oscillator value.
Normalizes the oscillator value to improve comparability across different securities or timeframes.
// VOLUME ZONE OSCILLATOR
VZO(get_src, length) =>
Volume_Direction = get_src > get_src ? volume : -volume
VZO_volume = ta.hma(Volume_Direction, length)
Total_volume = ta.hma(volume, length)
VZO = VZO_volume / (Total_volume)
VZO := (VZO - 0) / ta.stdev(VZO, 200)
VZO
Kalman Filter:
Applies a Kalman filter to smooth out the VZO values and reduce noise.
Utilizes a stabilization coefficient (k) to control the degree of smoothing.
Generates a filtered output representing the underlying volume trend.
// KALMAN FILTER
series float M_n = 0.0 // - the resulting value of the current calculation
series float A_n = VZO // - the initial value of the current measurement
series float M_n_1 = nz(M_n ) // - the resulting value of the previous calculation
float k = input.float(0.06) // - stabilization coefficient
// Kalman Filter Formula
kalm(k)=>
k * A_n + (1 - k) * M_n_1
Volume Visualization:
Displays the volume histogram, with color intensity indicating the strength of volume movements.
Adjusts bar colors based on volume bursts to highlight significant changes in volume.
Overbought and Oversold Zones:
Marks overbought and oversold levels on the chart to assist in identifying potential reversal points.
Plotting:
Plots the Kalman Volume Filter line and a signal line for visual analysis.
Utilizes different colors and fills to distinguish between rising and falling trends.
Highlights specific events such as local buy or sell signals, as well as overbought or oversold conditions.
This indicator provides traders with a comprehensive view of volume dynamics, trend direction, and potential market turning points, aiding in informed decision-making during trading activities.

Kalman Hull Supertrend [BackQuant]Kalman Hull Supertrend
At its core, this indicator uses a Kalman filter of price, put inside of a hull moving average function (replacing the weighted moving averages) and then using that as a price source for the supertrend instead of the normal hl2 (high+low/2).
Therefore, making it more adaptive to price and also sensitive to recent price action.
PLEASE Read the following, knowing what an indicator does at its core before adding it into a system is pivotal. The core concepts can allow you to include it in a logical and sound manner.
1. What is a Kalman Filter
The Kalman Filter is an algorithm renowned for its efficiency in estimating the states of a linear dynamic system amidst noisy data. It excels in real-time data processing, making it indispensable in fields requiring precise and adaptive filtering, such as aerospace, robotics, and financial market analysis. By leveraging its predictive capabilities, traders can significantly enhance their market analysis, particularly in estimating price movements more accurately.
If you would like this on its own, with a more in-depth description please see our Kalman Price Filter.
2. Hull Moving Average (HMA) and Its Core Calculation
The Hull Moving Average (HMA) improves on traditional moving averages by combining the Weighted Moving Average's (WMA) smoothness and reduced lag. Its core calculation involves taking the WMA of the data set and doubling it, then subtracting the WMA of the full period, followed by applying another WMA on the result over the square root of the period's length. This methodology yields a smoother and more responsive moving average, particularly useful for identifying market trends more rapidly.
3. Combining Kalman Filter with HMA
The innovative combination of the Kalman Filter with the Hull Moving Average (KHMA) offers a unique approach to smoothing price data. By applying the Kalman Filter to the price source before its incorporation into the HMA formula, we enhance the adaptiveness and responsiveness of the moving average. This adaptive smoothing method reduces noise more effectively and adjusts more swiftly to price changes, providing traders with clearer signals for market entries or exits.
The calculation is like so:
KHMA(_src, _length) =>
f_kalman(2 * f_kalman(_src, _length / 2) - f_kalman(_src, _length), math.round(math.sqrt(_length)))
4. Integration with Supertrend
Incorporating this adaptive price smoothing technique into the Supertrend indicator further enhances its efficiency. The Supertrend, known for its proficiency in identifying the prevailing market trend and providing clear buy or sell signals, becomes even more powerful with an adaptive price source. This integration allows the Supertrend to adjust more dynamically to market changes, offering traders more accurate and timely trading signals.
5. Application in a Trading System
In a trading system, the Kalman Hull Supertrend indicator can serve as a critical component for identifying market trends and generating signals for potential entry and exit points. Its adaptiveness and sensitivity to price changes make it particularly useful for traders looking to minimize lag in signal generation and improve the accuracy of their market trend analysis. Whether used as a standalone tool or in conjunction with other indicators, its dynamic nature can significantly enhance trading strategies.
6. Core Calculations and Benefits
The core of this indicator lies in its sophisticated filtering and averaging techniques, starting with the Kalman Filter's predictive adjustments, followed by the adaptive smoothing of the Hull Moving Average, and culminating in the trend-detecting capabilities of the Supertrend. This multi-layered approach not only reduces market noise but also adapts to market volatility more effectively. Benefits include improved signal accuracy, reduced lag, and the ability to discern trend changes more promptly, offering traders a competitive edge.
Thus following all of the key points here are some sample backtests on the 1D Chart
Disclaimer: Backtests are based off past results, and are not indicative of the future.
INDEX:BTCUSD
INDEX:ETHUSD
BINANCE:SOLUSD

TASC 2024.04 The Ultimate Smoother█ OVERVIEW
This script presents an implementation of the digital smoothing filter introduced by John Ehlers in his article "The Ultimate Smoother" from the April 2024 edition of TASC's Traders' Tips .
█ CONCEPTS
The UltimateSmoother preserves low-frequency swings in the input time series while attenuating high-frequency variations and noise. The defining input parameter of the UltimateSmoother is the critical period , which represents the minimum wavelength (highest frequency) in the filter's pass band. In other words, the filter attenuates or removes the amplitudes of oscillations at shorter periods than the critical period.
According to Ehlers, one primary advantage of the UltimateSmoother is that it maintains zero lag in its pass band and minimal lag in its transition band, distinguishing it from other conventional digital filters (e.g., moving averages ). One can apply this smoother to various input data series, including other indicators.
█ CALCULATIONS
Ehlers derived the UltimateSmoother using inspiration from the design principles he learned from his experience with analog filters , as described in the original publication. On a technical level, the UltimateSmoother's unique response involves subtracting a high-pass response from an all-pass response . At very low frequencies (lengthy periods), where the high-pass filter response has virtually no amplitude, the subtraction yields a frequency and phase response practically equivalent to the input data. At other frequencies, the subtraction achieves filtration through cancellation due to the close similarities in response between the high-pass filter and the input data.
LTI_FiltersLinear Time-Invariant (LTI) filters are fundamental tools in signal processing that operate with consistent behavior over time and linearly respond to input signals. They are crucial for analyzing and manipulating signals in various applications, ensuring the output signal's integrity is maintained regardless of when an input is applied or its magnitude. The Windowed Sinc filter is a specific type of LTI filter designed for digital signal processing. It employs a Sinc function, ideal for low-pass filtering, truncated and shaped within a finite window to make it practically implementable. This process involves multiplying the Sinc function by a window function, which tapers off towards the ends, making the filter finite and suitable for digital applications. Windowed Sinc filters are particularly effective for tasks like data smoothing and removing unwanted frequency components, balancing between sharp cutoff characteristics and minimal distortion. The efficiency of Windowed Sinc filters in digital signal processing lies in their adept use of linear algebra, particularly in the convolution process, which combines input data with filter coefficients to produce the desired output. This mathematical foundation allows for precise control over the filtering process, optimizing the balance between filtering performance and computational efficiency. By leveraging linear algebra techniques such as matrix multiplication and Toeplitz matrices, these filters can efficiently handle large datasets and complex filtering tasks, making them invaluable in applications requiring high precision and speed, such as audio processing, financial signal analysis, and image restoration.
Library "LTI_Filters"
offset(length, enable)
Calculates the time offset required for aligning the output of a filter with its input, based on the filter's length. This is useful for centered filters where the output is naturally shifted due to the filter's operation.
Parameters:
length (simple int) : The length of the filter.
enable (simple bool) : A boolean flag to enable or dissable the offset calculation.
Returns: The calculated offset if enabled; otherwise, returns 0.
lti_filter(filter_type, source, length, prefilter, centered, fc, window_type)
General-purpose Linear Time-Invariant (LTI) filter function that can apply various filter types to a data series. Can be used to apply a variety of LTI filters with different characteristics to financial data series or other time series data.
Parameters:
filter_type (simple string) : Specifies the type of filter. ("Sinc", "SMA", "WMA")
source (float) : The input data series to filter.
length (simple int) : The length of the filter.
prefilter (simple bool) : Boolean indicating whether to prefilter the input data.
centered (simple bool) : Determines whether the filter coefficients are centered.
fc (simple float) : Filter cutoff. Expressed like a length.
window_type (simple string) : Type of window function to apply. ("Hann", "Hamming", "Blackman", "Triangular", "Lanczos", "None")
Returns: The filtered data series.
lti_sma(source, length, prefilter)
Applies a Simple Moving Average (SMA) filter to the data series. Useful for smoothing data series to identify trends or for use as a component in more complex indicators.
Parameters:
source (float) : The input data series to filter.
length (simple int) : The length of the SMA filter.
prefilter (simple bool) : Boolean indicating whether to prefilter the input data.
Returns: The SMA-filtered data series.
lti_wma(source, length, prefilter, centered)
Applies a Weighted Moving Average (WMA) filter to a data series. Ideal for smoothing data with emphasis on more recent values, allowing for dynamic adjustments to the weighting scheme.
Parameters:
source (float) : The input data series to filter.
length (simple int) : The length of the WMA filter.
prefilter (simple bool) : Boolean indicating whether to prefilter the input data.
centered (simple bool) : Determines whether the filter coefficients are centered.
Returns: The WMA-filtered data series.
lti_sinc(source, length, prefilter, centered, fc, window_type)
Applies a Sinc filter to a data series, optionally using a window function. Particularly useful for signal processing tasks within financial analysis, such as smoothing or trend identification, with the ability to fine-tune filter characteristics.
Parameters:
source (float) : The input data series to filter.
length (simple int) : The length of the Sinc filter.
prefilter (simple bool) : Boolean indicating whether to prefilter the input data.
centered (simple bool) : Determines whether the filter coefficients are centered.
fc (simple float) : Filter cutoff. Expressed like a length.
window_type (simple string) : Type of window function to apply. ("Hann", "Hamming", "Blackman", "Triangular", "Lanczos", "None")
Returns: The Sinc-filtered data series.
PhiSmoother Moving Average Ribbon [ChartPrime]DSP FILTRATION PRIMER:
DSP (Digital Signal Processing) filtration plays a critical role with financial indication analysis, involving the application of digital filters to extract actionable insights from data. Its primary trading purpose is to distinguish and isolate relevant signals separate from market noise, allowing traders to enhance focus on underlying trends and patterns. By smoothing out price data, DSP filters aid with trend detection, facilitating the formulation of more effective trading techniques.
Additionally, DSP filtration can play an impactful role with detecting support and resistance levels within financial movements. By filtering out noise and emphasizing significant price movements, identifying key levels for entry and exit points become more apparent. Furthermore, DSP methods are instrumental in measuring market volatility, enabling traders to assess volatility levels with improved accuracy.
In summary, DSP filtration techniques are versatile tools for traders and analysts, enhancing decision-making processes in financial markets. By mitigating noise and highlighting relevant signals, DSP filtration improves the overall quality of trading analysis, ultimately leading to better conclusions for market participants.
APPLYING FIR FILTERS:
FIR (Finite Impulse Response) filters are indispensable tools in the realm of financial analysis, particularly for trend identification and characterization within market data. These filters effectively smooth out price fluctuations and noise, enabling traders to discern underlying trends with greater fidelity. By applying FIR filters to price data, robust trading strategies can be developed with grounded trend-following principles, enhancing their ability to capitalize on market movements.
Moreover, FIR filter applications extend into wide-ranging utility within various fields, one being vital for informed decision-making in analysis. These filters help identify critical price levels where assets may tend to stall or reverse direction, providing traders with valuable insights to aid with identification of optimal entry and exit points within their indicator arsenal. FIRs are undoubtedly a cornerstone to modern trading innovation.
Additionally, FIR filters aid in volatility measurement and analysis, allowing traders to gauge market volatility accurately and adjust their risk management approaches accordingly. By incorporating FIR filters into their analytical arsenal, traders can improve the quality of their decision-making processes and achieve better trading outcomes when contending with highly dynamic market conditions.
INTRODUCTORY DEBUT:
ChartPrime's " PhiSmoother Moving Average Ribbon " indicator aims to mark a significant advancement in technical analysis methodology by removing unwanted fluctuations and disturbances while minimizing phase disturbance and lag. This indicator introduces PhiSmoother, a powerful FIR filter in it's own right comparable to Ehlers' SuperSmoother.
PhiSmoother leverages a custom tailored FIR filter to smooth out price fluctuations by mitigating aliasing noise problematic to identification of underlying trends with accuracy. With adjustable parameters such as phase control, traders can fine-tune the indicator to suit their specific analytical needs, providing a flexible and customizable solution.
Mathemagically, PhiSmoother incorporates various color coding preferences, enabling traders to visualize trends more effectively on a volatile landscape. Whether utilizing progression, chameleon, or binary color schemes, you can more fluidly interpret market dynamics and make informed visual decisions regarding entry and exit points based on color-coded plotting.
The indicator's alert system further enhances its utility by providing notifications of specifically chosen filter crossings. Traders can customize alert modes and messages while ensuring they stay informed about potential opportunities aligned with their trading style.
Overall, the "PhiSmoother Moving Average Ribbon" visually stands out as a revolutionary mechanism for technical analysis, offering traders a comprehensive solution for trend identification, visualization, and alerting within financial markets to achieve advantageous outcomes.
NOTEWORTHY SETTINGS FEATURES:
Price Source Selection - The indicator offers flexibility in choosing the price source for analysis. Traders can select from multiple options.
Phase Control Parameter - One of the notable standout features of this indicator is the phase control parameter. Traders can fine-tune the phase or lag of the indicator to adapt it to different market conditions or timeframes. This feature enables optimization of the indicator's responsiveness to price movements and align it with their specific trading tactics.
Coloring Preferences - Another magical setting is the coloring features, one being "Chameleon Color Magic". Traders can customize the color scheme of the indicator based on their visual preferences or to improve interpretation. The indicator offers options such as progression, chameleon, or binary color schemes, all having versatility to dynamically visualize market trends and patterns. Two colors may be specifically chosen to reduce overlay indicator interference while also contrasting for your visual acuity.
Alert Controls - The indicator provides diverse alert controls to manage alerts for specific market events, depending on their trading preferences.
Alertable Crossings: Receive an alert based on selectable predefined crossovers between moving average neighbors
Customizable Alert Messages: Traders can personalize alert messages with preferred information details
Alert Frequency Control: The frequency of alerts is adjustable for maximum control of timely notifications

Table to filter trades per dayThis script contains a block of code that allows users to filter the total number of trades, loss trades, win trades and win rate per day in a table. This makes it easier to compare which days were profitable and which were not.
Be aware that this script can only be used in strategy scripts. To use the script, open it and copy every line from "START" to "STOP". Then, paste these lines at the very bottom of the strategy script that you want to attach it to.
The user has the ability to adjust the position of the table and customize the size of the text displayed.
If the user sets "Check when the trade:" to "Opened", the script will monitor when the trade opens and add it to the table once it has been closed. If "Check when the trade:" is set to "Closed", the script will track when the trade is closed and add it to the table once it has been closed.
It is recommended to run the script on the "Exchange" setting for more accurate results, even though a "Set the timezone" option is available. This will prevent discrepancies caused by daylight saving time changes.
Please note that the code will only work properly if you choose a daily timeframe or lower.

FunctionsLibrary "Functions"
half_candle()
Half Candles
Returns: half candles (difference between open and close)
super_smoother(source, len)
Ehlers Super Smoother
Parameters:
source (float) : Source
len (int)
Returns: super smoothed moving average
quotient(length, K)
Ehlers early onset trend
Parameters:
length (int) : Length (default = 1)
K (float) : Factor (default = 0.8)
Returns: Ehlers early onset trend
butterworth_2Pole(src, length)
Ehlers 2 Pole Butterworth Filter
Parameters:
src (float) : Source
length (int) : Length
Returns: Ehlers 2 Pole Butterworth Filter
hann_ma(src, length)
Ehler's Hann Moving Average
Parameters:
src (float) : Source
length (int) : Length
Returns: Ehler's Hann Moving Average
oef(src)
Ehlers Optimum Elliptic Filter
Parameters:
src (float) : Source
Returns: Ehlers Optimum Elliptic Filter
moef(src)
Ehlers Modified Optimum Elliptic Filter
Parameters:
src (float) : Source
Returns: Ehlers Modified Optimum Elliptic Filter
arsi(src, length)
Advanced RSI
Parameters:
src (float) : Source
length (simple int) : Length (default = 14)
Returns: ARSI
smoothrng(src, length, multi)
Smooth Range
Parameters:
src (float) : Source
length (simple int) : Length
multi (float) : Multiplikator (default 3.0)
Returns: Smooth Range

chrono_utilsLibrary "chrono_utils"
📝 Description
Collection of objects and common functions that are related to datetime windows session days and time ranges. The main purpose of this library is to handle time-related functionality and make it easy to reason about a future bar checking if it will be part of a predefined session and/or inside a datetime window. All existing session functionality I found in the documentation e.g. "not na(time(timeframe, session, timezone))" are not suitable for strategy scripts, since the execution of the orders is delayed by one bar, due to the script execution happening at the bar close. Moreover, a history operator with a negative value that looks forward is not allowed in any pinescript expression. So, a prediction for the next bar using the bars_back argument of "time()"" and "time_close()" was necessary. Thus, I created this library to overcome this small but very important limitation. In the meantime, I added useful functionality to handle session-based behavior. An interesting utility that emerged from this development is data anomaly detection where a comparison between the prediction and the actual value is happening. If those two values are different then a data inconsistency happens between the prediction bar and the actual bar (probably due to a holiday, half session day, a timezone change etc..)
🤔 How to Guide
To use the functionality this library provides in your script you have to import it first!
Copy the import statement of the latest release by pressing the copy button below and then paste it into your script. Give a short name to this library so you can refer to it later on. The import statement should look like this:
import jason5480/chrono_utils/2 as chr
To check if a future bar will be inside a window first of all you have to initialize a DateTimeWindow object.
A code example is the following:
var dateTimeWindow = chr.DateTimeWindow.new().init(fromDateTime = timestamp('01 Jan 2023 00:00'), toDateTime = timestamp('01 Jan 2024 00:00'))
Then you have to "ask" the dateTimeWindow if the future bar defined by an offset (default is 1 that corresponds th the next bar), will be inside that window:
// Filter bars outside of the datetime window
bool dateFilterApproval = dateTimeWindow.is_bar_included()
You can visualize the result by drawing the background of the bars that are outside the given window:
bgcolor(color = dateFilterApproval ? na : color.new(color.fuchsia, 90), offset = 1, title = 'Datetime Window Filter')
In the same way, you can "ask" the Session if the future bar defined by an offset it will be inside that session.
First of all, you should initialize a Session object.
A code example is the following:
var sess = chr.Session.new().from_sess_string(sess = '0800-1700:23456', refTimezone = 'UTC')
Then check if the given bar defined by the offset (default is 1 that corresponds th the next bar), will be inside the session like that:
// Filter bars outside the sessions
bool sessionFilterApproval = view.sess.is_bar_included()
You can visualize the result by drawing the background of the bars that are outside the given session:
bgcolor(color = sessionFilterApproval ? na : color.new(color.red, 90), offset = 1, title = 'Session Filter')
In case you want to visualize multiple session ranges you can create a SessionView object like that:
var view = SessionView.new().init(SessionDays.new().from_sess_string('2345'), array.from(SessionTimeRange.new().from_sess_string('0800-1600'), SessionTimeRange.new().from_sess_string('1300-2200')), array.from('London', 'New York'), array.from(color.blue, color.orange))
and then call the draw method of the SessionView object like that:
view.draw()
🏋️♂️ Please refer to the "EXAMPLE DATETIME WINDOW FILTER" and "EXAMPLE SESSION FILTER" regions of the script for more advanced code examples of how to utilize the full potential of this library, including user input settings and advanced visualization!
⚠️ Caveats
As I mentioned in the description there are some cases that the prediction of the next bar is not accurate. A wrong prediction will affect the outcome of the filtering. The main reasons this could happen are the following:
Public holidays when the market is closed
Half trading days usually before public holidays
Change in the daylight saving time (DST)
A data anomaly of the chart, where there are missing and/or inconsistent data.
A bug in this library (Please report by PM sending the symbol, timeframe, and settings)
Special thanks to @robbatt and @skinra for the constructive feedback 🏆. Without them, the exposed API of this library would be very lengthy and complicated to use. Thanks to them, now the user of this library will be able to get the most, with only a few lines of code!

two_ma_logicLibrary "two_ma_logic"
The core logic for the two moving average strategy that is used as an example for the internal logic of
the "Template Trailing Strategy" and the "Two MA Signal Indicator"
ma(source, maType, length)
ma - Calculate the moving average of the given source for the given length and type of the average
Parameters:
source (float) : - The source of the values
maType (simple string) : - The type of the moving average
length (simple int) : - The length of the moving average
Returns: - The resulted value of the calculations of the moving average
getDealConditions(drawings, longDealsEnabled, shortDealsEnabled, endDealsEnabled, cnlStartDealsEnabled, cnlEndDealsEnabled, emaFilterEnabled, emaAtrBandEnabled, adxFilterEnabled, adxSmoothing, diLength, adxThreshold)
Parameters:
drawings (TwoMaDrawings)
longDealsEnabled (simple bool)
shortDealsEnabled (simple bool)
endDealsEnabled (simple bool)
cnlStartDealsEnabled (simple bool)
cnlEndDealsEnabled (simple bool)
emaFilterEnabled (simple bool)
emaAtrBandEnabled (simple bool)
adxFilterEnabled (simple bool)
adxSmoothing (simple int)
diLength (simple int)
adxThreshold (simple float)
TwoMaDrawings
Fields:
fastMA (series__float)
slowMA (series__float)
emaLine (series__float)
emaUpperBand (series__float)
emaLowerBand (series__float)
