Earnings Move Radar (E+1 & E+2)Stop guessing earnings reactions. See them. Count them. Use them.
Earnings Move Radar turns every earnings release into a clear visual story on your chart.
What it does for you
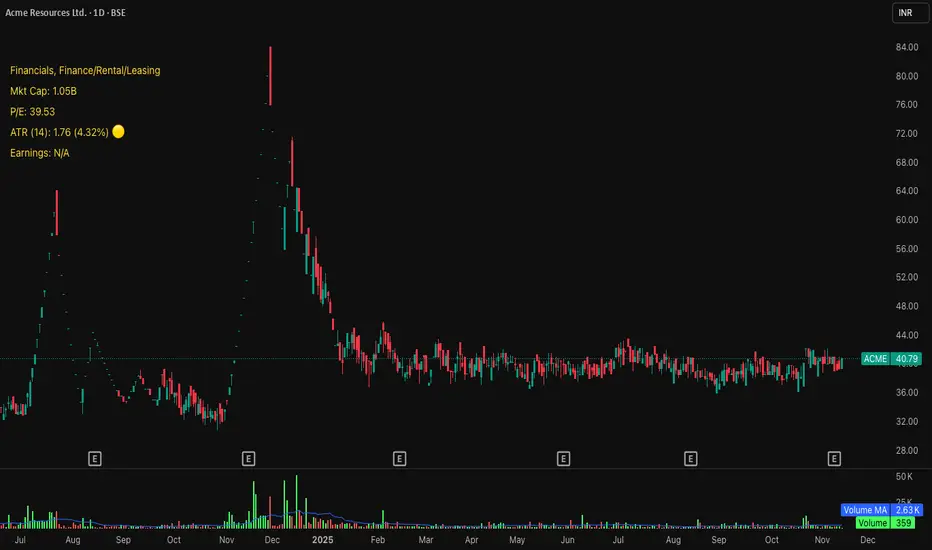
Automatically marks the first and second trading day after each earnings (E+1 & E+2).
Shows at a glance whether the move came from a gap, an intraday trend, or a follow-through / reversal on the next day.
Packs all past earnings into a compact stats panel so you instantly know:
how big earnings moves usually are,
how often they close up vs. down,
how common your “big move” threshold really is.
Highlights simple, practical patterns like “two-day runs” and “three-day runs” around earnings that many traders care about but rarely measure.
Why traders like it
Saves time: no more clicking through old earnings dates one by one.
Puts realistic numbers behind your option ideas and post-earnings plays.
Works on any stock or ETF with earnings data, with a customizable look-back window.
All labels and the stats table are shown in Chinese, making it very friendly for Chinese-speaking traders.
How to use
Apply it to a daily chart of the stock or ETF you trade.
Scan the labels to understand how the market usually reacts to earnings for this symbol.
Use the stats panel to size your risk and define what “normal”, “large” and “extreme” earnings moves mean for you.
This indicator is an analytical tool, not a signal generator. It does not provide financial advice.
مؤشر Pine Script®