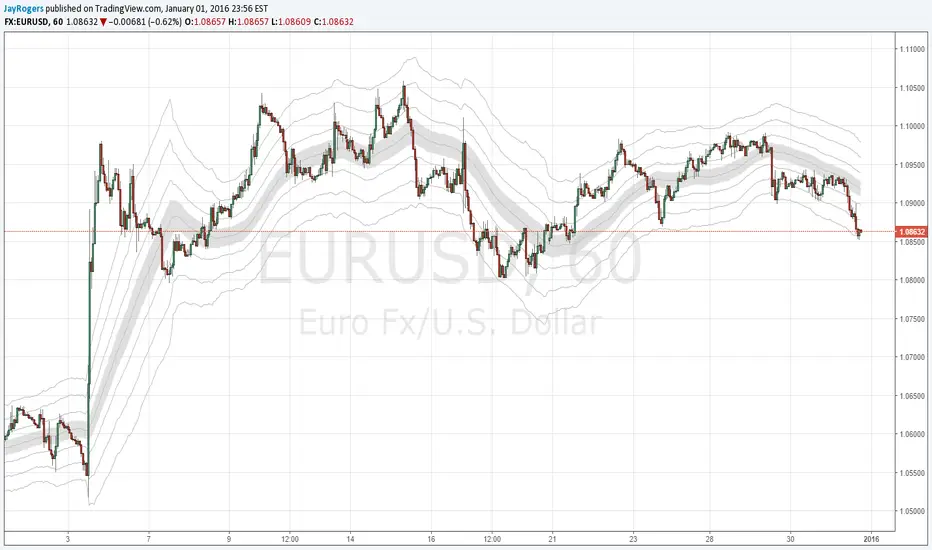
High-Low Difference Channels r2About:
I developed the original as an experiment to potentially replace or augment my BB and RSI based strategies. After some back-testing I could see some really interesting results but it wasn't quite where I wanted it, so after some tweaking and further back-testing, and adding in more MA options, here we are. Mostly tested on 1h and greater time-frames using default settings.
Description / Usage:
Adjust length and multiplier much the same way you would expect with Bollinger Bands.
Multiplier of 1 gives you a base channel consisting of one high, and one low sourced MA
The outer channels are increments of the base high-low channel width, away from the hl2 sourced MA
r2 Changes:
Increased amount of up/down channels to 5, and lowered multiplier default to 1 (previously 1.5)
Tweaked default colour scheme.
Pick your MA poison of choice! Added choices for all your common MA variants.
Issues:
VWMA bugs out and refuses to draw sometimes - no idea why.
Additional Notes:
All MA variants available in this script were derived directly from the sources of those available within the pine editor. I have been fairly diligent trying to ensure they all function correctly, but I can't 100% guarantee it, so if anyone gives the script a try, or dives into the code and see's something odd - don't hesitate to let me know!
It would also be fantastic to hear feedback from anyone who finds use for this, to augment an existing strategy/idea, or develop something new. :)
HIGH-LOW
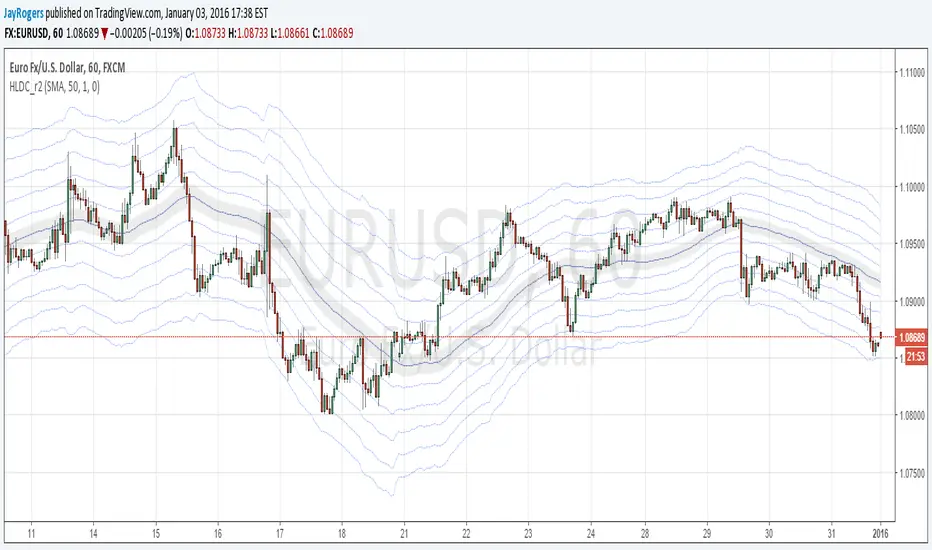
High-Low Difference Channels - SMA/EMAI wrote this up as a potential replacement for my BB based strategies, and so far it's looking pretty nice.
Description / Usage:
Adjust length and multiplier much the same way you would expect with Bollinger Bands.
Multiplier of 1 gives you a base channel consisting of one high, and one low sourced SMA (or EMA)
The outer channels are increments of the base channels width, away from the median hl2 sourced SMA (..or EMA)
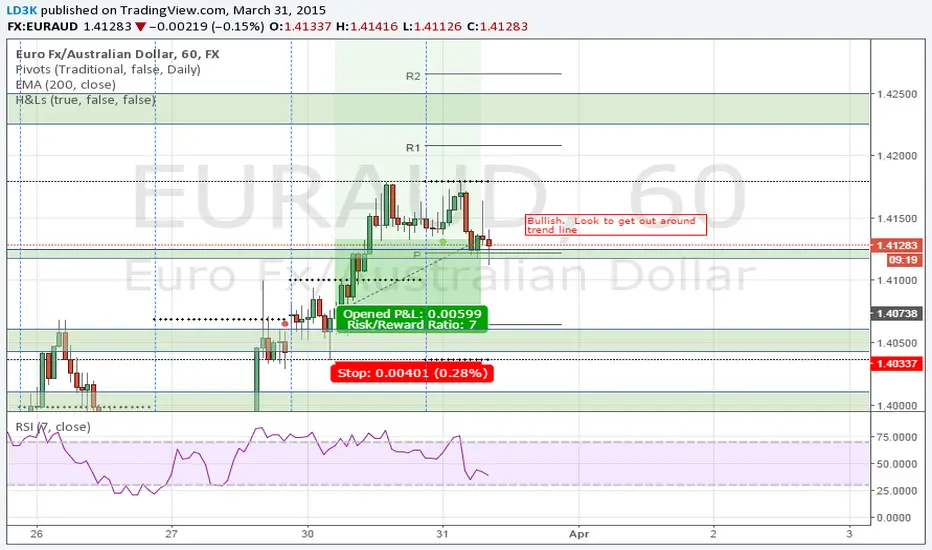
CamarillaStrategy -V1 - H4 and L4 breakout - exits addedExits added using trailing stops.
2.6 Profit Factor and 76% Profitable on SPY , 5M - I think it's a pretty good number for an automated strategy that uses Pivots. I don't think it's possible to add volume and day open price in relation to pivot levels -- that's what I do manually ..
Still trying to add EMA for exits.. it will increase profitability. You can play in pinescript with trailing stops entries..

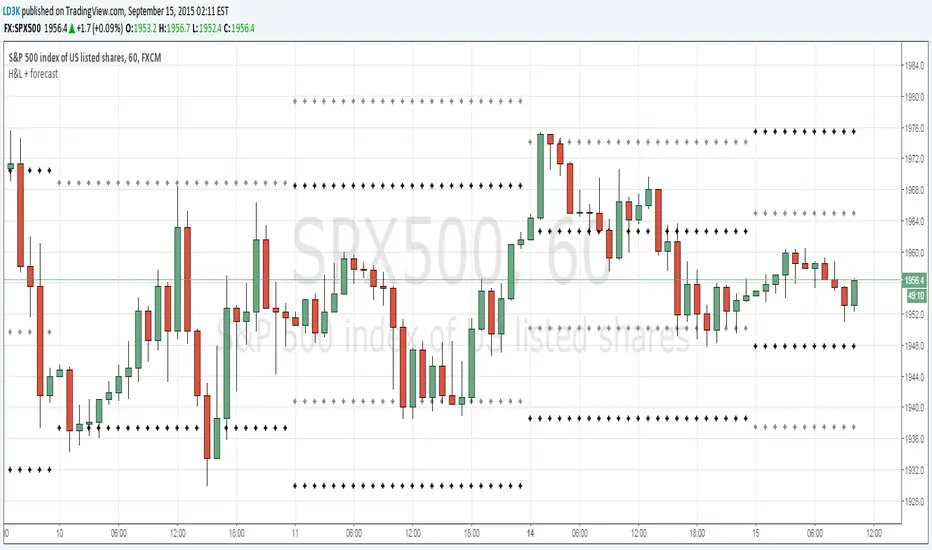
Previous H/Ls and Forecast H/LPlots the previous periods High and Lows (black crosses) and forecasts the next day's High and Lows (gray crosses)
High and LowsSimple script used to show the previous day/week/month high and low as an overlay on the chart
High Low Yearly Support ResistanceDecided to repost to get clean chart up. This gives you lines showing the current years highs and lows along with the previous years high and lows.
Requested by "N"

_CM_High_Low_Open_Close_Weekly-IntradayUpdated Indicator - Plots High, Low Open, Close
For Weekly, Daily, 4 Hour, 2 Hour, 1 Hour Current and Previous Sessions Levels.
Updated Adds 4 Hour, 2 Hour, 1 Hour levels for Forex and Intra-Day Traders.
