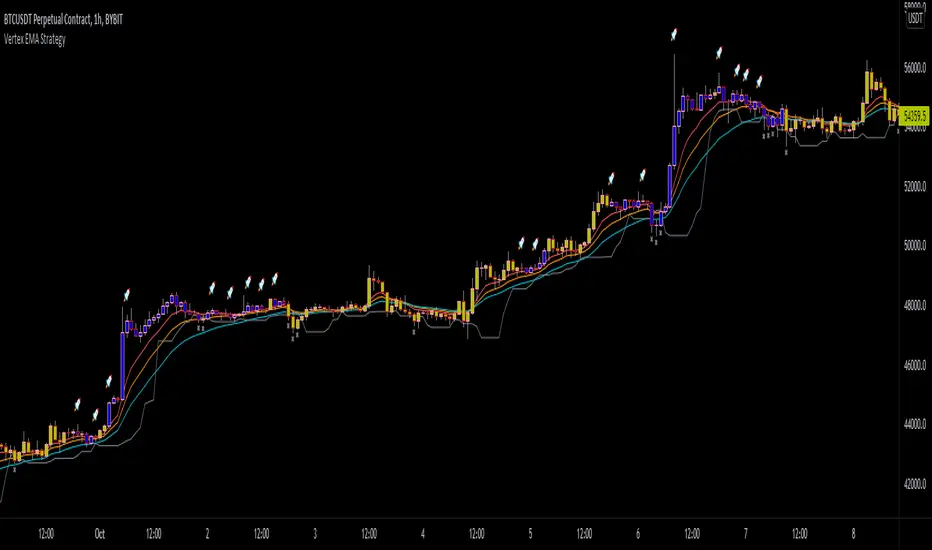
Introducing the reverse MACD Indicator. This is my Pinescript implementation of the reverse MACD indicator. Much respect to Mr Johnny Dough the original creator of this idea. Feel free to reuse this script, drop me a note below if you find this useful. Investopedia defines the MACD as a trend-following momentum indicator that shows the relationship between...
This indicator defines the impact of volume on the volume-weighted moving average, emphasizing trends with greater volume. What determines a security’s value? Price is the agreement to exchange despite the possible disagreement in value. Price is the conviction, emotion, and volition of investors. It is not a constant but is influenced by information, opinions,...
OsMA : Oscillator of Moving Averages. OsMA is a common index because it is a histogram in the middle of MACD. The histogram in the middle is a little difficult to handle, so I dared to display OsMA like MACD. The one like MACD is OsMA, and the histogram in the middle is the amount of change in OSMA. It is an indicator that is characterized by a strong and quick...
(Improved) Beep Boop Indicator for Trending Markets originally written by Trading Rush. It is originally based on the MACD 12-26 and the 50 bar EMA. The macd hist is color coded with green as buy and sell as red. I added an option to use a couple of lower lag ema's (See line 13 - ema_signal).
The script combines 2 indicators (MACD and Stoch-RSI) and puts them visually directly on the candles - can be used with normal OHLC candles or Heiken Ashi candles. Furthermore, you can derive divergences exremely easy directly visually from the candles as well. Lastly, a SMA 20 high and a SMA 20 low line build a trend channel. Script is best used in trending...
-This script utilizes simple color changes of the TSI output signals to aid in interpretation of the classic TSI indicator. -Crosses of the TSI value line and signal line are a bullish or bearish indication. TSI value line is colored green or yellow to help identify that the TSI value line is either dropping or rising, while over or under the signal line. -This...
this script is based on MACD strategy for MACD: when we have an uptrend ( the price is above the EMA 200) & the macd line cross up the signal line while they are both under the 0 level of histogram it generates buy signals. when we have a downtrend ( the price is below the EMA 200) & the macd line cross below the signal line while they are both above the 0 level...
// Deviation rate of Chinese stock market index //The purpose of the indicator is to monitor the Chinese stock market index deviation rate to the 20EMA, so each major index can be observed longitudinally at the same time. //This indicator give signal of which Index or instrument should you be focused and when should you enter the market to get a long or short...
//Relative Strength Index of European and US Stock Index Trends quality //This indicator reveals the relative strength of European and US stock index futures. //take Bull trend as an example , the current closed price>EMA20 value and the current closed price >20th previous bar closed price( deduction price), //it's defined as a lower level bull trend .If the...
How it begin? Traders and investors use market breadth in order to assess the index’s overall health. Market breadth can be a reliable, if not an accurate, indicator of an upcoming price rise in the index. Similarly, it can also provide early warning signs for a future price decline. What is it? market breadth in this case refer to percentage of stocks above...
My own interpretation indicator which i call multi time frame moving averages momentum with NO LAG EMA support (Optional). The indicator is calculated by subtracting the long-term EMA from the short-term EMA . This pretty much resembles the MACD moving averages calculation but without the smoothing of the histogram. Can also be used to find divergences. The...
This is my first indicator. It PROVIDES BUY, SHORT, and FALSE Signals by taking the MACD and the 200EMA.
The MACD indicator has been revised to be similar to the one on MetaTrader
This script looks at the current momentum direction (up or down) for the 5 minute, 30 minute, 1 hour, 4 hour and daily and allows you to set scores of importance to these. These scores are then added up to create an oscillator matching your preferences. Tune the indicator to match what you believe is the most important time frames that people use and score it...
This script reveals Ampleforth rebase levels which are going to always work. In addition to that is MACD crossovers serving as potential buy/sell entries. You can set alerts for MACD crossovers and price entering balanced value area (0.96 - 1.06). MACD signals can be used to automatically open a position and entering a balanced value area can be used as...
This is a MACD indicator enhanced with: - Show MACD and Signal Only or Histogram Only or Both - Show Buy and Sell Alert - MACD Cross - Show Bar Color - Show Regular and Hidden divergence - Show Divergence Labels - Generate Alerts: Buy/Sell and Divergence