Key Levels | Flux Charts💎 GENERAL OVERVIEW
Introducing our new Key Levels indicator! This indicator allows you to see the key levels on the current chart such as previous day lows / highs, pre-market data, yesterday's close, today's open, pivot points, and much more! It's highly user-friendly with every line being individually customizable and having a wide range of text options.
Features of the new Key Levels indicator :
Today & Yesterday High, Low, Open & Close
Previous 3-10th Day Highs & Lows
Pre-Market Highs & Lows
Previous Month High & Low
High & Low Pivots
Combination Of Same Levels
Wide Customization Options
📌 HOW DOES IT WORK ?
Key levels are important areas in a chart where a significant reaction is expected. In this indicator, you can enable up to the previous 10 days highs and lows, yesterday's close / today's open, and the latest pivot points. Key levels generally act like support & resistance. Here are a few examples :
As shown, key levels play an important role determining the current trend and can be useful in identifying potential levels where the market will reverse or breakout.
🚩UNIQUENESS
1. More Key Levels
We believe that past key levels may be as important as current ones. Some of the key-levels indicators do not include them even though strong reactions can happen around them. Thus, our indicator let's you check up to 10 days backwards.
You can select the ones you think that are the most important and just enable them, making the indicator customizable to your liking.
2. Pre-Market Data
With assets that have pre-market data available, it's crucial to analyze it to have a better understanding of the market in regular trading hours. Our indicator will plot pre-market highs and lows, even if your chart is in the regular trading hours only mode. We believe this will be helpful with your analyzing process.
3. Combination
The indicator can dynamically combine same key levels, so you can have a clear look to the chart without lines & text colliding with each other. This would also help you determine stronger key levels as if a key level occured more than a time, it could be a sign that it's a stronger one. An example :
To summarize, using key levels is an essential skill while detecting zones where strong reactions are expected. This indicator provides up to 10 day's high and low levels, and all of them can be individually turned on / off. Traders that believe older key levels can be important and want to look at the whole picture may use this feature. Also for assets that have pre-market data available, the indicator provides pre-market levels as well. Besides all that, High & Low pivots will provide latest key levels so traders can use them in their decisions.
⚙️SETTINGS
1. General Configuration
You can enable / disable :
1. Today's High / Low / Open
2. Yesterday's High / Low / Close
3. 3th-10th Day High / Low
4. Pre-Market High / Low
5. Previous Month High / Low
You can also change the colors and switch their line styles between solid, dashed and dotted.
2. High & Low Pivots
Enabled -> Enable / Disable High & Low Pivots
Pivot Range -> The range used in the detection of pivot points. Larger values will result in less pivot points, while smaller values will provide more pivot points. This essentially determines how many bars to the right & left shouldn't exceed the pivot's high or low.
You can also change the text color and text size of the pivots from the settings.
3. Style settings
Text Offset -> How many bars of offset should the texts have to the right. Increase if text collides with bars while Align Labels option is set to "Right".
Extend Lines -> If enabled, lines will be extended infinitely to right & left. If disabled, all lines will be clamped in their timelines.
Show Line Values -> If enabled, line information text will contain their price.
Align Labels ->
Right = Align line labels to right.
Center = Line labels will always be at the center of the screen.
Keylevels

XAU/USD Key levels by PB TradingWorldIndicator: XAU/USD Key Levels by PB TradingWorld
Version: 1.0
This is a Trading note for XAU/USD Traders. PB believes that Market Makers will try to protect the Key levels on chart, especially those around Swing High and Swing Low. Therefore, the indicator will show where the noticeable prices. It is displayed as follows:
Key Levels (Round Numbers):
H4 candle = 1 Trading Session
D1 candle = 1 Trading Day
W1 candle = 1 Trading Week
MN1 Canlde = 1 Trading Month
D2 Candle = The last 2 Trading Days
D3 Canlde = The last 3 Trading Days
FOREXCOM:XAUUSD

MTF Key Levels [Mxwll]Mxwll MTF S/R:
The Mxwll MTF Support & Resistance indicator is designed to identify crucial support and resistance levels across multiple timeframes. By considering various timeframes, this indicator provides a more comprehensive view of the market's underlying structure. It allows traders to extend lines in various configurations and covers timeframes ranging from 5 minutes to weekly. By considering price action across multiple timeframes, the indicator provides a more comprehensive understanding of the market's supply and demand dynamics. Traders can use the Mxwll MTF Support & Resistance Indicator to refine their trade entries and exits, manage risk, and establish potential price targets.
FEATURES
5 Minute to Weekly Key Levels
Accurate Multi-Timeframe Support and Resistance
Customize To Extend The Lines - Left, Right and Right Across The Chart
Interplay Between Support and Resistance Levels
Change Colours Of S&R
Change Colours Of S&R Lines
INSTRUCTIONS
Select Your Timeframe -> Unselect the S&R Levels That Are Less Than The Timeframe - Trade

NSDT Custom High and Low LinesFirst, the credit for the original script to plot a High and Low between a certain time goes to developer paaax.
I took that idea, converted it to Pinescript V5, cleaned up the code, and added a few more lines so you can plot different levels based on time of day.
Published open source like the original.
The example shown has:
Blue - plotting from the start of the Futures Asian session to the start of the Futures USA Session. (6:00PM - 9:30AM Eastern)
Yellow - plotting from the start of the Futures Europe session to the start of the Futures USA Session. (3:00AM - 9:30AM Eastern)
Green - plotting from the start of the Futures US Premarket session to the start of the Futures USA Session. (8:00AM - 9:30AM Eastern)
These are great levels to use for breakouts and/or support and resistance.
Combine these levels with the 5 min Open Range levels, as you have some good trades.
Each of the three sessions have individual start and end times that can be modified by the trader, so you can easily mark off important areas for your style of trading.

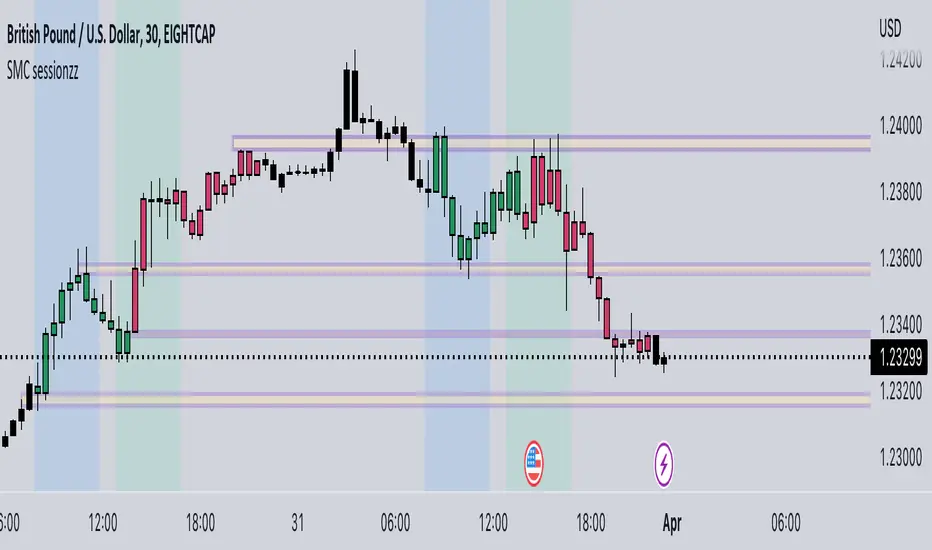
SMC sessionzz by JelleThe main function of this indicator is to make it easy to identify several smart money concepts (SMC) and ICT practices by using a single indicator. The functions themselves are not my original content, but rather a collection of several scripts with some tweaking, combined into a single indicator.
Main functions:
- Provides the ability to set bar color for London, New York and Asia sessions
- Provides the ability to set background color for London, New York and Asia sessions
- Provides the ability to indicate NY and GMT midnight on the chart by plotting vertical lines
- Provides several smart features to turn bar color and background color on/off depending on the timeframe
Usage example:
- Easily determine each session high and low by using the bar color feature
- Easily determine the daily high and low by using the vertical midnight lines
- Easily determine ICT kill zones by setting background color for each session
- Easily avoid clutter on your chart by using the timeframe filters
Gann Square of 9Here it is, the Gann Square of 9. An easy-to-use tool to determine possible support and resistance levels. Input a starting value to be the starting point of the square. Then the increasing value will be used to get the value of each cell on the table.
It's possible to show the diagonals and a spot number to see what cell value the current price is close to. The diagonals are known to be the key support and resistance levels in Gann's analysis. That way, it's possible to show those diagonals in the chart for easy reading of those levels.

Take Session High/Low Alert [MsF]Japanese below / 日本語説明は英文の後にあります。
-------------------------
This indicator that displays High/Low lines for each session. The Key Levels of each session can be visually recognized, which is useful for PD Array analysis. You can display the last 3 days. Based on trinity by ICT.
The biggest feature is that the color shape of the line changes when reaching High/Low. Of course, you can also set alerts.
Unreached High/Low lines can be extended to the right. hides all timeframes over 1 hour. (alert is alive)
You can choose 4 sessions. If you only want to use 3 sessions, you can do that by setting the same session time for 2 of the 4 session settings.
About Parameter Settings
Session Time: Please set it to be a 24-hour cycle. You can also specify the time zone. The default is NY time.
Basis/Other color: The first time specified in "Session Time" in this indicator's parameter is the "Basis color". "Other color" is a line other than that.
Enable Time Lines: You can turn on/off the display of vertical lines.
High/Low color: High/Low line setting that has not been reached.
Taken color: High/Low line setting that has already been reached.
Extend Lines: Allows unreached High/Low lines to be extended to the right in the chart.
-------------------------
セッションごとのHigh/Lowをライン表示するインジケーターです。
過去約3日分を表示することができます。
最大の特徴はHigh/Low到達時にラインの色形が変わることです。もちろんアラート設定も可能です。
未到達のHigh/Lowラインは右側に延長することができます。
チャート表示がビジーとなる為、1時間を超える時間足ではすべて非表示とする仕様です。(アラートは生きてます)
セッションは4つ指定できます。
もしセッションを3つのみ使用したい場合は、4つのセッション設定の内2つに同じセッション時間を設定することで実現可能です。
■パラメータ設定
Session Time:24時間周期となるように設定してください。またタイムゾーンが指定できます。デフォルトはNY timeです。
Basis/Other color:パラメータの"Session Time"にて一番最初に指定した時間が基準=Basisとなります。Otherはそれ以外のラインとなります。
Enable Time Lines:垂直ラインの表示ON/OFFが可能です。
High/Low color:未到達のHigh/Lowライン設定となります。
Taken color:到達済みのHigh/Lowライン設定となります。
Extend Lines:未到達のHigh/Lowラインを右に延長できます。

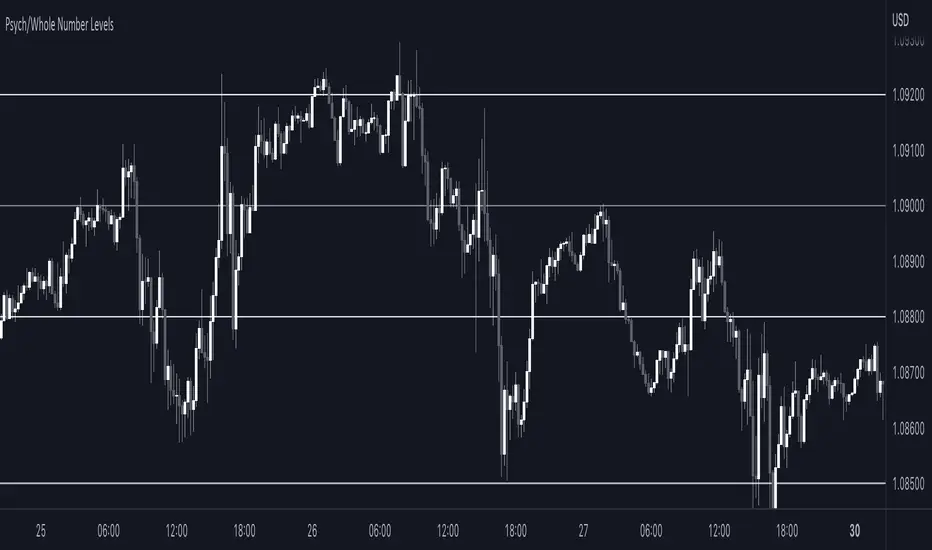
Sonarlab - Psych/Whole Number Levels Have you ever noticed that prices seem to stick to certain “round numbers” like $1250, $1300, or $1350? It’s not just your imagination — these round numbers can actually act as psychological levels in the market, influencing trader behavior and shaping price action.
But why do traders care so much about these round numbers? It all comes down to our psychological wiring. Humans are naturally drawn to symmetry and simplicity, and round numbers offer a nice, neat way to measure price levels. Plus, these levels often coincide with important milestones or historical levels of support and resistance, giving them even more psychological weight.
To help you take advantage of these psychological levels in your trading, we’ve created a free TradingView indicator that automatically plots round numbers on your chart. Whether you’re a seasoned trader or just starting out, this indicator can give you a valuable edge in the market.
Here’s how the Indicator works:
1. Install the indicator on your TradingView chart. You can find it in the public library by searching for “Round Numbers Indicator”.
2. Select your preferred round numbers and customize the appearance of the indicator to fit your chart. The default settings are already set good.
3. Watch as the round numbers dynamically adjust to the current price action, providing you with a clear view of the market’s psychological levels.
SpaceTime LevelsSpaceTime Levels Part of the SpaceTime Complete Suite
SpaceTime Levels provides a much needed improvement in the display of multi session compatible levels related to TPO calculations (Time x Price)
The relevant levels are neatly mapped out in a way that is easy to read without the need of the whole profile, e.g. having VA levels D/W/M without the addition
D/W/M Profiles being attached to them reducing the onscreen clutter.
Fully customizable for display includes:
Line styles,
Thickness,
and Coloring.
Text Size,
Coloring.
Custom offset for levels
Pros:
Visible levels, lack of onscreen distractions.
Previous Profile levels included, e.g. pVAH related to previous Value Area High
Cons:
Limited to one previous profile session
Updates incoming:
Additional levels if people request such as NPOCs
Full suite view:

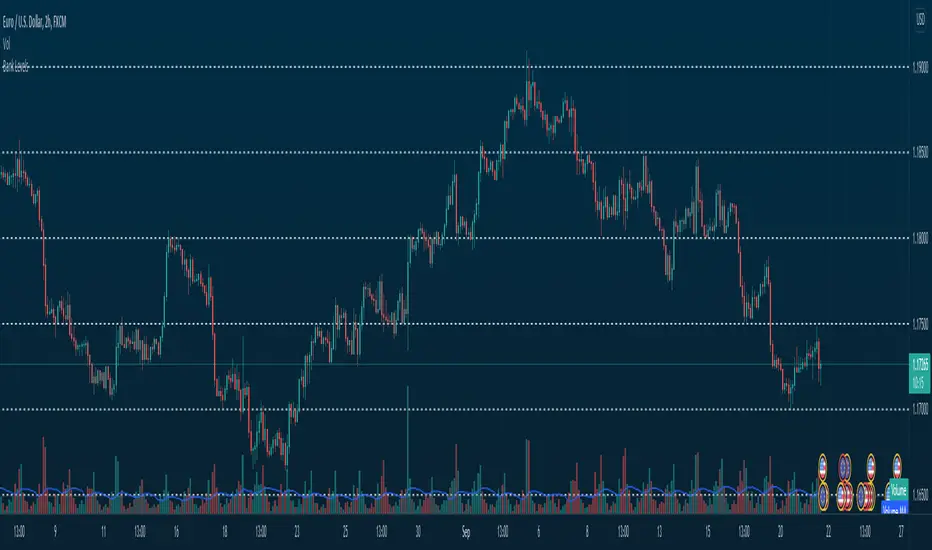
Support & Resistance/Supply & Demand/Liquidity/Trendlines (Expo)Real-Time Support & Resistance/Supply & Demand/Liquidity Zones /Trendlines / Key Levels
This trading tool automatically identifies real-time Support/Resistance, Supply and Demand, Liquidity Zones, Key levels, and Trendlines.
FEATURES
This indicator includes all necessary features for traditional technical analysis, such as Trendlines, Support/Resistance, Supply/Demand, and Liquidity Zones. In addition to that, we have added key market levels.
Support/Resistance: Identifies areas in real-time where the price finds support and resistance.
Supply/Demand: The indicator analyzes the market structure in real-time and maps out key supply and demand zones. The user gets an instant understanding of the current market structure.
Liquidity Zones: Liquidity zones are displayed where there is a significant level of trading activity and when there is both high supply and demand for an asset, security, or contract.
TrendLines: Trendlines help traders determine the current direction of market prices. A trendline is displayed when a price action trend is detected.
Key Levels: Key levels are psychological levels that are under the attention of many traders. There is a lot of buying or selling pressure at these levels. At these key levels, price decides its direction, either to go bearish or bullish.
HOW TO USE
Use the indicator to identify several important and commonly used levels and zones. All zones work as a future reference where the price has a higher likelihood to react at, bounce off from, or reverse.
-----------------
Disclaimer
Copyright by Zeiierman.
The information contained in my Scripts/Indicators/Ideas/Algos/Systems does not constitute financial advice or a solicitation to buy or sell any securities of any type. I will not accept liability for any loss or damage, including without limitation any loss of profit, which may arise directly or indirectly from the use of or reliance on such information.
All investments involve risk, and the past performance of a security, industry, sector, market, financial product, trading strategy, backtest, or individual’s trading does not guarantee future results or returns. Investors are fully responsible for any investment decisions they make. Such decisions should be based solely on an evaluation of their financial circumstances, investment objectives, risk tolerance, and liquidity needs.
My Scripts/Indicators/Ideas/Algos/Systems are only for educational purposes!
Paid script

Cyatophilum Auto Key LevelsThis indicator will automatically plot key horizontal levels.
The script will create a grid from highest to lowest price, dividing this price range into several steps.
It will then loop through each bar and save its cummulative price/volume into each steps.
The steps with the most significant prices/volume are finally plotted into key levels.
═════════════════════════════════════════════════════════════════════════
Settings
• Precision: The number of steps. Increase if you want more precise levels or decrease for bigger areas.
• Lookback: The number of bars from the past used to calculate the levels.
• Strength: The amount of lines to show.
• Use Volume: For volume weighted key levels.

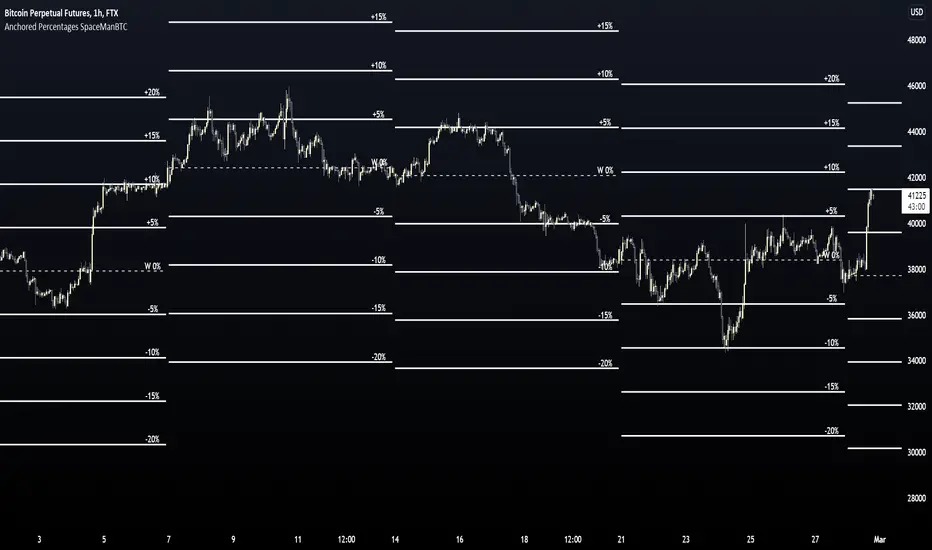
Anchored Percentages SpaceManBTCAnchored Percentages SpaceManBTC
This indicator is a successor to Percentage Values SpaceManBTC.
As opposed to anchoring via user selection on chart,
the user can choose common anchor points related to typical important Price Action levels such as: Daily, Weekly, Monthly.
And choose point of interest such as the Open for weekly open, or high,low, close...
The code is quite simple, specify a point in origin, and apply percentage deviations on price from that point,
For usecase I find it can be quite useful for round numbers personally which is why ive set the default to be: 5,10,15,20.
Similar to playing round values that may provide some psychological reason for resistance/support I beleive the same can be done with %, allowing for Dynamic Targets and S/R Based on average moves vs what is potentially over extended.
ZigZag OrderBlock Retracement█ INTRODUCTION
What is an OrderBlock? It is simply Price where Banks (or Large Financial Entities) have Bought or Sold heavily (Support or Resistance Institutional Zone).
Our job as a trader is to monitor what the Banks and/or Large Investors are doing then patiently wait and have the opportunity to surf in their direction.
Large Financial Entities Buy during Price drops to get the best purchase Price. The Bank are acting a bit like us in our everyday life,
When we want Buying something, we always try to Buy it at the best price. And when we Sell, take the example of a used Car, we will systematically
try to Sell it at the highest possible Price. The Price of convertible Cars goes down during the Winter and goes up during the Summer.
So to make the best operation, if you Buy a second-hand convertible you will prefer to Buy it during the Winter and Sell it immediately in the Summer
and not Vice versa. So the way Large Institution act is exactly the same, it will expect the Price to Buy the fall and they will wait until
the Price rises in order to Sell. This is how the Profits will be made. The mistake that many Traders makes when they Trade emotionally is to act
in the opposite way of what they will do in everyday life. When we trade emotionally, we see the Price fall, instead of Buying while the Price drops we Sell.
In a similar emotional based act when the Price goes up we Buy, while when the Price goes up it's the best opportunity to Sell. So all the big moves
that you can watch on your different Instruments are the result of Banks or other Large Financial Entities. As Individuals, we do not have the necessary
“Strike Force” to create this type of movement. However, it is important to note that when Banks or Large Entities create this type of movement,
they do so despite theirs willing, they would love to be able to hide but luckily for us they can’t. When Billions of Dollars are Invested in Trades,
the effect can’t be concealed and as a result we will observe the impact on the market then as an Individual we’ll be able to see that on our Charts.
There are many ways to locate these areas of interest. But as they say, all roads lead to Rome. The purpose remains the Price Study
and in particular the movements of strong amplitude on the Chart. Large Financial Entities will keep acting in the same Price areas, Or at least we can say
that there's a high probability for them to intervene in these zones. Therefore, rather than chasing the Price moves and then to endure a counter move,
we will patiently wait until the Price returns to these areas on the basis that Banks and, or Large Entities will accumulate on their Positions
and are going to Sell and Buy in the same Price areas. Keep in mind that this logic works no matter what TimeFrame is used. However when the have Analysis
on Small TimeFrame (between M15 and H1) will make the movements observed between 20 and 50 Pips. Whereas if we look at H4 or Daily,
we can really see movements of 100 or even 200 Pips.
█ OVERVIEW
The ZigZag Indicator is used to illustrate Trend Lines without taking into account intermediate Retracements.
In a way, it allows you to get to the point by giving a simplified view of the evolution of Prices by eliminating "parasitic" movements, and thus to Position
and unwind Positions at the appropriate times. It is part of the category of Trend Indicators. We will simply define a Level of Price variation below which
they will not be taken into account by the indicator. This will eliminate all minor fluctuations, depending on the desired sensitivity.
The Indicator can only have 2 directions, Up or Down. For example, setting the Indicator to 5% (ZigZag Length ) will eliminate all variations below 5%.
If the Trend is Bullish and the Indicator therefore oriented in the same direction, Prices will have to fall by at least 5% for the direction
of the ZigZag to reverse Downward. Why using ZigZag to search for our OrderBlock? ZigZag makes it possible to clearly identify the current Trend as well
as significant Reversals and therefore have a much clearer vision of the actions carried out by Banks / Large Entities. However, it is drawn up
a posteriori and therefore does not make it possible to predict the evolution of Prices. The turning points are Indicated with a delay proportional
to the chosen sensitivity. The indicator calculates the Lowest Price over the given Period and eliminates Prices that are below the minimum requested
Array Size. Then, it calculates the Highest Price over the given Period and eliminates the Prices that are below the minimum requested Array Size.
Finally, it draws the Trend Line that connects the High and Low points determined previously and use the sum of the two to determinate the Range area.
█ HOW TO INTERPRET?
• The Indicator creates Lines that demonstrate past Retracements and current Pivots Levels to get a clearer view of the next Retracement area
using the Lines from the Last High and Low Pivots to determine which Take-Profit or Stop-Loss set.
• The "OrderBlocks" are detected based on the Pivots founds. You can display the Prices and use theses to help you set your Take-Profit during Retracement.
• Possibility to display the Levels of detected Pivots point. This can permit to dispense with the use of Elliot Waves or the use of a Fibonacci.
• Donchian ZigZag Channels to be sure to always have seen the extremities of the Top, Bottom and Range area.
• The ZigZag Length is set to 5 by default. You will have to adjust it according to selected TimeFrame or Financial Instrument used.
• The ZigZag has 3 adjustable colors:
-Green = Bullish Trend
-Red = Bearish Trend
-Orange = Range Zone
It is not advisable to enter Position when the ZigZag color indicates a Range Zone.
- OrderBlocks
- ZigZag + Pivots Point
- Donchian ZigZag Channel
█ ALERTS
Following the request of many users on our other script concerning the late arrival of Alerts for detected OrderBlocks (on Institutional OrderBlock Pressure), we fixed this problem here with the arrival INSTAN and CONFIRM ALERTS .
█ NOTES
- This script is not beginner's Level and is intended for Traders with advanced knowledge of ZigZag and the work of Michael j. Huddleston on the OrderBlocks.
Good Trade everyone and remember, risk management remains the most important!

QF LevelsQF LEVELS is an Indicator that displays various Levels and Session Ranges .
Daily / Weekly / Monthly / Quarterly / Yearly - Open levels
Previous DWMQY - Open levels
Monday - High / Mid / Low - Levels
Intraday (4H) Levels
London / New York / Asian - Sessions
Automatic Coloring based on Support / Resistance
Full Color Customization
Themes coming in next update

[AB] Support/Resistance Drawing ToolThis script is designed to help you identify viable support and resistance levels by automatically creating lines that become less transparent when said levels hold. It is based on Donchian Channels created by rounded closes, not by highs and lows. You can use it as an aid to draw your levels manually, or stick exclusively to automatic charting.
Available settings are as follows:
Source - highly recommended to use Close, but other options are available if you'd like to do some experimentation.
Source Rounding - the accuracy of price sampling; higher rounding will make your lines more visible at the expense of precision. It is highly recommended to use decimals.
Length (Array) - the overall lookback of the script (length of the array). This value shouldn't be higher than 500 if skip = 2, or 250 if skip = 1. If you'd like to reach further back into the past, I'd recommend switching timeframes instead of increasing this beyond 500.
Sampling Skip - how frequently the data is sampled. I wouldn't recommend going beyond 2, especially with the default settings.
Transparency Skip - you can think of it as "pencil hardness". The higher the skip, the bigger the imprint of a single level detection will be. Wouldn't recommend going beyond 10.
Color R, G, and B - you can use these settings to adjust the color of the lines.

Bank Levels - Psychological Levels - Bitcoin, Indices, ForexThis got removed so I'm publishing it again.
What it is:
- This script draws in levels refereed to as bank levels. They are basically psychological/even numbers(40000, 45000, 150, 1850..)
Why doesn't it work on some charts?
- Each pair has a different tick value. You will have to edit the code to make it work on certain pairs. It's pretty simple, take a look.
Trend Key PointsEach trend has its high and low key points that are important in the next prices. Sometimes it's hard to find out the keys with a naked eye, so I tried to code a simple indicator to marking these points also, as a bonus, to draw support and resistance lines from previous critical pivot points.
Let me explain the details with a downtrend. If we consider the previous trend, each downtrend starts with a HH and end with a LL. There are always many tries between that HH and LL to turn the trend up. This indicator counts that inner attempts. The higher the number of attempts, the more important move has been started from the beginning (HH). These numbers take their final form when the trend ends and are included in the label at the beginning of each trend.
Key points with 3 and more inner tries are consider as critical point by default but It's alterable and you can change it as you want. The indicator draws lines from critical points too, so you can use that lines as support and resistance in next candles.
Likewise, there are marks below inner LLs and above inner HHs.
This indicator idea is entirely my own and is a product I've really thought about, AND you have allowed to use and share it anywhere to anyone. I did my best to make it useful, even so I am open to any improvement. If you have an idea or a suggestion, don't forget to leave a comment.

Key Levels by RifeMy take on Key Levels script that plots:
- Daily Open
- Weekly Open
- Monthly Open
- Day of Week Range (i.e. Monday Range)
- Initial Balance
Open levels are not visible on higher time frames, such as Daily Open is not visible on Weekly Open nor Monthly Open.
Initial Balance is not visible on the following timeframes: 2H, 4H, 6H, 8H, 1D, 1W and 1M. All other time frames will show it.

NSDT Daily Key LevelsSimple script to show key levels of current day and previous day. Labels can be turned on and off as needed. Line colors, thickness and style can be changed. Modified the "M/W/D Level" script from paaax. Credit for original code goes to him. Link to script and profile posted in code of this script.

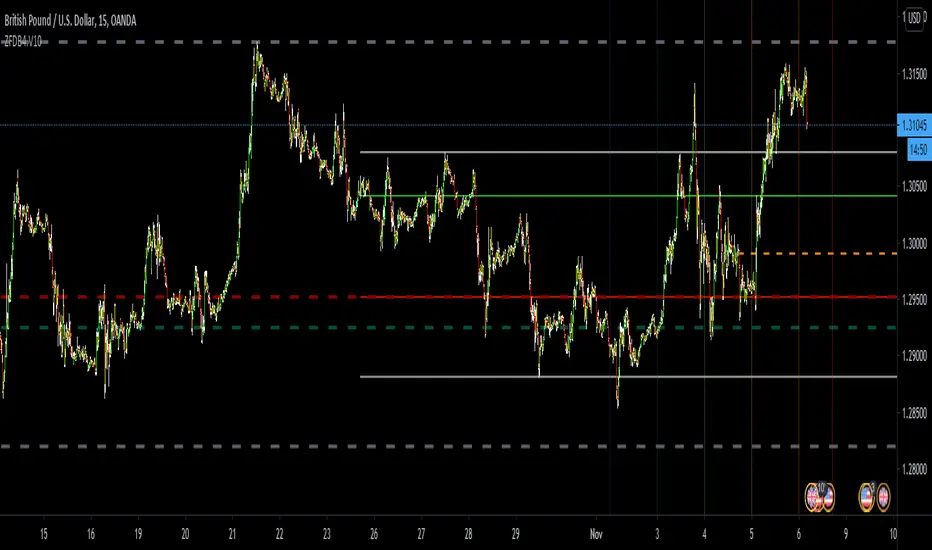
ZFDB4.V10its a simple indicator which will automatically plot out the following
Previous day's - open
previous week's - high, low, open and close
previous month's - high, low, open and close
it will also separate the days in the week ahead ( not behind)
the idea of this indicator is to help you be AWARE of key levels that you might miss while being on lower time frames and also help you to think forward instead of backwards.
there are indicators already built on tradingview that plots these levels.
this indicator is inspired by "BartholomewJ - Killzones" & "Airscape - Days of week"
Cheers guys!
Hope it can help you!
Kilted Round NumbersKILTED ROUND NUMBERS v1.0
Description: This is a simple indicator that calls out the psychological round numbers that the market gravitates towards. Lines in BLUE are SUPPORT as they will be below the current price and lines in RED are above the current price and represent resistance.
This should assist traders with key levels that once drawn assist the eye with seeing those key levels and how price reacts to the respective levels.
SETTINGS AND EXPLANATION
General Settings
- Kilted Round Numbers Main Levels – This will highlight the main levels above and below the current price
- Kilted Round Numbers Sub Levels – This will highlight the number of levels you want to see within the main levels
- Only Show Dane Sub Levels – This feature is a work in progress and will highlight certain levels only as part of a separate strategy and will be available in due course in v2.0
If you need access to any of our indicators please use the link below to obtain access to this indicator or send us a private message on trading view.

ZenTrading MTFA Support & Resistance Day/Swing_BETAThis is a multiple timeframe analysis indicator for the day trading and swing trading timeframes (4HR downwards).
The pink dots indicate support/resistance levels. Current levels as well as past levels are relevant.
This is a beta testing version of the indicator, there may be some minor issues, so use at your own risk.
If you have any questions feel free to contact me
