ICT KillZones Hunt [TradingFinder] 4 Sessions + OB + FVG + Alert🔵 Introduction
🟣 ICT
The "ICT" style is a subset of "Price Action" technical analysis. The primary goal of the ICT trading strategy is to merge "Price Action" with the "Smart Money" concept to pinpoint optimal trade entry points.
However, this approach's strength extends beyond merely finding entry points. It also helps traders gain a deeper understanding of price behavior and adapt their trading strategies to the market structure.
The most important concepts of "ICT" :
Order Block
Fair Value Gap(FVG)
Liquidity
🟣 Session
Financial markets are divided into several time periods, each featuring distinct characteristics and levels of activity. These periods, known as sessions, are active at different times during the day.
The primary active sessions in financial markets include :
Asian Session
European Session
New York Session
Based on the UTC time zone, the schedule for these key sessions is :
Asian Session: 23:00 to 06:00
European Session: 07:00 to 16:30
New York Session: 13:00 to 22:00
Note
To avoid session overlap and minimize interference during kill zones, the session times have been modified as follows :
Asian Session: 23:00 to 06:00
European Session: 07:00 to 14:25
New York Session: 14:30 to 22:55
🟣 KillZone
Kill zones are periods within a session where trader activity spikes. During these times, trading volume surges, and price movements become more pronounced.
The major kill zones, according to the UTC time zone, are as follows :
Asian Kill Zone: 23:00 to 03:55
European Kill Zone: 07:00 to 09:55
New York Morning Kill Zone: 14:30 to 16:55
New York Evening Kill Zone: 19:30 to 20:55
🔵 How to Use
🟣 Order Block
Order blocks are a distinct category of "Supply and Demand" zones, formed when a series of orders are grouped together. These blocks are often created by banks or other significant market participants.
Banks typically execute large orders in blocks during their trading sessions. If they were to enter the market with small quantities, substantial price movements would occur before the orders were fully executed, reducing potential profit.
To mitigate this, they divide their orders into smaller, more manageable positions. Traders should seek "buy" opportunities in "demand order blocks" and "sell" opportunities in "supply order blocks."
🟣 Fair Value Gap (FVG)
To pinpoint the "Fair Value Gap" on the chart, meticulous candle-by-candle analysis is essential. Pay close attention to candles with significant bodies, examining each candle alongside the one preceding it.
The candles flanking this central candle should exhibit elongated shadows, with bodies that do not intersect the body of the central candle. The span between the shadows of the first and third candles is referred to as the FVG range.
Note :
The origin of all Order Blocks and FVGs starts from inside a kill zone and extends up to the end of the same session.
🟣 Kill Zone Hunt
Following this strategy, after the conclusion of the kill zone and the stabilization of its high and low lines, if the price touches either of these lines within the same session and encounters a robust rejection, it presents an opportunity to enter a trade.
🔵 Setting
🟣 Global Setting
Show All Order Block :
If it is turned off, only the last Order Block will be displayed.
Show All FVG :
If it is turned off, only the last FVG will be displayed.
Show More Info Session :
If it is turned on, more information about kill zones (Trade Volume, Time, Number of Candles) will be displayed.
🟣 Logic Parameter
Pivot Period of Order Blocks Detector :
Enter the desired pivot period to identify the Order Block.
Order Block Validity Period (Bar) :
You can specify the maximum time the Order Block remains valid based on the number of candles from the origin.
Mitigation Level Order Block :
Determining the basic level of a block order. When the price hits the basic level, the order block due to mitigation.
🟣 Order Blocks Display
Demand Order Block :
Show or not show and specify color.
Supply order Block :
Show or not show and specify color.
🟣 Order Block Refinement
Refine Demand OB :
Enable or disable the refinement feature. Mode selection.
Refine Supply OB :
Enable or disable the refinement feature. Mode selection.
🟣 FVG
FVG Validity Period (Bar) :
You can specify the maximum time the FVG remains valid based on the number of candles from the origin.
Mitigation Level FVG :
Determining the basic level of a FVG. When the price hits the basic level, the FVG due to mitigation.
Show Demand FVG :
Show or not show and specify color.
Show Supply FVG :
Show or not show and specify color.
FVG Filter :
Enable or disable filtering of FVGs. Select filter mode.
🟣 Session
Show More Info Session Color
Asia Session, London Sesseion, New York am Session & New York pm Session :
Show or not show session and kill zones. Change the display color.
🟣 Alert
Send Alert When Touched Session high & Low :
On / Off
Alert Demand OB Mitigation :
On / Off
Alert Supply OB Mitigation :
On / Off
Alert Demand FVG Mitigation :
On / Off
Alert Supply FVG Mitigation :
On / Off
Message Frequency :
This string parameter defines the announcement frequency. Choices include: "All" (activates the alert every time the function is called), "Once Per Bar" (activates the alert only on the first call within the bar), and "Once Per Bar Close" (the alert is activated only by a call at the last script execution of the real-time bar upon closing). The default setting is "Once per Bar".
Show Alert Time by Time Zone :
The date, hour, and minute you receive in alert messages can be based on any time zone you choose. For example, if you want New York time, you should enter "UTC-4". This input is set to the time zone "UTC" by default.
Display More Info :
Displays information about the price range of the order blocks (Zone Price) and the date, hour, and minute under "Display More Info". If you do not want this information to appear in the received message along with the alert, you should set it to "Off".
Killzone

Horizontal Sessions - B A N K $This is a simple indicator that has been designed to aid intraday trading and has only 1 function;
Information ℹ️
This indicator prints Horizontal Lines in a separate chart pane above/below for the 3 main session killzones in the markets; Asia, London & New York + Optimal Exit Time.
The indicator is only visible up to and including the 1h timeframe.
Settings ⚙️
The default timings are set to perfectly align with each session killzone however the Start & End times for each session can be changed in the settings.
You can change the colour & line thickness of the horizontal lines in the settings.

B A N K $ - Advanced Session RangesThis is a simple indicator that has been designed to aid intraday trading and has a few components;
Key Features
Session Ranges + Optimal Exit Time
Asia Pip Range
New York Midnight Open Line
Session Ranges + Optimal Exit Time
Information ℹ️
This is a visual depiction of the 3 main sessions in the markets. Asia, London & New York. The default timings are set to perfectly align with each session however the Start & End times for each session can be changed in the settings. (I've added a website on the tooltip to easily convert timezones)
I have also added a 4th session range called "Optimal Exit Time". This is statistically the most probable time window for the opposite High / Low of Day to form is within this window. It helps the trader understand when they should look to take profit.
How It Works 🔑
The indicator automatically maps on two lines for the High & Low of the range between the selected Start & End time, it also colours the background.
The individual lines & background can be toggled & customised to the traders preference.
Asia Pip Range
Information ℹ️
This displays the Asia Range in pips beneath the Asia Session Low.
How It Works 🔑
This calculates the distance between the Asia High - Asia Low in pips. It will automatically recalibrate to the timings the trader sets in the settings if they change the Start / End.
New York Midnight Open Line
Information ℹ️
This helps look for Buys beneath the line for a Bullish Expansion day 📈 & Sells above the line for a Bearish Expansion day 📉
How It Works 🔑
This adds a horizontal line to the chart that is anchored to New York Midnight Open (00:00) by default. It can be changed in the settings in required. You can also toggle on the time being shown above the line.

KillZones Hunt + Sessions [TradingFinder] Alert & Volume Ranges🟣 Introduction
🔵 Session
Financial markets are divided into various time segments, each with its own characteristics and activity levels. These segments are called sessions, and they are active at different times of the day.
The most important active sessions in financial markets are :
1. Asian Session
2. European Session
3. New York Session
The timing of these major sessions based on the UTC time zone is as follows :
1. Asian Session: 23:00 to 06:00
2. European Session: 07:00 to 16:30
3. New York Session: 13:00 to 22:00
Note
To avoid overlap between sessions and interference in kill zones, we have adjusted the session timings as follows :
• Asian Session: 23:00 to 06:00
• European Session: 07:00 to 14:25
• New York Session: 14:30 to 22:55
🔵 Kill Zones
Kill zones are parts of a session where trader activity is higher than usual. During these periods, trading volume increases and price fluctuations are more intense.
The timing of the major kill zones based on the UTC time zone is as follows :
• Asian Kill Zone: 23:00 to 03:55
• European Kill Zone: 07:00 to 09:55
• New York Morning Kill Zone: 14:30 to 16:55
• New York Evening Kill Zone: 19:30 to 20:55
This indicator focuses on tracking the kill zone and its range. For example, once a kill zone ends, the high and low formed during it remain unchanged.
If the price reaches the high or low of the kill zone while the session is still active, the corresponding line is not drawn any further. Based on this information, various strategies can be developed, and the most important ones are discussed below.
🟣 How to Use
There are three main ways to trade based on the kill zone :
• Kill Zone Hunt
• Breakout and Pullback to Kill Zone
• Trading in the Trend of the Kill Zone
🔵 Kill Zone Hunt
According to this strategy, once the kill zone ends and its high and low lines no longer change, if the price reaches one of these lines within the same session and is strongly rejected, a trade can be entered.
🔵 Breakout and Pullback to Kill Zone
According to this strategy, once the kill zone ends and its high and low lines no longer change, if the price breaks one of these lines strongly within the same session, a trade can be entered on the pullback to that level.
Trading in the Trend of the Kill Zone
We know that kill zones are areas where high-volume trading occurs and powerful trends form. Therefore, trades can be made in the direction of the trend. For example, when an upward trend dominates this area, you can enter a buy trade when the price reaches a demand order block.
🟣 Features
🔵 Alerts
You can set alerts to be notified when the price hits the high or low lines of the kill zone.
🔵 More Information
By enabling this feature, you can view information such as the time and trading volume within the kill zone. This allows you to compare the trading volume with the same period on the previous day or other kill zones.
🟣 Settings
Through the settings, you have access to the following options :
• Show or hide additional information
• Enable or disable alerts
• Show or hide sessions
• Show or hide kill zones
• Set preferred colors for displaying sessions
• Customize the time range of sessions
• Customize the time range of kill zones

KillZones & Sessions [TradingFinder] Volume | Asia, London & NY🔵 Introduction
🟣 Session
The forex market operates 24 hours a day, 5 days a week, with only Saturdays and Sundays being off; traders often focus on one of the forex trading sessions instead of trying to trade in all markets 24 hours a day.
Trading sessions are time intervals during which a specific financial market is active and trades are conducted. The Asia, London, and New York sessions are the most important trading sessions throughout the 24-hour period, during which a significant amount of money and liquidity enters the market.
🟣 Kill Zone
Traders in financial markets profit from the difference between the price at which they buy or sell and the current market price. Traders have different time horizons for trading.
Among these, some traders engage in daily or even hourly trading and must operate during times when the market has desirable trading volumes and significant price movements.
Kill zones are segments of a session with higher trading volumes and price fluctuations compared to the rest of the session.
🔵 How to Use
🟣 Session Time
The "Asia Session" consists of two sessions: "Sydney" and "Tokyo." The beginning of this session, according to the "UTC" time zone, is at 23:00 and ends at 06:00. Similarly, the beginning of the "Asia KillZone," according to the "UTC" time zone, is at 23:00, and it ends at 03:55.
The "London Session" consists of two sessions: "Frankfurt" and "London." The beginning of this session, according to the "UTC" time zone, is at 07:00, and it ends at 14:25. Similarly, the beginning of the "London KillZone," according to the "UTC" time zone, is at 07:00, and it ends at 09:55.
The beginning of the "New York am" session, according to the "UTC" time zone, is at 14:30, and it ends at 19:25. Similarly, the beginning of the "New York am KillZone," according to the "UTC" time zone, is at 14:30, and it ends at 16:55.
The beginning of the "New York pm" session, according to the "UTC" time zone, is at 19:30, and it ends at 22:55. Similarly, the beginning of the "New York pm KillZone," according to the "UTC" time zone, is at 19:30, and it ends at 20:55.
Important : To prevent session overlap, the working hours of each session have slightly changed.
🔵 Features
🟣 Simultaneous Session and Kill Zone
With this indicator, you can simultaneously view the kill zone and session. High and low lines are used to indicate sessions, while filled areas with color represent kill zones. If you do not want to see kill zones, you can turn off the display settings.
🟣 Candle, Time, and Volume
Using the "More Info" feature, you can see the number of candles, elapsed time, and traded volume within the colored filled area.
🔵 Settings
•Show More Info: To display "More Info," you need to turn on this feature and turn it off whenever you don't need it.
• You can also customize these settings for each session separately :
o Display or hide session.
o Choose session color.
o Set session time range.
o Display or hide kill zone.
o Set kill zone time range.

Sessions KillZones Library [TradingFinder]🔵 Introduction
"The Forex Trading Sessions" highlight the active periods across different markets where significant trading volume and influence on the forex market are evident. The primary trading sessions globally include the "Asian Session," "London Session," and "New York Session."
A "Kill Zone" refers to a segment within a session characterized by high trading volume and notably sharper price movements. Consequently, there's a higher probability of encountering price action setups within these zones. Traders capitalize on this phenomenon in pursuit of more successful trading outcomes.
If you aim to integrate sessions or kill zones into your indicators or strategies, utilizing this library can amplify the precision and efficiency of your Python script development.
🔵 How to Use
First, you can add the library to your code as shown in the example below:
import TFlab/SessionAndKillZoneLibrary_TradingFinder/1
🟣 Parameters
SessionDetector(Session_Name, Session_Time, KillZone_Time, Session_Show, KillZone_Show, AreaUpdate, MoreInfo, Session_Color, Info_Color) =>
Parameters:
•Session_Name (string)
•Session_Time (string)
•KillZone_Time (string)
•Session_Show (bool)
•KillZone_Show (bool)
•AreaUpdate (string)
•MoreInfo (bool)
•Session_Color (color)
•Info_Color (color)
Session_Name : You must enter the session name in this parameter.
Session_Time : Enter here the start and end time of the session, which should be based on the UTC time zone.
KillZone_Time : Enter the start and end times of the kill zone, which should be based on the UTC time zone, here.
Session_Show : You can control whether or not to show the session using this entry. You must set true to display and false to not display.
KillZone_Show : Using this input you can control whether the kill zone is displayed or not. You must set true to display and false to not display.
AreaUpdate : If you want the session to be determined based on the time and high and low of the session itself, you must enter "Session" and if you want the area to be determined based on the time and high and low of the kill zone, you must enter "Kill Zone".
MoreInfo : If you want more information, you should set this entry to true, otherwise set to false. This information includes the number of candles in the area, the length of time in the area and the volume of transactions in the area.
Session_Color : Enter your desired color to display the session at this section. It is recommended to use bright and sharp colors.
Info_Color : Enter your desired color to display more information in this section.
🔵 Function Outputs
The outputs of this function are direct and indirect.
🟣 Indirect outputs
These outputs include session display, kill zone display, and time and volume information of session or kill zone.
🟣 Direct outputs
There are 8 direct outputs, which are:
Session Time : If the Session is active, it outputs 1, and if the Session is inactive, it outputs 0.
Kill Zone Time : If the Kill Zone is active, it outputs 1, and if the Kill Zone is inactive, it outputs 0.
Open : Session opening price.
High : The highest price of the session.
Low : The lowest price of the session.
Close : The last price of the session.
Low Touch Alert : If "Area Update" is in "Kill Zone" mode, if the price reaches the lowest price of the kill zone in the same session after the end of the kill zone, this output will be true. You can use this output to create an alert.
High Touch Alert : If "Area Update" is in "Kill Zone" mode, if the price reaches the highest price of the kill zone in the same session after the end of the kill zone, this output will be true. You can use this output to create an alert.
Important : To use "Open", "High", "Low" and "Close", "Area Update" must be in "Session" mode.

NY Killzone (Morning, Lunch, Afternoon)Indicator for New York session that splits Morning, Lunch and Afternoon part of the session.
Works on Time Frames of 30m and below.
London Killzone + Deviations[MK]For traders that use the London Killzone session high/low to project possible take profit targets.
The indicator will determine the current day London killzone high and low range and draw a range box to the right of the last candle on the chart. Drawing to the right of the chart keeps the workspace cleaner.
The high/low range is then used to project Standard Deviation levels above and below the London range.
Levels projected are +/- 1, 2, 2.5, 3, 4.
Users of the script should conduct proper backtesting using a large data range before applying to live accounts.

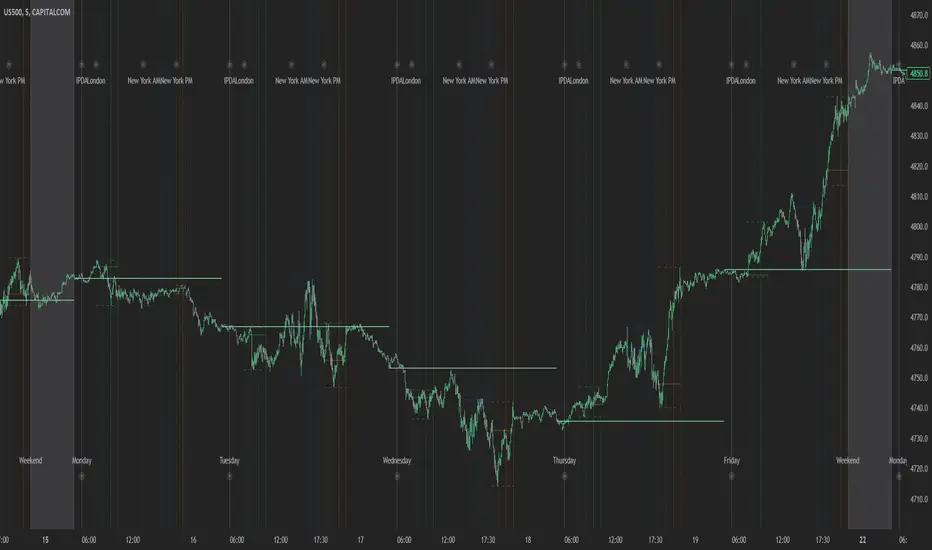
Index Kill Zones - SMC IndicatorsWhat are Index Kill Zones?
Index Kill Zones are specific Time Windows of opportunity during the Session for Indices that have the potential for the highest volatility and where looking for trading opportunities is ideal.
The Index Kill Zone Indicator is specifically designed for the SP500, NQ100, and DJ30, Markets. What differentiates this script from other Kill Zones scripts is that this script is based on NY Midnight as the basis for the start of the day.
This is not the usual below-average Index Kill Zone indicator because this indicator does not only show the 3 main Kill Zones or Sessions, but it also offers extra Kill Zones within each session that are called "AM Session", "PM Session", the "Launch Hour", the "Silver Bullet for the London, AM, and PM Sessions", and the "Last Hour" for the London, AM, and PM sessions.
Another key differentiator of this indicator's functionality is that it shows the highs and lows of each Kill zone allowing SMC traders to monitor Time-Based Liquidity above the highs and lows of each trading session.
By splitting each trading day into AM and PM Sessions, we can identify 3 types of potential daily profiles. These daily profiles could be used as conceptual templates as to what to expect from the price during a certain day. The 6 templates are the following:
1. Two Sessions Up: Where the price would go in one direction higher during both the AM and PM Sessions.
2. Two Sessions Down: Where the price would go in one direction lower during both the AM and PM Sessions.
3. AM Rally, then PM Decline: The price would go higher during the AM session and then lower during the PM Session.
4. AM Decline, then PM Rally: The price would go lower during the AM session and then higher during the PM Session.
5. Consolidation, AM Rally, then PM Decline: Where the price would consolidate most of the AM Session, then go higher into the last hour, and then reverse and go lower during the PM Session.
5. Consolidation, AM Decline, then PM Rally: Where the price would consolidate most of the AM Session, then go lower into the last hour, and then reverse and go higher during the PM Session.
Within each AM and PM Session, there is a "Silver Bullet" that acts as a time window of opportunity to get into a continuation trade in the direction of the prevailing trend.
Also, within each AM and PM Session, there is a "Last Hour" that acts as a time window of opportunity to get into a trade in the direction of the potential trend if the price has not moved yet, or as a reversal trade opportunity if the price has already ran previous short-term highs or lows.
Finally, we have also incorporated a Notification function to remind the trader of the start of the trading Kill Zones to not miss out on potential trade opportunities.
Key Functionalities
Universal Time Reference
Every day starts at 00:00 NY Midnight, irrespective of the trader's local time, Instead of the Standard GMT Midnight. This allows all Index Kill Zones to be in line with the New York start of the day at Midnight, as taught by ICT.
Weekend Highlighter
This feature highlights time from Sunday Market Open at 5 PM NY Time to 00:00 NY Midnight.
It's useful for identifying the non-trading or the low volatility periods when trading should be avoided.
Features Breakdown
Lookback Period
Defaulted to 60 trading days, aligning with “IPDA Data Ranges”, which is ideal for backtesting.
It's adjustable for trading, and it's recommended to keep it at 20 trading days to focus on the most recent data only.
24-hour Daily Intervals
The 24-hour intervals are not the same as the usual daily candle. Instead, the start of each trading day is anchored to the 00:00 NY Midnight.
Highlights "Days of the Week" labels, "Weekend" Trading Time, and the daily high-low ranges based on the start of trading day mark being at 00:00 NY Midnight.
London Kill Zones (Green)
The Full London Session starts from 02:00 NY Time to 05:00 NY Time.
London Silver Bullet starts from 03:00 NY Time to 04:00 NY Time.
London Last Hour starts from 04:00 NY Time to 05:00 NY Time.
Highlights the high and low of the London Kill Zone to Identify Time-Based Liquidity above and below the London Kill Zone Range.
AM Session Kill Zone (Blue)
The full AM Session Starts from 09:30 NY time to 12:00 NY Time.
AM Session Silver Bullet starts from 10:00 NY Time to 11:00 NY Time.
AM Session Last Hour starts from 11:00 NY Time to 12:00 NY Time.
Highlight the high and low of the AM Session to Identify Time-Based Liquidity above and below the AM Session Range.
Highlights the time when there is the highest volatility during the AM Session.
PM Session Kill Zone (Orange)
The full PM Session Starts from 13:00 NY time to 16:00 NY Time.
PM Session Silver Bullet starts from 14:00 NY Time to 15:00 NY Time.
PM Session Last Hour starts from 15:00 NY Time to 16:00 NY Time.
Highlight the high and low of the PM Session to Identify Time-Based Liquidity above and below the PM Session Range.
Highlights the time when there is the highest volatility during the PM Session.
Bonus Features
Daily & Weekly Open Price Levels
The Open Price levels draw a horizontal line from the start of the trading day at 00:00 NY midnight, and it extends it towards the end of the trading day.
This is useful for understanding where the price is relative to the daily candle.
When Bullish, the trader should look for setups at or below the daily or weekly open price.
When Bearish, the trader should look for setups at or above the daily or weekly open price.
Whether to choose the Daily or Weekly open price depends on the trader's trading style. If the trader is day trading or scaling, then it's more appropriate to choose the Daily Open Price.
However, Day Traders can also use the Weekly candle to align with the Weekly Candle's expected range direction.
On the other hand, if the trader is a Swing Trader and wants to capitalise on the weekly candle's trend, then it's more appropriate to choose the Weekly Open Price.
However, Swing Traders can also use the Daily Open Price when looking to take a trade to time better entries with a high risk-to-reward ratio.
Daily Open Price Level (in Green) and Weekly Open Price Level (in White)
Kill Zones Open Price Level
This is useful if the trader is an intra-session trader and wants to treat the sessions as the daily candle. In this case, the trader can use the Kill Zones Open Price levels based on the same logic of the Daily Open Price, where the trade would look for buy opportunities below the Session's open price and look for sell opportunities above the Session's Open Price Level.
Notifications
The trader can also receive alerts as a reminder at the start of the desired session to ensure that he or she does not miss the start of the trading session.
Forex Kill Zones - SMC IndicatorsWhat are Kill Zones?
Kill Zones are specific Time Windows of opportunity during the Session that have the potential for the highest volatility and where looking for trading opportunities is ideal.
The Forex Kill Zone Indicator is specifically designed for the Forex Market. What differentiates this script from other Kill Zones scripts is that this script is based on NY Midnight as the basis for the start of the day.
This is not the usual below-average Kill Zone indicator because this indicator does not only show the 3 main Kill Zones or Sessions, but it also offers extra Kill Zones that are called "Asian Range (AR)", "Central Bank Dealing Range (CBDR)", and "FLOUT".
Another key differentiator of this indicator's functionality is that it shows the highs and lows of each Kill zone allowing SMC traders to monitor Time-Based Liquidity above the highs and lows of each trading session.
Another added benefit of this indicator is the Standard Deviations features for the AR, CBDR, and FLOUT that we added. The Standard Deviations act as key levels where there is a high probability of price reacting when in confluence with 1H or higher key levels (PD Arrays). The Standard Deviations are not pivot levels but are ranges above and below the Kill Zones that rely on TIME and PRICE in their calculations.
Finally, we have also incorporated a Notification function to remind the trader of the start of the trading Kill Zones to not miss out on potential trade opportunities.
Key Functionalities
1) Universal Time Reference:
Every day starts at 00:00 NY Midnight, irrespective of the trader's local time, Instead of the Standard GMT Midnight. This allows all Kill Zones to be in line with the New York start of the day at Midnight, as thought by ICT.
Weekend Highlighter
This feature highlights time from Sunday Market Open at 5 PM NY Time to 00:00 NY Midnight.
It's useful for identifying the non-trading or the low volatility periods when trading should be avoided.
Features Breakdown
Lookback Period
Defaulted to 60 trading days, aligning with “IPDA Data Ranges”, which is ideal for backtesting.
Adjustable for trading, and it's recommended to keep it at 20 trading days to focus on most recent data only.
24-hour Daily Intervals
The 24-hour intervals are not the same as the usual daily candle. Instead, the start of each trading day is anchored to the 00:00 NY Midnight.
Highlights "Days of the Week" labels, "Weekend" Trading Time, and the daily high-low ranges based on the start of trading day mark being at 00:00 NY Midnight.
London Kill Zone (Green)
Starts from 01:00 NY Time to 05:00 NY Time.
London closes at 12:00 NY Time.
Highlight the high and low of the London Kill Zone to Identify Time-Based Liquidity above and below the London Kill Zone Range.
Marks the London Close Session to mark the end of London End of the trading day, where volatility drops.
Highlights the time when there is the highest volatility during the London Session Kill Zone.
New York Kill Zone (Blue)
Starts from 07:00 NY time to 10:00 NY Time.
Marks The CME Open at 08:30 (the opening of the Bond Market).
Highlight the high and low of the New York Kill Zone to Identify Time-Based Liquidity above and below the NY Kill Zone Range.
Highlights the time when there is the highest volatility during the New York Session.
The Central Bank Dealing Range or "CBDR" (Orange)
Starts From 14:00 NY Time to 20:00 NY Time.
Highlight the high and low of the CBDR Kill Zone to Identify Time-Based Liquidity above and below the CBDR Kill Zone Range.
Also, there is an added ability to add the CBDR Standard Deviations above and below the CBDR.
Can also extend the CBDR Standard Deviations key levels until the end of the next day's London Kill Zone.
What are the CBDR Standard Deviations?
The Standard Deviations are extensions of the CBDR above and below the CBDR original range. It takes the high and low of the range and adds the range above and below the original range by x times.
The CCBDR Standard Deviations are NOT pivot levels. They are used as points of reference where we could expect the price to react when in confluence with higher timeframe reference points.
The idea behind them is that if the price is Bearish, the price could rally to +1 CBDR Standard Deviation below dropping lower. As shown in the image below on Thursday, the two vertical lines before the start of Thursday mark the CBDR Kill Zone, then the price rallied to +1 CBDR SDv and then dropped.
Asian Range "AR" Kill Zone
Starts from 20:00 NY Time to 00:00 NY Time.
Highlight the high and low of the AR Kill Zone to Identify Time-Based Liquidity above and below the AR Kill Zone Range.
Also, there is an added ability to add the AR Standard Deviations above and below the AR.
This KillZone should be primarily used when CBDR exceeds 40 pips.
Similar to the CBDR, the AR Standard Deviations also can be used as points of reference where we could expect the price to react when in confluence with higher timeframe reference points.
The AR Standard Deviations can also be extended until the end of the next day's London Kill Zone.
FLOUT Range
It Combines AR and CBDR, spanning from 14:00 NY Time to 00:00 NY Time.
The FLOUT should only be used when both AR and CBDR have small ranges of less than 10 pips combined.
Highlight the high and low of the FLOUT Kill Zone to Identify Time-Based Liquidity above and below the FLOUT Kill Zone Range.
The FLOUT Standard Deviations also can be used as points of reference where we could expect the price to react when in confluence with higher timeframe reference points.
The Flout Standard Deviations can be extended until the end of the next day London Kill Zone.
Bonus Features
Daily & Weekly Open Price Levels
The Open Price levels draw a horizontal line from the start of the trading day at 00:00 NY midnight, and it extends it towards the end of the trading day.
This is useful for understanding where the price is relative to the daily candle.
When Bullish, the trader should look for setups at or below the daily or weekly open price.
When Bearish, the trader should look for setups at or above the daily or weekly open price.
Whether to choose the Daily or Weekly open price depends on the trader's trading style. If the trader is day trading or scaling, then it's more appropriate to choose the Daily Open Price.
However, Day Traders can also use the Weekly candle to align with the Weekly Candle's expected range direction.
On the other hand, if the trader is a Swing Trader and wants to capitalise on the weekly candle's trend, then it's more appropriate to choose the Weekly Open Price.
However, Swing Traders can also use the Daily Open Price when looking to take a trade to time better entries with a high risk-to-reward ratio.
Notifications
The trader can also receive alerts as a reminder at the start of the desired session to not miss out on the start of the trading session.

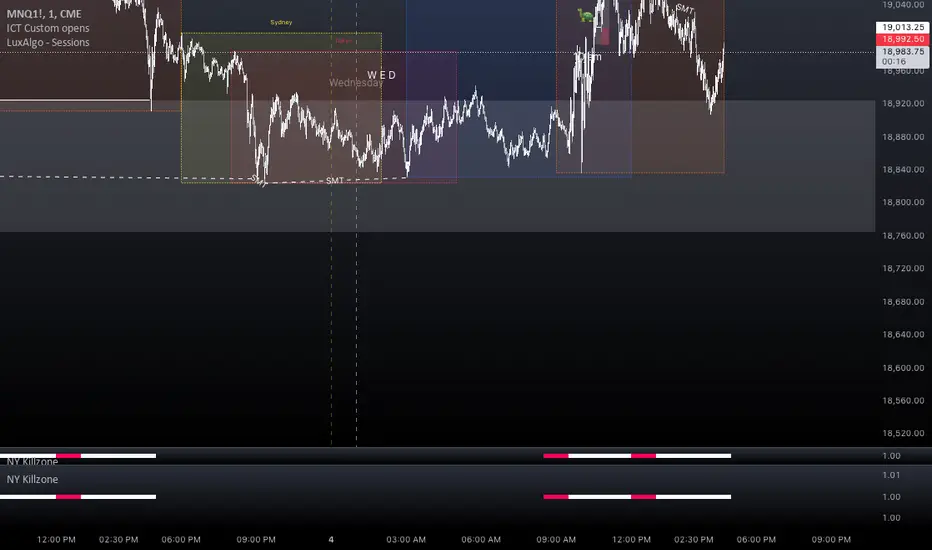
itradesize /\ Silver Bullet x Macro x KillzoneThis indicator shows the best way to annotate ICT Killzones, Silver Bullet and Macro times on the chart. With the help of a new pane, it will not distract your chart and will not cause any distractions to your eye, or brain but you can see when will they happen.
The indicator also draws everything beforehand when a proper new day starts.
You can customize them how you want to show up.
Collapsed or full view?
You can hide any of them and keep only the ones you would like to.
All the colors can be customized, texts & sizes or just use shortened texts and you are also able to hide those drawings which are older than the actual day.
You should minimize the pane where the script has been automatically drawn to therefore you will have the best experience and not show any distractions.
The script automatically shows the time-based boxes, based on the New York timezone.
Killzone Time windows ( for indices ):
London KZ 02:00 - 05:00
New York AM KZ 07:00 - 10:00
New York PM KZ 13:30 - 16:00
Silver Bullet times:
03:00 - 04:00
10:00 - 11:00
14:00 - 15:00
Macro times:
02:33 - 03:00
04:03 - 04:30
08:50 - 0910
09:50 - 10:10
10:50 - 11:10
11:50 - 12:50

ICT Kill Zones [dR-Algo]ICT Kill Zones Indicator by dR-Algo
Introducing the dR-Algo's ICT Kill Zones Indicator – a tool meticulously crafted to blend with the elegance of the ICT Concept of Kill Zones. Built for traders who seek clarity and focus, this unique indicator is tailored to highlight the essential time frames while ensuring minimal distraction from the core price action.
Key Features:
Three Kill Zones:
London Kill Zone: Kickstart your trading day with the London Kill Zone, highlighting the critical period between 03:00 to 04:00 (UTC-4). The London session, known for its volatility due to the overlapping of the Asian session, is captured precisely for your benefit.
NY AM Session: As the European markets gear towards close and the US markets come alive, our indicator emphasizes the activity from 10:00 to 11:00 (UTC-4). It’s a window where significant market moves often originate.
NY PM Session: Capture the late-day trading action between 14:00 to 15:00 (UTC-4). As markets prepare to close, this time frame can offer last-minute opportunities.
Subtle Yet Effective Visualization: Unlike many other indicators that bombard traders with an array of colors, our ICT Kill Zones Indicator is intentionally designed to be subtle. It provides just the right amount of visual emphasis without overwhelming the chart. The primary goal is to let traders focus on what truly matters: the price action.
User-Friendly Customization: The indicator's settings can be easily tailored to align with individual trading styles, allowing traders to adjust and tweak as per their preference.
Seamless Integration with Trading View: Smoothly integrates with your TradingView charts ensuring optimal performance and real-time responsiveness.
Why Choose Our ICT Kill Zones Indicator?
The market is flooded with indicators, each promising to be the 'next big thing.' What sets dR-Algo's ICT Kill Zones Indicator apart is its dedication to simplicity and effectiveness. It's not just about adding an indicator to your chart; it's about adding value to your trading experience. By seamlessly merging vital time frames without overshadowing the price action, we ensure traders get the best of both worlds.
Join the trading revolution with dR-Algo and embrace a focused approach to the markets.

ICT Killzones + Pivots [TFO]Designed with the help of TTrades and with inspiration from the ICT Everything indicator by coldbrewrosh, the purpose of this script is to identify ICT Killzones while also storing their highs and lows for future reference, until traded through.
There are 5 Killzones / sessions whose times and labels can all be changed to one's liking. Some prefer slight alterations to traditional ICT Killzones, or use different time windows altogether. Either way, the sessions are fully customizable. The sessions will auto fit to keep track of the highs and lows made during their respective times, and these pivots will be extended until they are invalidated.
There are also 4 optional Open Price lines and 4 vertical Timestamps, where the user can change the time and style of each one as well.
To help maintain a clean chart, we can implement a Cutoff Time where all drawings will stop extending past a certain point. The indicator will apply this logic by default, as it can get messy with multiple drawings starting and stopping throughout the day at different times.
Given the amount of interest I've received about this indicator, I intend to leave it open to suggestions for further improvements. Let me know what you think & what you want to see added!

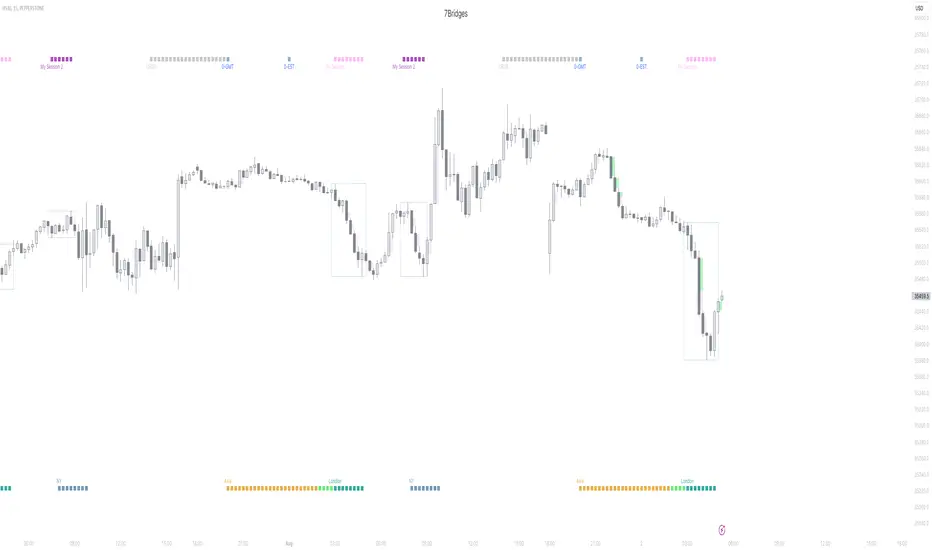
Session KillZones [7Bridges]Session Killzones by 7Bridges indicator display the killzones of asian, LND and NY sessions. There is also a custom session of your choice.
The times of each killzone are GMT time and you can adjust it in the settings.
You have also the beginning of the day, GMT and EST timezones.
By default the killzones are set like that on the GMT/UTC timezone :
-> Asia : 00:00 - 06:00
-> Pre London : 06:00 - 07:00
-> London : 07:00 - 10:00
-> New York : 12:00 - 15:00
-> Custom session : choose your own time
What makes the indicator very different is that the session is not overlapping the price but you have bars below and above the price.
Settings:
-> you can chose to display the Killzones (Asia, pre LND, LND and NY)
-> you can manages the time of the sessions
-> you can chose to display the start of the day (GMT/UTC and EST )
The indicator is displayed by default only for all the timeframes below 60min.
ICT MacrosThis script allows traders to visualize the range of time when a macro (an automated series of instructions/trades from large fund traders, executed by an algorithm) will likely occur in the market. It does this by drawing vertical lines and labels on the chart at these specific times:
(Macro Open) - 9:50 AM EST
(Macro Close) - 10:10 AM EST
(Macro Open) - 10:50 AM EST
(Macro Close) - 11:10 AM EST
(Macro Open) - 1:10 PM EST
(Macro Close) - 1:40 PM EST
(Macro Open) - 3:15 PM EST
(Macro Close) - 3:45 PM EST
The theory behind the use of these macros - is that the market will either seek buy side or sell side liquidity, or seek to rebalance price at a point of interest in between the open and close of the macro. Traders who follow this theory can use that information to anticipate how price might behave.
When a macro occurs, the script draws a vertical line on the chart using a dotted line style with a user-defined color. Additionally, a label is placed above the line to indicate whether it is a Macro Open or Macro Close event.
To preserve space, the labels are abbreviated on chart - "Macro Open" (M.O.) and "Macro Close" (M.C.) for both the morning and afternoon trading sessions. The labels may be turned on/off by the user.
The script also includes alerts that can notify traders when a macro occurs. These alerts can be set to go off once per bar close, and the alert message indicates the specific macro type and time.
This script is entirely open-source, meaning that traders can read the code and modify it as needed. Credit to the foundation of this script goes to TradingView user @rickyzcarroll for his open source Strat Assistant Hour Flip script. Important changes include the specific time changes and alert function.

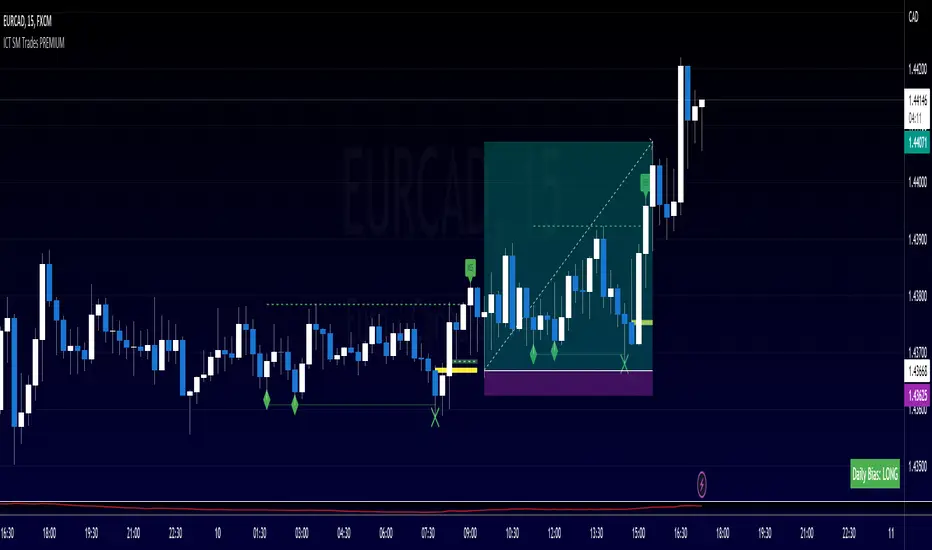
ICT SM Trades PREMIUMIndicator looks for ICT & Smart Money trades on any timeframe. These types of trades reveal how the big institutions, banks and hedge funds trade with big money. If they want their very big positions to be filled they need to find areas in chart where the majority of the money is sitting. Where is it? Where is the majority of orders placed? Right below supports or right above resistance, these orders are stoplosses or stop orders. So they need to push the price to these areas, take all the available stoplosses and trigger all the available stop orders in order to fill their positions and then push the price to the opposite side to make profit (and retail to lose).
Indicator looks for support or resistance (S/R) areas which are represented by dotted lines. This S/R areas are created by minimum of 2 pivot high/low (H/L). Every pivot H/L that creates the S/R area is marked with diamond label. This S/R area is called liquidity. After liquidity is created, indicator looks for liquidity grab (mostly represented by fast spike to this area - it is labeled with x-cross) and then price should go fast to the opposite side of the created structure. Indicator considers as a created structure everything that was created on the other side of the candles from the oldest pivot H/L which creates particular liquidity. For example, if liquidity is created with 3 pivot highs, indicator looks at the oldest pivot high and from there it is looking for the lowest low. Under this lowest low is dashed line which means that this level should be broken with closed candle. This action is called market structure shift (MSS), when the price shifted very fast from highs to lows. After MSS, when the price went fast to one direction, there were some imbalances in prices, in our example selling pressure was a lot bigger than buying pressure and there were created some long untested bearish candles. This untested areas in candles are called imbalances or gaps of fair value gaps (FVG). These are labeled with rectangles. It is expected that these gaps will be tested in near future to "balance the market".
We can put limit orders into these gaps (or into order blocks in PREMIUM indicator) and await some retracement after MSS to open our positions and after the positions are opened we can expect trend continuation in the direction where market structure shift was made (away from liquidity grab). So stoplosses can be placed above/below liquidity grab candle (marked with x-cross).
Alerts can be set for MSS to Long & Short and for liquidity grabs to Long & Short.
All settings of this indicator should be self-explanatory and most of them have tooltips for better understanding.
30MIN CYCLE█ HOW DOES IT WORK?
The known 90 min cycle is used as one killzone. But actually all 18 min are relevant to search for a trade. All 18 min when a new box starts only then is the placement of an order valid. If the entry candle isn't in a box then it will probably fail. The boxes should only be used in the M1 or M5 timeframe. The best hitrate is in the M1 timeframe. Included are the last 48 "Mini-Killzones" für intraday trading and backtesting. These "Mini-Killzones" can be used with the "Liquidity Inducement Strategy".
█ WHAT MAKES IT UNIQUE?
This is the first indicator on tradingview that shows all mini-killzones for trading and backtesting a whole tradingday. The well-known killzones of ICT are from 08:00-11:00 and 14:00 - 17:00 (UTC+1) but with this indicator there is finally a refinement of the ICT Smart Money Concept killzones.
█ HOW TO USE IT?
For a proper use of this indicator we suggest to know already at least SMC or better Liquidity Indcuement Trading. This indicator is a further confluence before placing an order. After you made your setup you will have these mini-killzones as a confluence. We don't suggest to open a trade only according to this indicator.
█ ADDITIONAL INFO
This indicator is free to use for all tradingview users.
█ DISCLAIMER
This is not financial advice.

ICT Killzone by JeawThis is an indicator script for TradingView called "ICT Killzone". It is a useful tool for identifying the London and New York open and close sessions, as well as the Asian range on the chart. The appearance of the "killzones" can be customized by selecting colors and transparencies for each session. Boxes can also be displayed around each session and labels with additional information can be added. This script is compatible with intraday charts and time multipliers up to 60 minutes. It was created by Jeaw and is based on the ideas of the ICT (Institutional Cash Trades) methodology. This script can help traders avoid entering the market during high impact news events and periods of low liquidity. By identifying these potentially volatile times, traders can better manage their risk and improve their overall trading strategy.

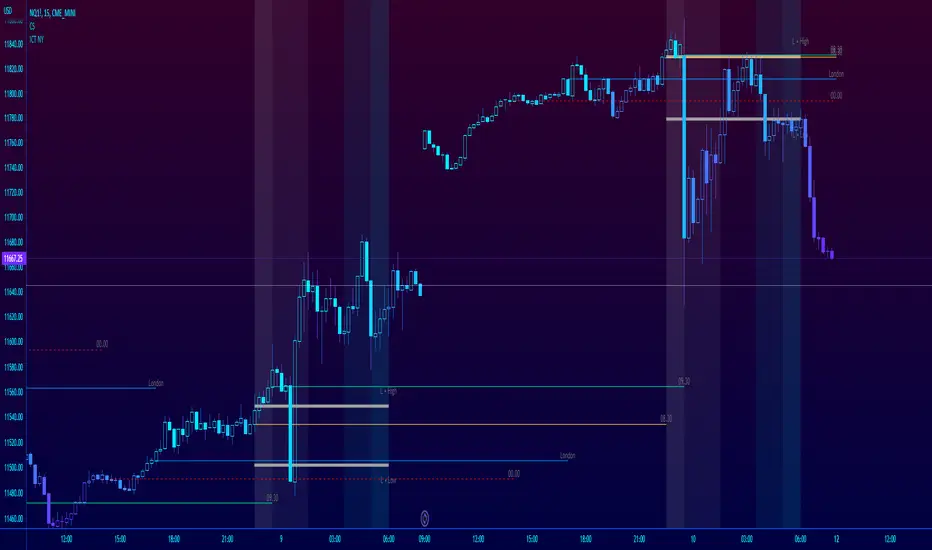
ICT NY Futures Indices Session Model - YT New York MentorshipThis indicator plots out the time periods and open lines as outlined in ICT's 2022 Mentorship and is designed specifically for the New York futures trading session.
Time zone is set to GMT-4 (NY) by default but can be changed for accommodate daylight saving in the menu.
Please note this indicator is to be used only on the 30min timeframe and below.
Here are its features:
The background color shows the morning session, in two parts (8.30am to 9.30am and 9.30am to 11.30am), then a two hour gap for lunch (ICT calls this "Dead time") and finally, the afternoon session, also to two (1.30pm to 3pm and 3pm to 4pm).
It not only shows the current killzones, but future zones as well.
These times are important; trades can be framed within these zones as taught in the mentorship.
Next are the open lines. These lines are automatically plotted and can be areas for price to react off of; they are the opening price of a candle at these times:
00.00 (New York Midnight, also known as "True Day Open")
8.30am (New York Equities pre-open)
9.30am (New York Equities open)
2.00am (London Stock Exchange open)
And lastly, London's trading session High and Low are projected forward onto the New York trading session.
These two price points are areas of liquidity that were pooled during London, but they can also often set the high or low of the day.
Please let me know if there are any bugs or if you have suggestions for the next update.
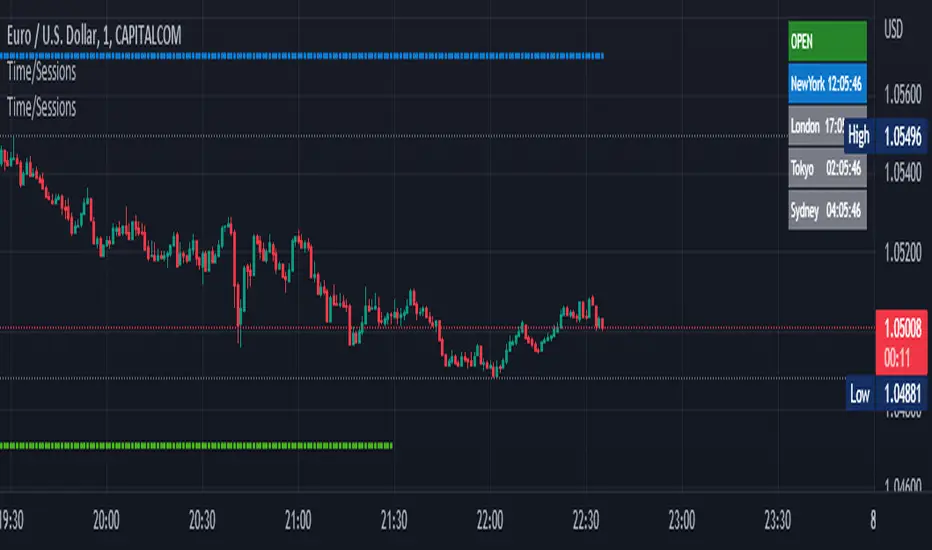
Time Zone / Market SessionsTime Zone / Market Sessions indicator is a handy tool to display current major Market Open / Close condition along with present time at that Exchange. Sydney, Tokyo, London, New York market sessions are included. Clear display of Overlap Zones and Kill Zones.. Can be used to estimate market Pumping and Dumping. Alerts can be set when a market opens.
Time is Displayed in Table Layout
Active Market is displayed as Dots on top and bottom
You can select as Timeline or Table display
Overlap is clearly displayed on top and bottom without any mess
Gray color in Table layout Shows Closed Markets
You are free to reuse this code No Limitations.
Kill Zones are indicated in Table format. When some of the markets are closed
Alerts included for market openings
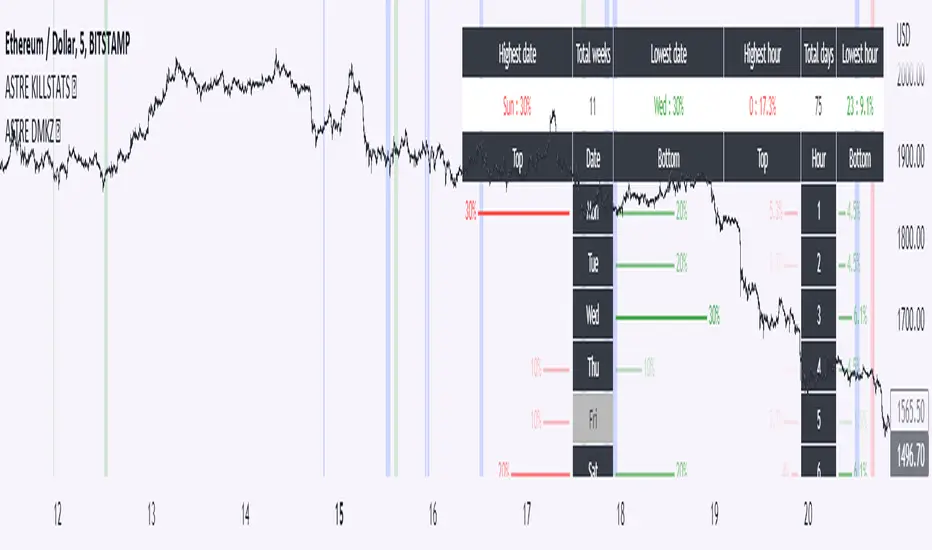
Daily Manual KILLZONESThis indicator is to be used with "KILLSTATS", our indicator allowing to backtest on hundreds of days at which time, and which day the top/low of the day and week is formed.
"Manual Killzone" allows to define our statistical killzones by day of the week manually: you define your own rules according to your interpretation of our Killstats indicator.
It integrates a daily price action filter according to the ICT concept:
It will only display bullish probabilities (green) defined if and only if we are in discount and out of the daily range 25/75%.
Same for bearish probabilities (red)
The blue color is to be applied in case of reversal with high contradictory probability (Example: to be used for Tuesday from 2pm to 3pm, if Tuesday is a day with high probability to form a top, but 2pm/15pm is the time with high probability to form a bottom AND a top. Indecision => blue)
WARNING : Calculated according to Etc/UTC time : put "0" in the Timezone parameter of killstats.
It is necessary to use the replay mode regularly during the backtesting to update the data!
ICT SM Trades (liquidity find & grab, MSS, FVG, killzones)Indicator looks for ICT & Smart Money trades on any timeframe. These types of trades reveal how the big institutions, banks and hedge funds trade with big money. If they want their very big positions to be filled they need to find areas in chart where the majority of the money is sitting. Where is it? Where is the majority of orders placed? Right below supports or right above resistance, these orders are stoplosses or stop orders. So they need to push the price to these areas, take all the available stoplosses and trigger all the available stop orders in order to fill their positions and then push the price to the opposite side to make profit (and retail to lose).
Indicator looks for support or resistance (S/R) areas which are represented by dotted lines. This S/R areas are created by minimum of 2 pivot high/low (H/L). Every pivot H/L that creates the S/R area is marked with diamond label. This S/R area is called liquidity. After liquidity is created, indicator looks for liquidity grab (mostly represented by fast spike to this area - it is labeled with x-cross) and then price should go fast to the opposite side of the created structure. Indicator considers as a created structure everything that was created on the other side of the candles from the oldest pivot H/L which creates particular liquidity. For example, if liquidity is created with 3 pivot highs, indicator looks at the oldest pivot high and from there it is looking for the lowest low. Under this lowest low is dashed line which means that this level should be broken with closed candle. This action is called market structure shift (MSS), when the price shifted very fast from highs to lows. After MSS, when the price went fast to one direction, there were some imbalances in prices, in our example selling pressure was a lot bigger than buying pressure and there were created some long untested bearish candles. This untested areas in candles are called imbalances or gaps of fair value gaps (FVG). These are labeled with rectangles. It is expected that these gaps will be tested in near future to "balance the market".
We can put limit orders into these gaps and await some retracement after MSS to open our positions and after the positions are opened we can expect trend continuation in the direction where market structure shift was made (away from liquidity grab). So stoplosses can be placed above/below liquidity grab candle (marked with x-cross).
In settings of the indicator you can set whether only long or only short trades will be shown. Long trades are green and short trades are red. You can set if fair value gaps will be shown as well. The last thing in settings is session. You can set custom session which will be shown as background color on your chart.
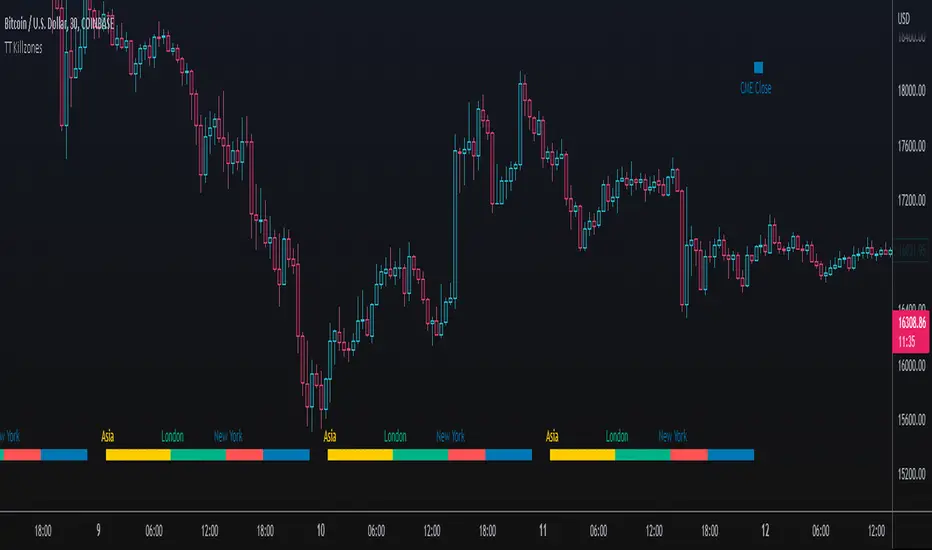
TT KillzonesThis indicator plots the 3 main trading zones : Asia, London, New York
Its is also possible to use a different color for the "High Trading Volume" timezone. It can be adjusted. Default is the overlapping time of London and New York Killzone
It also plots the CME open / close
This indocator can be used as example / copy for your own project!
Have fun!