SFL Levels - levels that matterThis is an indicator that gives you an easy way to display the following significant levels on a chart:
- The daily open
- The weekly open
- The monthly open
- Yesterday's high and low price
- Last week's high and low price
These levels often function as natural support and resistance and because of that, it's relevant to have them on your charts.
Every type of level can be enabled or disabled, allowing you to easily customize for the levels you want to see.
The colours and line types can also be changed as you wish.
Levels

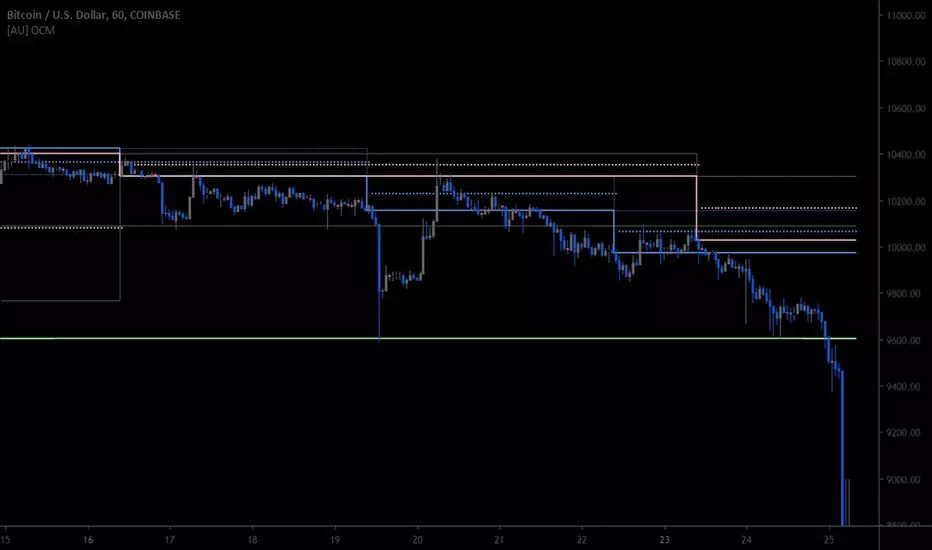
[AU] Open Close MidlineSimple open, close, midline indicator for 3D, W, M. Much less complex than Levels.
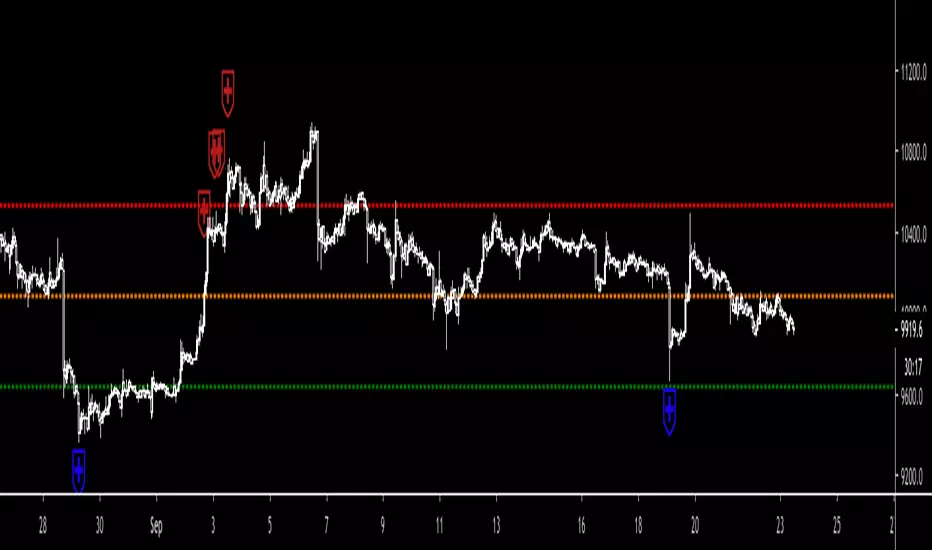
Flunki Scalp Horizons v4A little thank you gift for reaching 1000+ followers on Twitter... w00t.
On chart DYNAMIC horizontal Oversold / Overbought oscillator levels.
Being dynamic, they change, dynamically :)
Play with the numbers.
Also Oversold / Overbought flags.
Cheers !
How To Use Dynamic ZonesExample of how to apply and use Dynamic Zones with an indicator by injecting it's source into my adaptation of the original idea by Leo Zamansky, Ph.D., and David Stendahl.
• Load your desired oscillating indicator on your chart (CCI, RSI, etc).
• Load my "How To Use Dynamic Zones" indicator on your chart.
• In the "How To Use Dynamic Zones" indicator settings choose your desired oscillating indicator as the Oscillator Source.
You will now have dynamic overbought and oversold levels. I have also included alerts which may be used to indicate when these conditions occur.
If desired you may repeat the above process by loading additional indicators along with additional copies of my indicator to use with each oscillator.
Oscillator Source: CLOSE uses your chosen indicator as a source or you may use price as a source
Sample Length: 70 uses number of previous values for evaluating
Hi is Above X% of Sample: 88 sets overbought zone
Lo is Below X% of Sample: 88 sets oversold zone
The simplest explanation of what these default settings are doing is that they take 70 previous values of your chosen indicator, then create an overbought level that is above 88% of those previous values and an oversold level that is below 88% of those previous values. As new bars form the levels are dynamically reevaluated and updated.
---
"This investing style follows a very simple form of logic: Enter the market only when an oscillator has moved far above or below traditional trading levels. However, these oscillator driven systems lack the ability to evolve with the market because they use fixed buy and sell zones. Traders typically use one set of buy and sell zones for a bull market and substantially different zones for a bear market. And therein lies the problem.
Once traders begin introducing their market opinions into trading equations, by changing the zones, they negate the system’s mechanical nature. The objective is to have a system automatically define its own buy and sell zones and thereby profitably trade in any market — bull or bear. Dynamic zones offer a solution to the problem of fixed buy and sell zones for any oscillator-driven system."
Reference: Stocks & Commodities V15:7 (306-310): Dynamic Zones by Leo Zamansky, Ph.D., and David Stendahl
---
NOTICE: This is an example script and not meant to be used as an actual strategy. By using this script or any portion thereof, you acknowledge that you have read and understood that this is for research purposes only and I am not responsible for any financial losses you may incur by using this script!

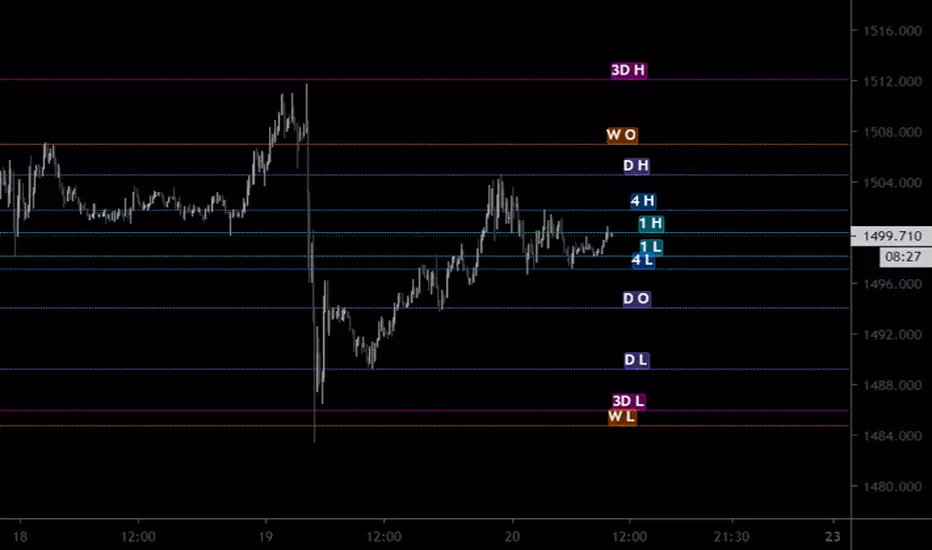
[AU] Price Action Levelsv2a
Price action levels for multiple timeframes with standard alignment and offset options using modulus for stagger and spacing
1hr, 4hr, D, 3D, W, M, Quarter, Year timeframes and levels available
Based upon Long term levels by scarf()

Candle (High/Low/Close)-MTF [Anan]
Hello Friends,,
This is just multi time frame candle plot (High / Low / Close) on your current chart resolution.

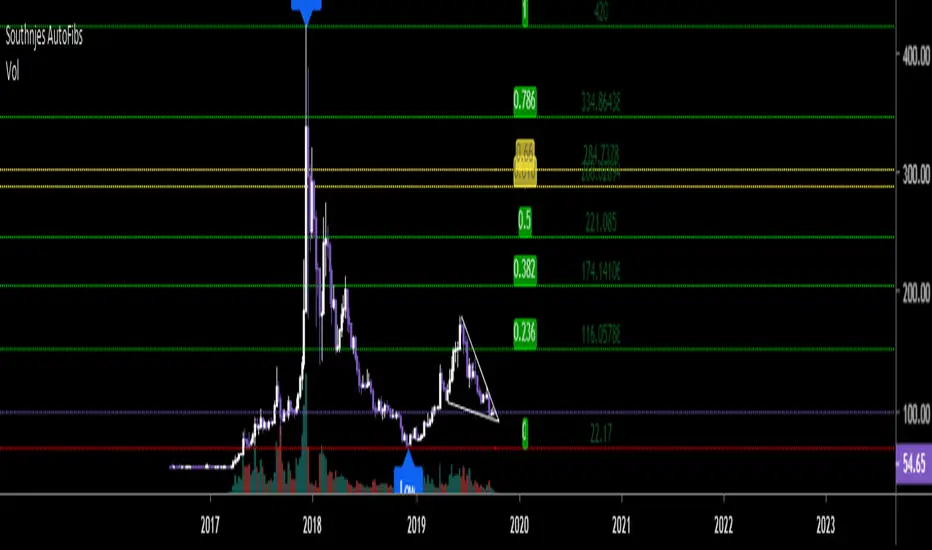
Southnjes - Auto Fibonacci LevelsI obtained this script elsewhere and modified it. Original Script by "borserman". Thank you for this.
I added some extras that he did not have, hence the uploaded and modified version.
I tried to add this to my "Southnjes- Multi 5MA/5EMA crossover signal + RSI/MACD/STOCH Div signal + Bollinger + Candlestick signals." But there were too many outputs so it had to go separate.
Anyway. You can change the "Fib period" to get the positions you need on the levels. Default is 100 but I will change mine to 25/50/200 and sometimes 180 or 220 which gives me my needed highs and lows for calculations. Play with it as it only takes a minute or so to get the desired H/L.
Golden pocket is mapped in golden.
Green is up, Red is down.
Higher Fib levels can be turned off or on (1.272-3.618).
I hope you all enjoy it and again, don't forget to visit borserman for his other great scripts. :)
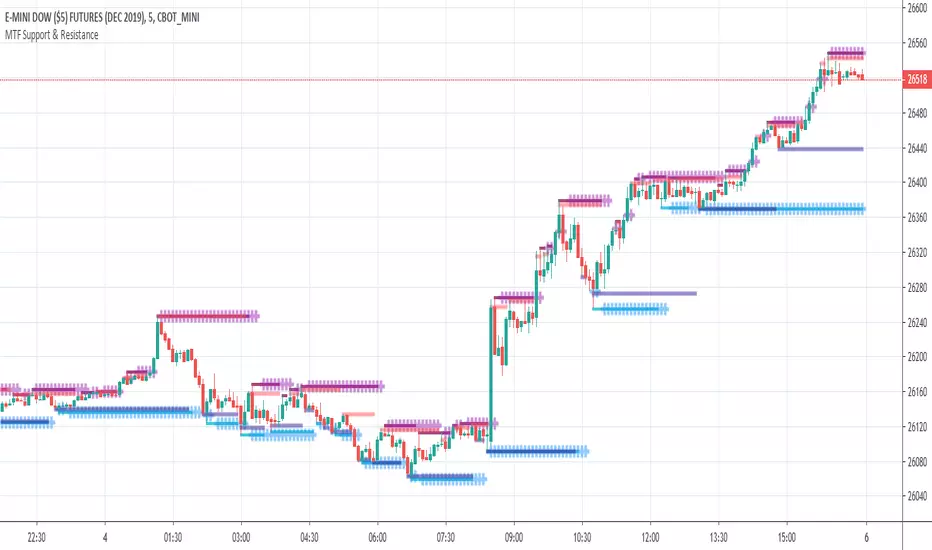
THD MTF Support & ResistanceThe TradersHelpDesk MTF support and resistance identifies the support or resistance on multiple timeframes.
Auto Fibonacci Retracement Levels A Fibonacci retracement is a popular tool that traders can use to identify support and resistance levels, and place stop-loss orders or target prices.
The indicator connects any two points that are relevant, a high and low point.
The percentage levels provided are areas where the price could stall or reverse.
Levels should not be relied on exclusively. For example, it is dangerous to assume the price will reverse after hitting a specific Fibonacci level. It may, but it also may not.
Fibonacci retracement levels are most frequently used to provide potential areas of interest. If a trader wants to buy, they watch for the price to stall at a Fibonacci level and then bounce off that level before buying.
The most commonly used ratios include 23.6%, 38.2%, 50%, 61.8% and 78.6%. These represent how much of a prior move the price has corrected or retraced.

Previous OHLC LevelsQuick dirty code for personal use. Plots previous OHLC levels based on a selected time-frame on the chart.
Not bad if you want to see different time-frame levels.
Fill function can serve to highlight the daily range (high-low or open-close) on non-standard charts
Uses base code from JayRogers

Period LevelsThis script is a cleaned up version of "Previous Period Levels". It shows only open, high, low, and close levels. There is an adjustable 'lookback' variable. It defaults to '1' to show the levels from '1' period ago. The currentOpen variable defaults to '0' which shows the current period's open level.


[CE]LevelsThis indicator is designed to show you simple Support & Resistance levels, it also has VWAP built in.

Pivot LevelsThis indicator automatically plots 3 important "Pivot Levels" to watch when day trading.
This simple but effective tool plots out important levels from the prior trading day, and updates every day. I noticed that significant levels such as the close, the high, and the low from the prior day often serve as important support/resistance levels in the future.
The previous day high is displayed as the green line, the close is displayed as the white line, and the low is plotted as the red line.
Enjoy!


Synthetic Levels indicator v.2.0“Synthetic Levels” Indicator 2.0
Class : graphic patterns
Trading type : reversal trading
Time frame : any
Purpose : detection of levels
Level of aggressiveness : standard
The “Synthetic Levels” indicator is designed to determine synthetic levels both support and resistance.
Synthetic levels are price zones where the most likely prices will change direction, but these zones are not obtained by determining chart patterns, they are the result of specific calculations.
Levels are determined based on a unique author's algorithm, which includes the most common techniques for determining levels: pivots, fractals, fibo levels, as well as extreme points approach.
By processing and comparing the values of support / resistance levels generated by different technics (see the list above), the “Synthetic Levels” indicator determines the actual price parameters of the support / resistance levels, as well as their power at a particular point in time.
The “Synthetic Levels” indicator displays three variants of support and resistance lines, which allows the trader to independently regulate the level of aggressiveness of the trading strategy, and can also can be used to build new trading strategies based on averaging and Martingale.
The information provided by the “Synthetic Levels” indicator can also be used to determine entry points (sell from resistance levels and buy from support levels), as well as to determine stop-losses and take-profits. Stops for buying are set below the support levels, and for sells - above the resistance levels. Profits for buys can be placed near the resistance lines, and for sells - in front of support lines.
The level power (displayed as a numerical value from 1 to 4 near each level line) allows to determine the trade volume of the position. The higher the power of the level is, the more aggressive the volume can be entered into the transaction. The power of a level is determined by the number of coincidences of the values of the levels calculated by different techniques. For example, if at some point the calculated values of the support level based on the “Pivots” technique turned out to be equal to the values obtained by the “Fractals” technique, the level power will be 2.
!!! IMPORTANT !!! Although the level looks like a line, that is a specific price, but in fact it is not so. The level line is rather a starting point for the formation of a price zone where prices will change the direction.
To detect trend activation points “Synthetic Levels” indicator 2.0 has double signal block: the first determines the medium-term market sentiment to the asset; the second is responsible for assessing the current market sentiment.
Structure of the indicator
Indicator consists of the following elements:
- Support lines incl. their power – 3 blue lines. Each of them displays variant of support line. The power of the level is displayed near the level line.
- Resistance lines incl. their power – 3 red lines. Each of them displays variant of resistance line. The power of the level is displayed near the level line.
- trend line – is designed for color indication of the current dominant tendency. If the color of the signal line is red, it means that the downward trend prevails, blue is for upward, and green is for flat. Accordingly, the trader should adjust his/her actions based on this information: search for sell opportunities and not buy if the line is red; search for purchases and not sell if the line is blue.
Parameters of the indicator
To configure the indicator, the following parameters are provided:
- Fibo period (default value - 34) - period for determining the Fibo lines. The higher the value is, the deeper the Indicator will dig in past prices.
- Period to calculate levels (default value - 13) - period for determining the levels used by Extreme points approach. The higher the value is, the deeper the Indicator will dig in past prices.
- Error in pips (default value - 10) – size of the price zone where levels are treated as the same ones.
- Trendline period (default value - 44) - period for determining the medium-term trend. The higher the value is, the more conservative the perception indicator of a trend will be.
- Trend period (default value - 13) - period to determine the current trend. Responsible for the level of trade aggressiveness. The lower the value of this parameter, the more signals the indicator will generate and vice versa.
- Trend error in pips (default value is 1) - this parameter is used to control the frequency of the signals. The lower it is, the more signals the indicator will generate.

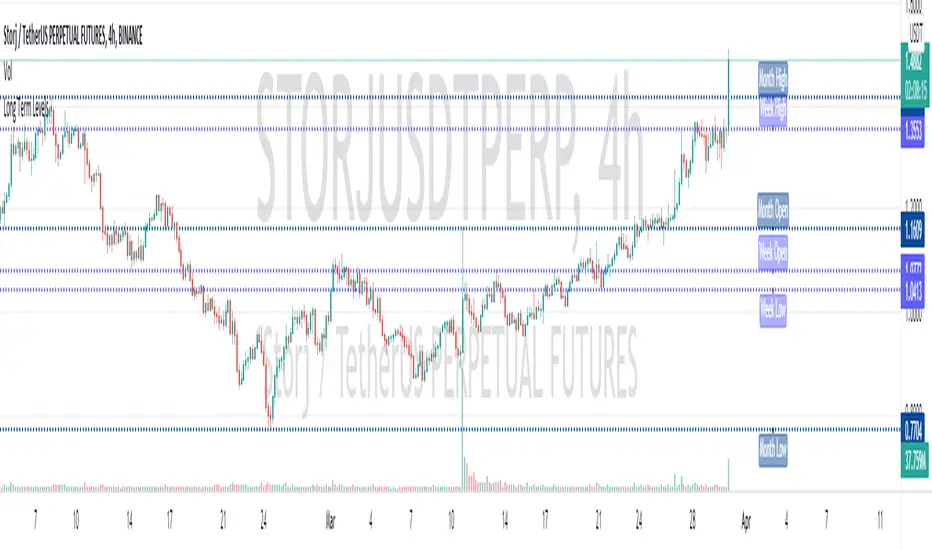
Long Term Levels (4h, D, W, M, Q, & Y)This shows and labels the highs and lows from the previous 4h, daily, weekly, monthly, quarterly and yearly session. By default it only shows weekly, monthly and yearly. It also has an option to use small labels (M vs Monthly High) to save your eyeballs. You may need to adjust your charts right hand margin to see them properly.
Everything is shown in very tasteful shades of blue. For a faster loading version of this check my other indicators.
SFL Daily ATR levelsAn indicator that plots the daily ATR upper and lower levels on a chart.
This is a TradingView re-write from Trader Dante's dATR indicator.
