شراء
BKT Atlas 004Atlas Better than the Long than Tantalus
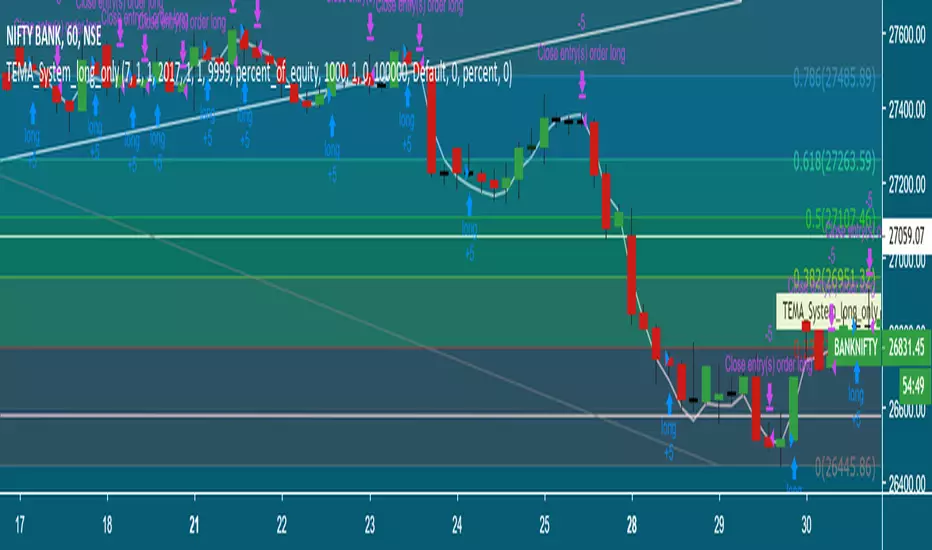
Long/Short System. 1) Control back testing period from the inputs 2) Make sure enough initial capital to make trades for the testing period 3) 100% equity to measure the performance of the trading system 4) commission 20 basis points or .2%

BKT Tantalus 003Tantalus Better in Short Markets Compared to Atlas
Long/Short System. 1) Control back testing period from the inputs 2) Make sure enough initial capital to make trades for the testing period 3) 100% equity to measure the performance of the trading system 4) commission 20 basis points or .2%
The Apoc OscillatorHere is my official Oscillator that will be going along with my indicator and trading Strategy. The final revision of my indicator and trading Strategy will be on invite only and exclusive to my discord members, however any updates to my oscillator will be public. There is so much to explain Id rather answer any questions personally, feel free to comment below and I will do my best to answer any question you may have. A picture speaks 1,000 words just put The Apoc Oscillator on your chart and see what its trying to tell you. If you like my work don't forget to hit that like button.

Bitfinex Sentiment Index [Long-Short]BSI provides two attractive graphs that breakdown the long (green area) and short (red area) positions ratio for the all Bitfinex margin cryptocurrency pairs only .
It is a quantitative measure of the bullishness or bearishness that can be used as a trading rule or in a trading system entries or exits. Included slow stochastic oscillator.

Trend Direction v1 - by @cryptomrdavis -This little script helps you to get the right trend. It use two RSI - 1. current chart 2. total market cap.
Simple to use:
Blue line cross the orange line = bullish
Orange line cross the blue line = bearish
You can trade it that way or you wait for the bullish cross and sell it, when the line cross under 70 (or higher, depends on which levels you set).
Combine it with the Crypto Trading Helper to find better long or short positions.
This script doesn't plot any lines or buy signals.
Happy trading!
Regards,
CryptoMrDavis
*** use this tool on your own risk ***
--------------------------------------------------------------------------------------------------------
BTC: 1AxLVKpgYjMtQtcRmeuFbhQNVKWKmJ5EZy
ETH: 0x7b825fa752b9926D3E8397cDb1d9E5473D074646
XLM GAXUQJSW55C7MAC4GI26NZUGIKSHFDVFRFKZCXPLMPY4HCADSDT55XK6
BCH: qz57n04ud6mn42u00aymqkku8tfh0lk4jv9c28mjvv
--------------------------------------------------------------------------------------------------------

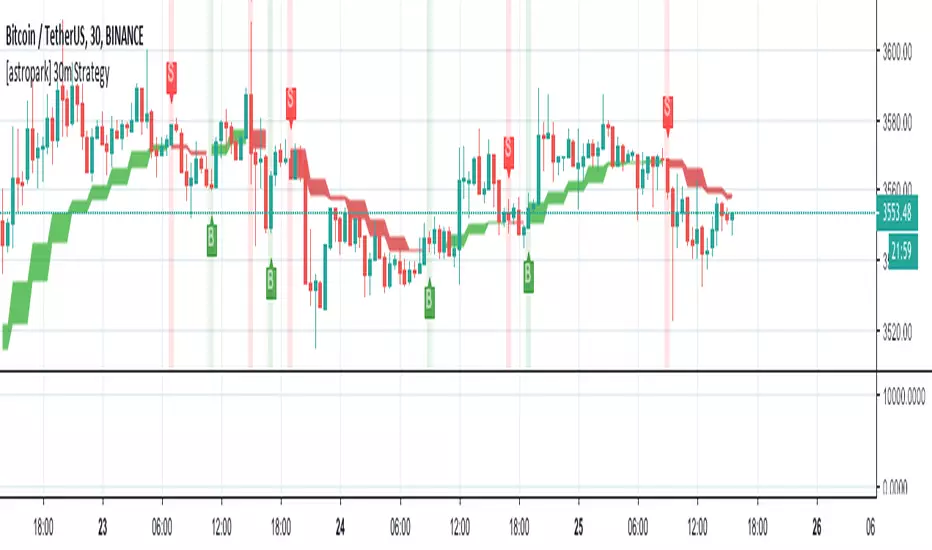
[astropark] Long-Short Strategy V2Buy/Long at next candle's open price when you see a green "B" label on the screen, considering green cloud as support for more buys/longs
Sell/short at next candle's open price when you see a red "S" label on the screen, considering red cloud as resistance for more shorts
If you appreciate my script, offer me a coffee, a beer, a pizza :)
BTC jar: 1K5kuYQPEqoNo6GRmJbHWMPmqwKM5S3oRR
ETH jar: 0x091b541a6dd6fe08c4e7bd909baafb2fce9b975e
LTC jar: LSVoAChsZrVsvbNyUfdpxtFpDAUSaUTUig
XRP jar: (XRP deposit tag) 103997763 (XRP deposit address) rEb8TK3gBgk5auZkwc6sHnwrGVJH8DuaLh
PS: Do you need a customization or do you need a dev who implements your strategy? send me a private message ;-)

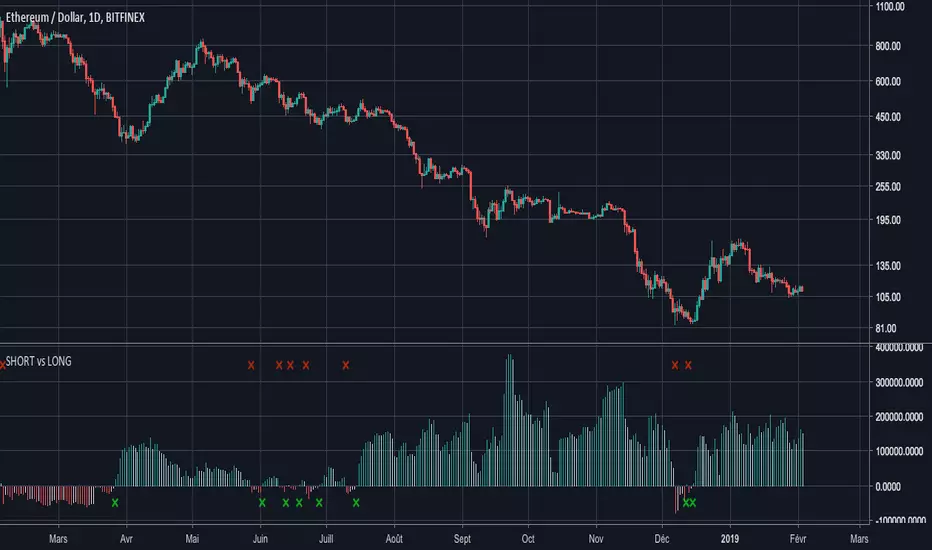
ETHUSDSHORTS - ETHUSDLONGS : balance of powerHello everyone,
I noticed that many people try to compare SHORTS and LONG positions (see:ETHUSDSHORTS and ETHUSDLONGS ), and the available indicators don't sufficiently highlight the balance of power .
That's why I programmed this indicator to answer this need ( which I also have ! ).
His ETHUSDSHORTS - ETHUSDLONGS crossover indicator e of power
I think you will understand quickly how it works, it's easy :
- If the histogram is negative, the color is red and that means that there are more BTCUSDSHORTS than ETHUSDLONGS
- If the histogram is positive, the color is green and that means that there are more ETHUSDLONGS than ETHUSDSHORTS
A small cross (red or green) appears when the power balance is reversed.
Have a good day.
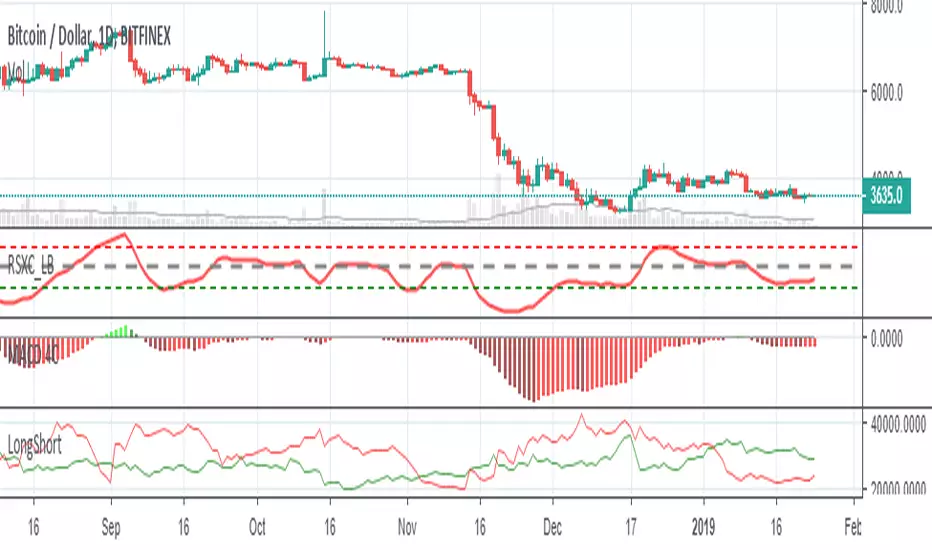
BTCUSDSHORT - BTCUSDLONG : balance of powerHello everyone,
I noticed that many people try to compare SHORTS and LONG positions (see: BTCUSDSHORTS and BTCUSDLONGS ), and the available indicators don't sufficiently highlight the balance of power .
That's why I programmed this indicator to answer this need ( which I also have ! ).
His name is : BTCUSDSHORT - BTCUSDLONG crossover indicator
I think you will understand quickly how it works, it's easy :
- If the histogram is negative, the color is red and that means that there are more BTCUSDSHORTs than BTCUSDLONG
- If the histogram is positive, the color is green and that means that there are more BTCUSDLONDS than BTCUSDSHORTS
A small cross (red or green) appears when the power balance is reversed.
Have a good day.
EDIT 03/02 : Title has been changed

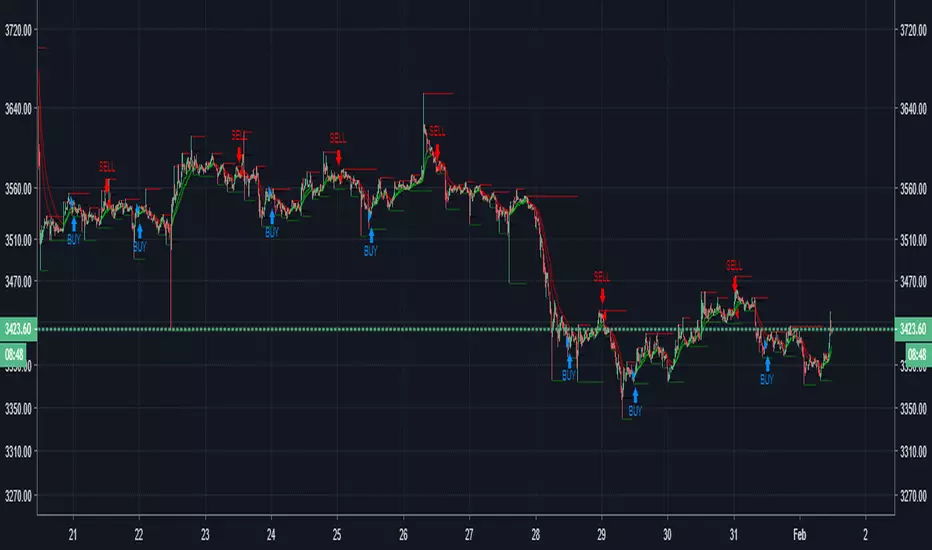


[astropark] Low TimeFrame Strategy (2H or lower)Buy/Long when you see a green "B" label on the screen "at best price you can", considering green cloud as support for more buys/longs
Sell/short when you see a red "S" label on the screen "at best price you can", considering red cloud as resistance for more shorts
BTC jar: 1K5kuYQPEqoNo6GRmJbHWMPmqwKM5S3oRR
ETH jar: 0x091b541a6dd6fe08c4e7bd909baafb2fce9b975e
LTC jar: LSVoAChsZrVsvbNyUfdpxtFpDAUSaUTUig
XRP jar: (XRP deposit tag) 103997763 (XRP deposit address) rEb8TK3gBgk5auZkwc6sHnwrGVJH8DuaLh
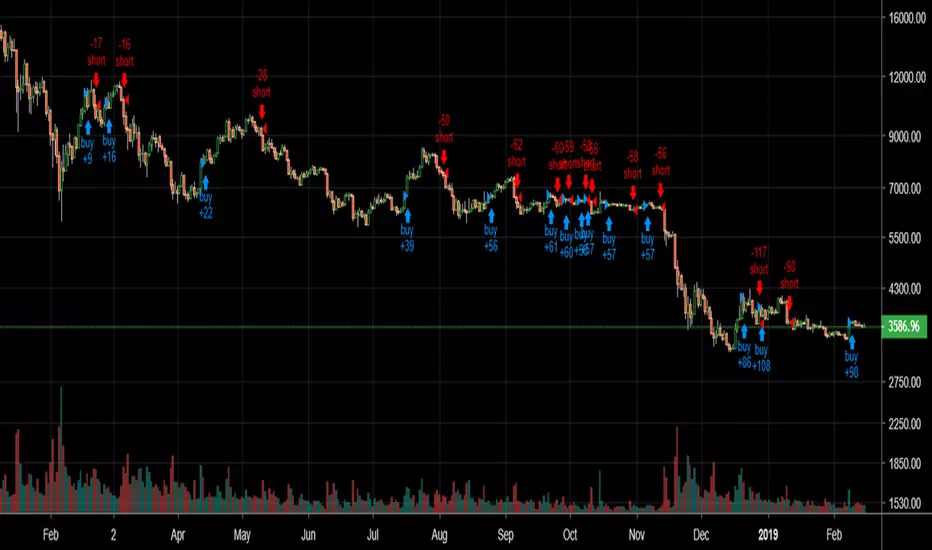
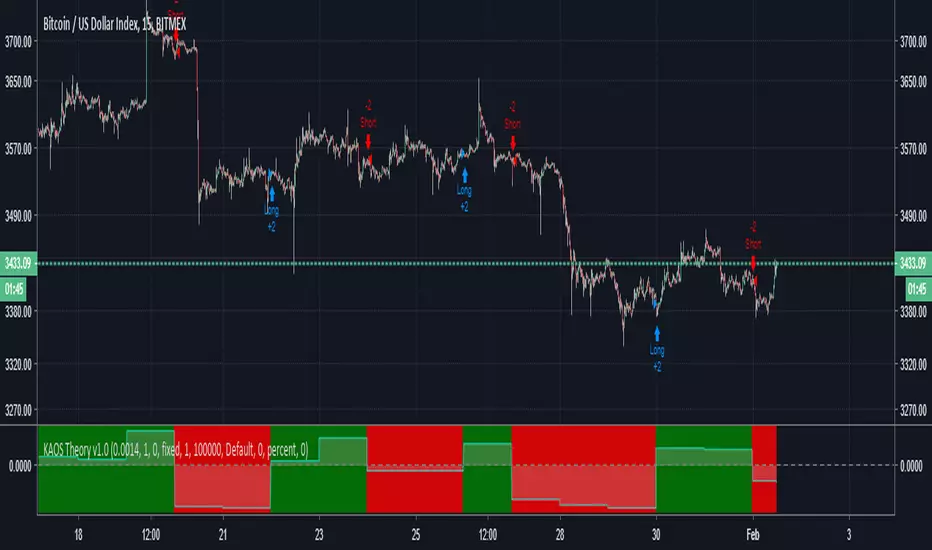
Speed_long_short-v2[WOZDUX]Indicator longs and shorts version 2.
------
Индикатор лонги и шорты версия 2.

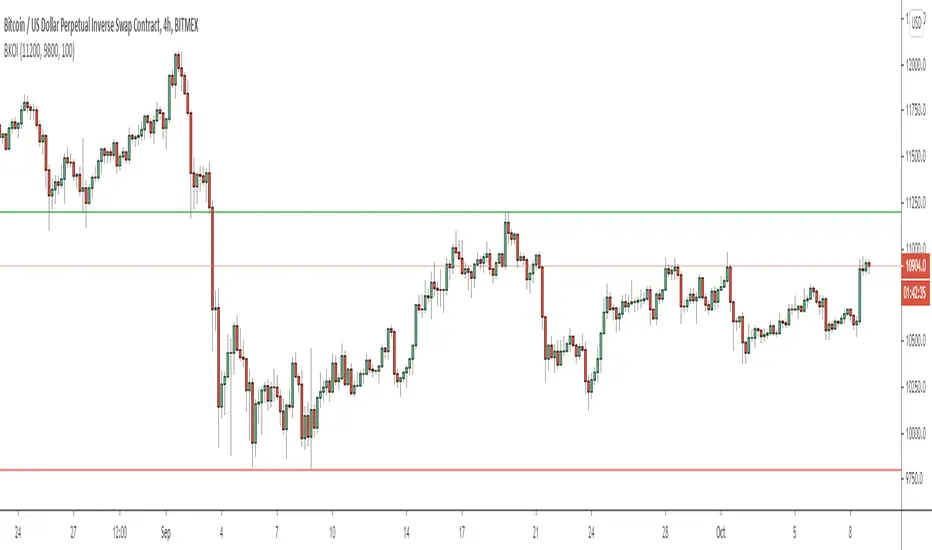
Breakout IndicatorThis script allows you to set breakout alerts.
An alert will be triggered only when price breaks and closes beyond the specified prices. You will get an alert on the first candle that closes beyond the levels you set.

[AN] HAStudy that signals buy and sell zones based on HeikinAshi chart.
Also includes exit signals.
Strategy that tests the signals is available here:

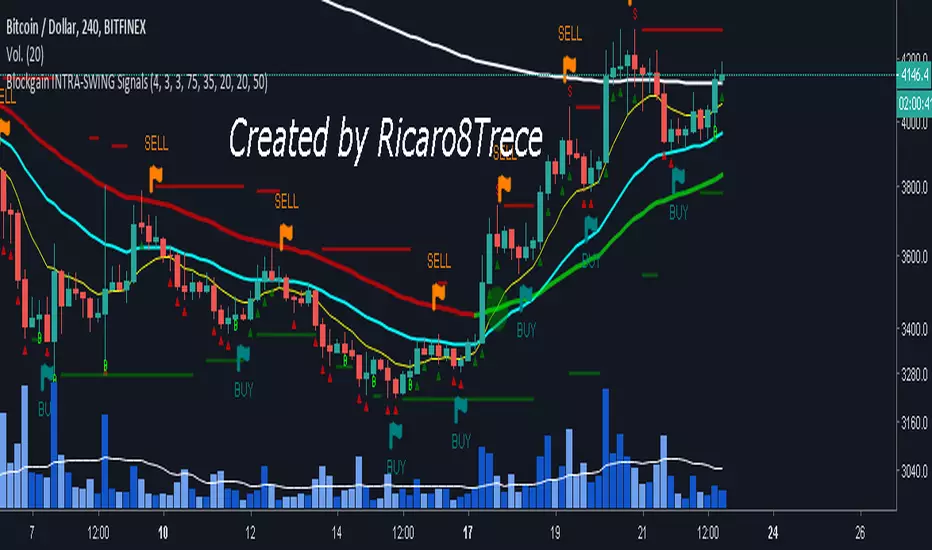
Blockgain INTRA-SWING SignalsRules 1h to 4h for Crypto:
- This script should be used as confirmation of an entry that the trader is preparing, since the signal can move 2 or 3 candles because it is calculating the chances of a rally in that area.
- The S and B are Stoch crosses in overbought and oversold
- The green and red triangles indicate new maximums and new minima of 4 candles back
- EMAS 10, 26, 50 refer to Ichimoku
Tenkan-sen (9) (10), Kijun-sen (26), Senkou Span B (52) (50)
- Supports and resistances calculated at 20 candles

[Long/Short] Range Filter-ADXIt's a useful script for pairs where you can operate long and short.
It's a combination algorithm of the Range filter and the ADX.
The ADX helps to make the decision to enter to open long or short position.
LG --> Long
xL --> Close Long position
ST --> Short
xS --> close Short Position
Enjoy!!!

Study INTRA-SWINGContent
- ema of 50 changes color if the price is above or below it
-ema of 10 yellow
-ema of 200 white
- Green triangles under the candles indicate new maxima compared to the previous 4 candles
-Red triangles indicate new minima with respect to the previous 4 candles
-the green and orange arrows of high altitude indicate Longs and Shorts for Intradia or Swing (recommended in temporalities from 1h to 4h), for more temporality should change the period for a greater one
-Alarms for:
- Green and red triangles like Break Out, Break Down
-Long ARROW green arrow
-Orange arrow SHORT ARROW
// NOTE: this Script is in Beta mode and next updates will be made