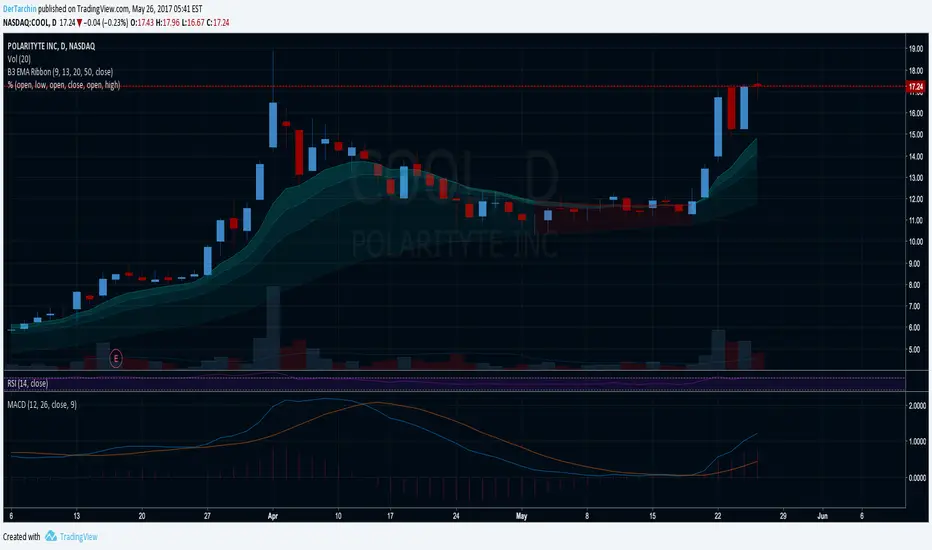
This is an updated version of my previous stop loss script. I've added a double EMA line and modified the stop as below; In an uptrend.... 1. a yellow dot will appear once it's time to move your stop. The yellow dot will display at the level of the stop loss. Place your stop 1 pip below the dot. 2. The yellow dot will only appear if a new higher low has formed...
This simple script checks for data gaps in an intra-day TradingView chart. I have found that BitMEX 1-minute data is coming in rather holey lately, so I wrote this just to see how prevalent the problem is. It should work on any intra-day timeframe, not just 1-minute. V1: initial release.
Binque's Stop Loss Indicator is a great way to visualize a trailing stop loss based on a percent from the high. i.e. If the high was $10 of a trading day and your stop loss was set at 5% (percent) then your chart would show a small dot 5% below the high of the day. This is a great way to quickly see a trailing stock idea. Change the color to match your back...
This script is designed to aid in back-testing and trade execution. It displays three sets of values - the teal colored value is the current ATR, the green colored value is your stop loss distance (in pips) below the most recent swing low for long trades , and the red colored value is your stop loss distance (in pips) above the most recent swing high for short...
This indicator allows you to quickly view the true % change per candlestick (prev close > current close), but it also has 3 other customizable values for you to set your own % change conditions (such as open > high). Feel free to edit the script to suit your own needs as well.
A very simple yet, very useful and lovely oscillator, most of the time, when we have a position in a trend and we want to take a look at percentage of our gain or loss, we need to use the "Price Range" tool time and time again, this, in some trades that you would buy and sell in less than an hour, can become a problem, also, if you have few different things going...