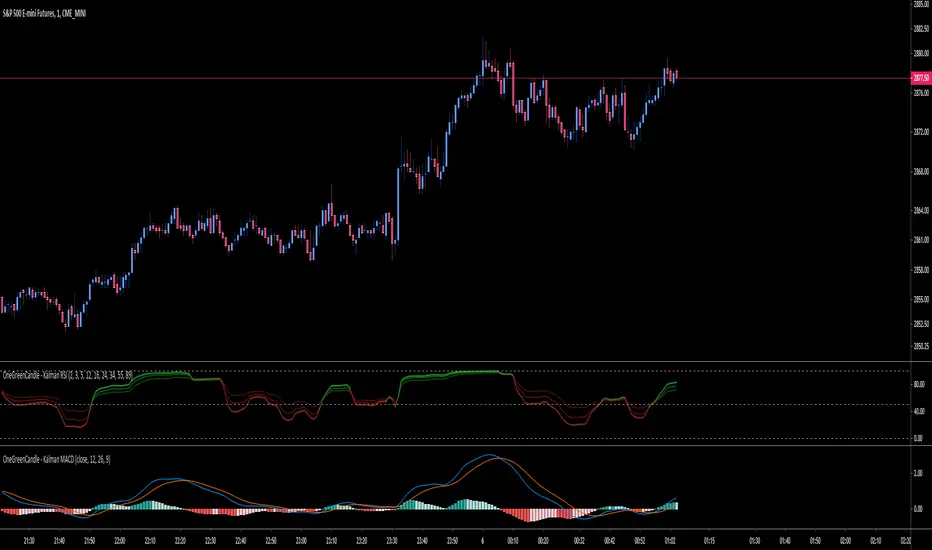
{INDYAN} RSI + MACDModded RSI and MACD for intraday use. If rsi above 60 and macd is above zero line then go for buy and if rsi is below 40 and macd below zero line then go for sell side. use it in small timeframe i.e. 3 minute or less.
better for scalp trading
Happy Trading
Love INDYAN
#It can be used best with INDYAN Go With Trend
Macd-v

MACD Bull Crossover and RSI Oversold 5 Candles Ago-Long StrategyHello everyone, I've been having a great time perfecting this strategy for a few weeks now. I finally feel like it's time to release it to the public and share what I have been working on.
This strategy only enters a long trade when the MACD crosses over the signal line and the RSI was oversold looking back 5 candles ago. The logic behind this is to wait for RSI to enter the oversold territory, and then when the market starts to recovery the MACD will crossover telling us the sell off is over.
This strategy will close once these 2 conditions are met.
1. MACD Histogram is above 0 and MACD crosses under the signal line.
2. RSI was overbought 5 previous candles ago.
In the strategies settings, you'll be able to enable visual stop-loss and profit levels and change those levels to what you like, enable up to 5 EMA'S,
ADDONS That Affect Strategy:
* Enable visual stop-loss and profit levels as soon as a buy signal is triggered.
* Modify stop-loss and profit levels.
* Modify RSI oversold and RSI overbought levels.
* Modify MACD Fast and Slow moving average.
ADDONS That Do Not Affect Strategy:
* Enable up to 5 EMA's. (This will not affect strategy, and is the only purpose is for people who like following EMA's.)
Thank you for taking the time to try my strategy. I hope you have the best success. I will be making a short strategy, and alerts for this strategy soon. Follow me for updates!

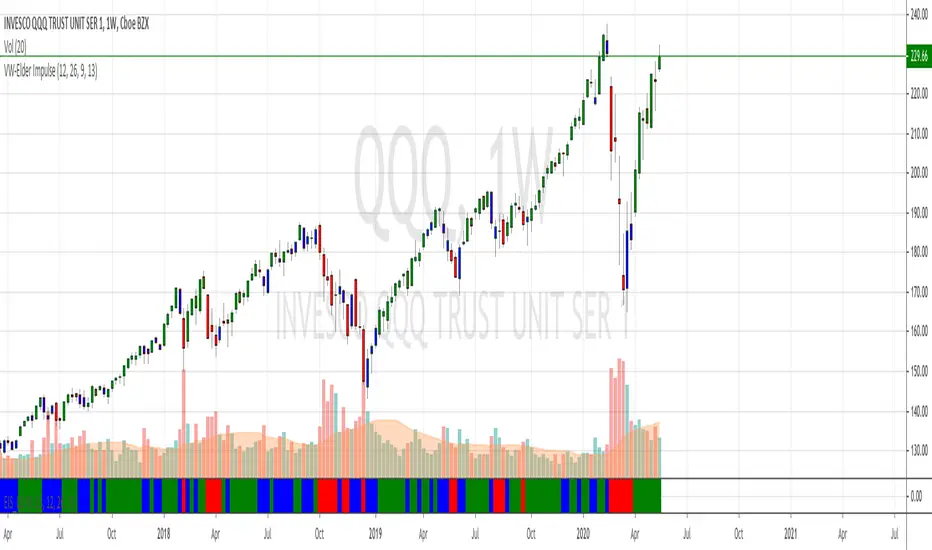
Volume-Weighted Elder Impulse SystemThis is a volume-weighted version of the Elder Impulse System. The Elder Impulse System utilizes the MACD along with EMA13(in general) to find the optimal entry and exit points. In this version, the MACD and EMA have both been changed into a Volume-weighted version. With volume involved, the indicator is, in general, faster than the original Elder Impulse system, in showing entry and exit points.
DMA: Moving Average of OscillatorTechnical Indicator Moving Average of Oscillator (Moving Average of Oscillator OsMA) is the difference between the oscillator and oscillator smoothing. In this case, an oscillator is used the basic MACD line and the smoothing of the signal.
Calculate:
OSMA = MACD - SIGNAL
MACD = EMA(CLOSE, 12) - EMA(CLOSE, 26)
SIGNAL = EMA(MACD, 9)

DiNapoli MACD MTFSimple oscillator, based on formula from Joe Dinapoli for MACD oscillator. Simply it's analysing current timeframe (bottom row) and 2 higher timeframes.


Combing in MACD and MTFHi all, I'm trying to wedge in the MACD into a multiple timeframe. Scope is to create:
1) an alert when the MACD across all timeframes is positive,
2) an alert when the MACD across all timeframes is negative, and
3) one when neither of them is applicable.
Would anyone be so kind to give it some thoughts, please?
//@version=2
strategy(" Easy MTF Strategy", overlay=false)
TF_1_time = input("3", "Timeframe 1")
TF_2_time = input("5", "Timeframe 2")
TF_3_time = input("15", "Timeframe 3")
TF_4_time = input("30", "Timeframe 4")
fastLen = input(title="Fast Length", type=integer, defval=12)
slowLen = input(title="Slow Length", type=integer, defval=26)
sigLen = input(title="Signal Length", type=integer, defval=9)
= macd(close, fastLen, slowLen, sigLen)
width = 5
upcolor = green
downcolor = red
neutralcolor = blue
linestyle = line
TF_1 = security(tickerid, TF_1_time, open) < security(tickerid, TF_1_time, close) ? true:false
TF_1_color = TF_1 ? upcolor:downcolor
TF_2 = security(tickerid, TF_2_time, open) < security(tickerid, TF_2_time, close) ? true:false
TF_2_color = TF_2 ? upcolor:downcolor
TF_3 = security(tickerid, TF_3_time, open) < security(tickerid, TF_3_time, close) ? true:false
TF_3_color = TF_3 ? upcolor:downcolor
TF_4 = security(tickerid, TF_4_time, open) < security(tickerid, TF_4_time, close) ? true:false
TF_4_color = TF_4 ? upcolor:downcolor
TF_global = TF_1 and TF_2 and TF_3 and TF_4
TF_global_bear = TF_1 == false and TF_2 == false and TF_3 == false and TF_4 == false
TF_global_color = TF_global ? green : TF_global_bear ? red : white
TF_trigger_width = TF_global ? 6 : width
plot(1, style=linestyle, linewidth=width, color=TF_1_color)
plot(5, style=linestyle, linewidth=width, color=TF_2_color)
plot(10, style=linestyle, linewidth=width, color=TF_3_color)
plot(15, style=linestyle, linewidth=width, color=TF_4_color)
plot(25, style=linestyle, linewidth=4, color=TF_global_color)
exitCondition_Long = TF_global_bear
exitCondition_Short = TF_global
longCondition = TF_global
if (longCondition)
strategy.entry("MTF_Long", strategy.long)
shortCondition = TF_global_bear
if (shortCondition)
strategy.entry("MTF_Short", strategy.short)
strategy.close("MTF_Long", when=exitCondition_Long)
strategy.close("MTF_Short", when=exitCondition_Short)

Basic BIASBasic BIAS
Deviation rate (bias), also known as deviation rate, or y-value for short, is an indicator to reflect the deviation degree between the price and MA in a certain period of time by calculating the percentage difference between the market index or closing price and a moving average, so as to obtain the possibility that the price will reverse or rebound due to deviation from moving average trend in case of severe fluctuation, and that the price will move within the normal fluctuation range Form the credibility of continuing the original potential.
The deviation rate is a percentage of the deviation degree (gap rate) between the price and ma.
The departure rate curve (bias) is a curve that connects the values of each bias into a line and obtains a wave extension curve with the value of 0 as the horizontal axis.
Jackrabbit.modulus.MACDThis is the MACD indicator for the Jackrabbit suite and modulus framework.
This indicator supports differential timeframe analysis and confirmational bias. Timeframes supported:
1 Second, 5 Seconds, 15 Seconds, 30 Seconds, 1 Minute, 5 Minutes, 15 Minutes, 30 Minutes, 45 Minutes, 1 Hour, 2 Hours, 3 Hours, 4 Hours, 6 Hours, 8 Hours, 12 Hours, and 1 Day
The main indicatior and the confirmational indicator can both be individually tuned for the fast, slow, and delta lines with different and independent lengths and 24 different moving average types:
SMA, Double SMA, Triple SMA,
EMA, Double EMA, Triple EMA,
WMA, Double WMA, Triple WMA,
VWMA, Double VWMA, Triple VWMA,
Hull, Double Hull, Triple Hull,
ZLEMA, Double ZLEMA, Triple ZLEMA,
SSMA, Double SSMA, Triple SSMA,
SMMA,Double SMMA, Triple SMMA
Both MACDs can also have their own source input: Open, Close, High, Low, HL2, HLC3, and OHLC4
The Jackrabbit modulus framework is a plug in play paradigm built to operate through TradingView's indicator on indicatior (IoI) functionality. As such, this script receives a signal line from the previous script in the IoI chain, and evaluates the buy/sell signals appropriate to the current analysis. The results are either combined with the signal line, or used as confirmation to the signal line. A new signal line is generated for the next script in the link.
Buy/Sell alerts are produced by the main Jackrabbit script, or the modulus AlertSystem script. This script is not designed or meant to function outside my framework and contains no alert capabilities.
By default, the signal line is visible and the charts are turned off. Signal line visibility is controlled by the Style tab, and the charts display is controlled by the indicator settings tab.
This script is by invitation only. To learn more about accessing this script, please see my signature or send me a PM. Thank you.

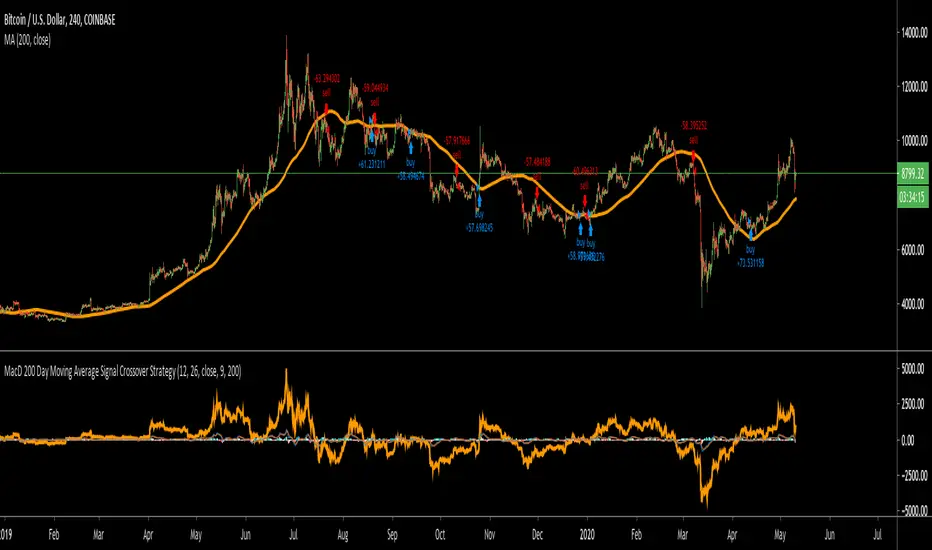
MacD 200 Day Moving Average Signal Crossover StrategyThis works on most time frames, but I noticed the 4 hour for BTCUSD on coinbase seems to work well as an example. The strategy is pretty simple. I was inspired by a youtube video that said to backtest their strategy so I did. Most of the time it doesn't work but sometimes it's pretty good as in the case I showed.
Basically, you buy if the MacD crossers over the signal line and the histogram is below 0 and you are above the 200 day moving average. Do the opposite to sell!
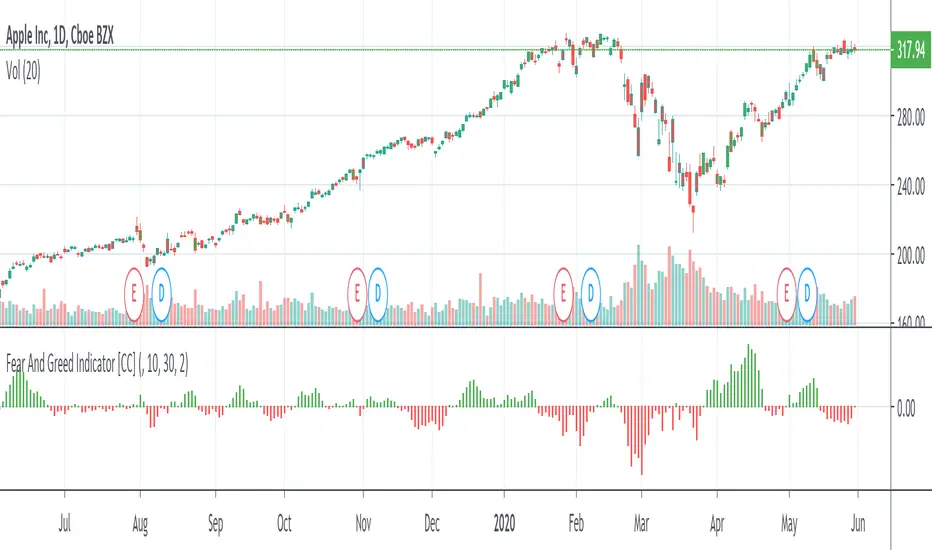
Fear And Greed IndicatorThe Fear And Greed Indicator is a very popular indicator on the Bloomberg platform and since I didn't have actual source code to work with, this is a very close approximation of that indicator. Let me know if you spot any discrepancies with the original and I will do my best to fix them.
For buy and sell signals it is pretty straightforward. Just buy when the green (greed) is in control and sell when the fear (red) is in control
This was a special request so let me know if you want to see more scripts from me or if you want something custom!
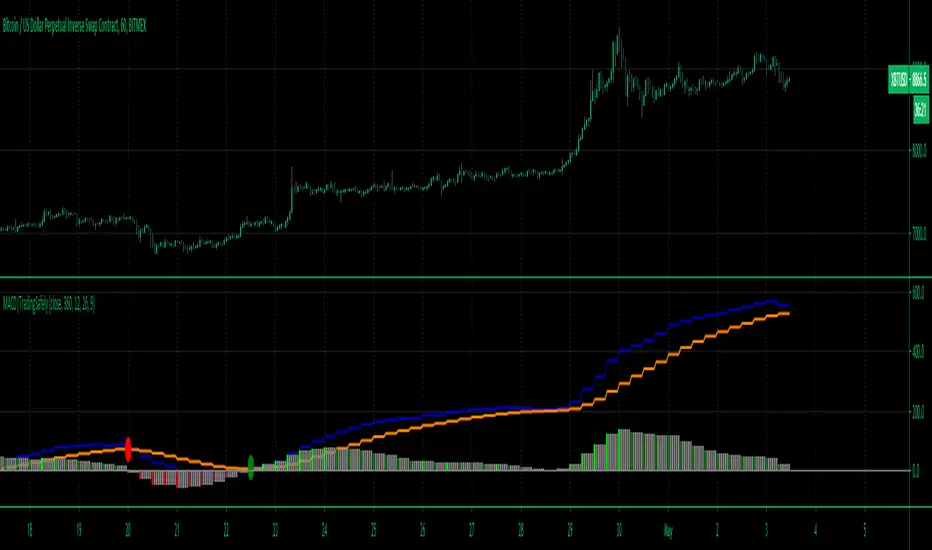
Trading Safely Multiple Time Frame Dynamic MACDOur Multi-Time frame MACD is a Zero-Lag (well near zero-lag) We make this claim because MACD utilizes Moving Averages and as you know moving averages are lagging indicators.
For our MACD we utilize The McGinley Dynamic which looks like a moving average line yet it is a smoothing mechanism for prices that turns out to track far better than any moving average.
The McGinley Dynamic minimizes price separation, price whipsaws and hugs prices much more closely.
The McGinley Dynamic does this automatically as this is a factor of the formula.
Because of the calculation, the Dynamic Line speeds up in down markets as it follows prices yet moves more slowly in up markets.
As traders we want to be quick to sell in a down market, yet ride an up market as long as possible.
How to Trade.
It best to use lower time frame charts and higher time frame MACD settings such as 1H chart and 6H (360min) MACD time frame
You can input any time frame in minutes from 1 min to 1440 minutes on the MACD settings.
1H = 60
2H = 120
3H = 180
4H = 240
6H = 360
12H = 720
24H = 1440
Week = W
Month = M
You can set alerts for bullish and bearish crossovers which are good indications of a potential entry into a long or short trade.
shout out to lonesometheblue for inspiration.
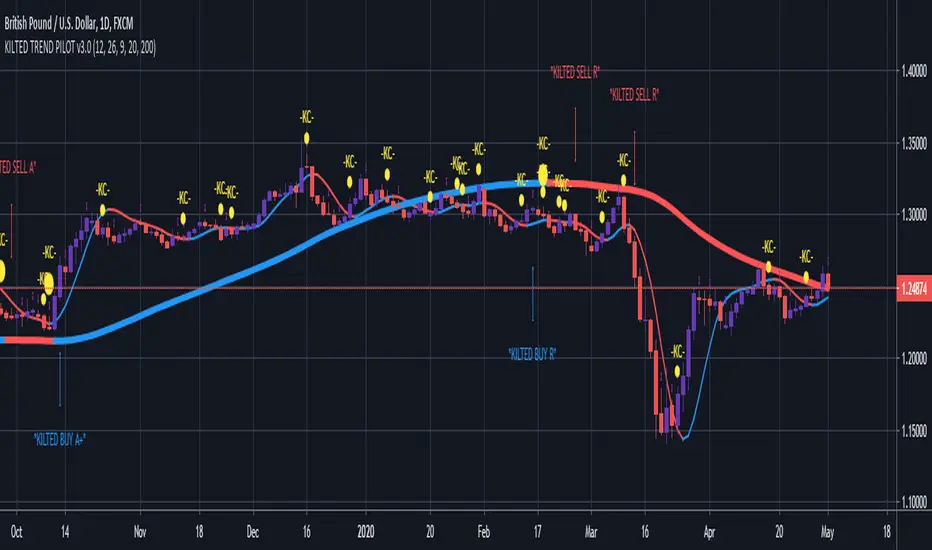
KILTED TREND PILOTDescription: Uses the Hull Moving Average ( HMA ) and MACD to observe the following strategy, to assist with trade setups and provide confluence. It is especially effective when used with the Kilted Strength Meter to make sure there is an active trend and the market is not moving sideways.
SETTINGS AND EXPLANATION
1. The strategy is a very simple and visual one where you go:
• Long when the short HMA colour matches the long HMA colour (which is when the 2 colours are blue for a long position).
• Short when the short HMA colour matches the long HMA colour (which is when the 2 colours are red for a short position)
2. Ideally you want to enter a trade when the market is trending and not moving sideways, hence the reason the Kilted Strength Meter makes a great companion to complement this strategy
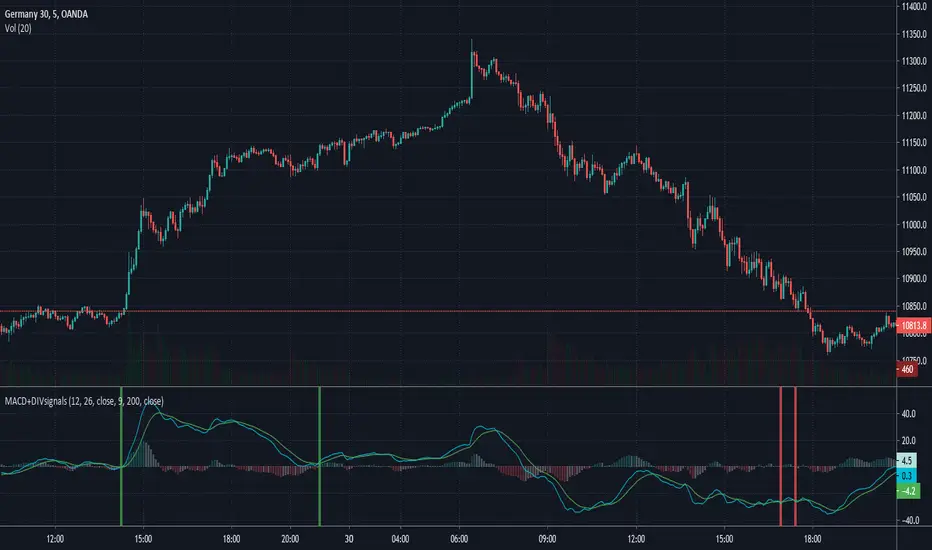
MACD with divergence signalsIts an MACD indicator which highlights places where macd and signal line cross and hidden divergence ocures.
Logic behind it is to check if we have hidden divergence when crossing of that two lines and if above EMA200 (signal for BUY - green) or if below EMA200 (signal for SELL - red).
You can change lenght of EMA but i think 200 is a simpliest trend indicator.

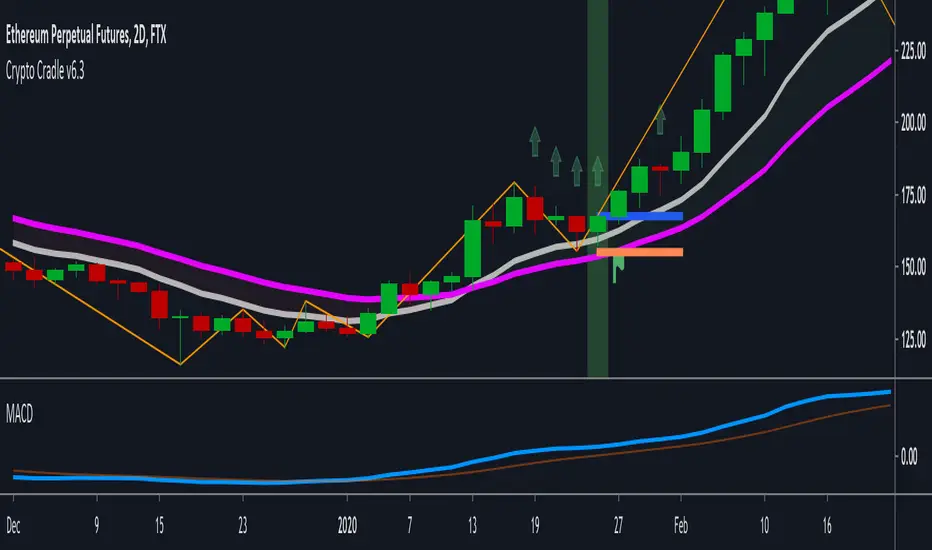
Crypto Cradle v6A long signal (green bar background) is flagged if a small bullish candle is in/around the EMA10/20 cradle.
A short signal (red bar background) is flagged if a small bearish candle is in/around the EMA10/20 cradle.
Other factors must be present such as MACD convergence and higher timeframe trend.
The blue bar is the entry. The red bar is the stop.
The strategy is designed to discretionally trade trending cryptocurrency assets.
SETTINGS:
Experiment with the zig-zag trend sensitivity (3-4 works best) to match entry timeframe trend detection.
* 'Zig Zag - Must require pullback trend' - sometimes a small bullish / bearish candle can appear in the cradle zone without a clear pullback (ie price has travelled sideways into the EMAs). Switch this on in an attempt to exclude such pull-backs.
* 'Zig Zag - Require extra trend zig' - trend is determined by a H, L, HH, HL forming (for long). Tis setting requests one more trend-aligned zig/zag (ie L, H, HL, HH, HL).
* 'Zig Zag - Show Higher Time Period Trend' - the trend sensitivity is doubled to estimate higher timeframe trend. This visualises what the algorithm has determined as the higher timeframe zig-zag pivot points .
* 'Minimum candles since outer pivot' - this attempts to exclude signals that occur after a dramatic pull-back.
* 'Entry Candle Offset Max' - how many bars to wait for entry
PROFIT TAKING:
There are many ways to take profit after entry - trailing stops, scaling out 50% at 1:1, fixed targets, fib extensions, etc. This is out of scope for this indicator.
I have included a basic 1:1 level line (dull green when enabled) and a fixed target level line ( bright green when enabled) that uses a risk/reward multiplier.
ALERT:
To create a generic alert, click the + button in the Alerts panel, select 'Crypto Cradle v6' from the first list, select 'Cradle v6 Short/Long Alert' from the second list, and select 'Once Per Bar Close'. Don't forget to add the timeframe to the message.
This indicator supersedes the open-sourced '"Crypto Cradle" trigger' / 'Crypto Cradle v2' indicator seen here:
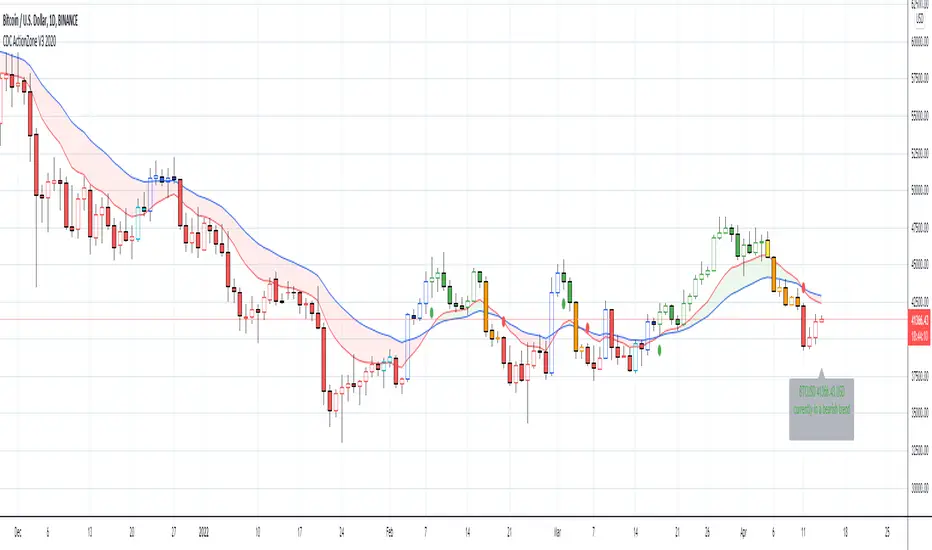
CDC ActionZone V3 2020## CDC ActionZone V3 2020 ##
This is an update to my earlier script, CDC ActionZone V2
The two scripts works slightly differently with V3 reacting slightly faster.
The main update is focused around conforming the standard to Pine Script V4.
## How it works ##
ActionZone is a very simple system, utilizing just two exponential moving
averages. The 'Zones' in which different 'actions' should be taken is
highlighted with different colors on the chart. Calculations for the zones
are based on the relative position of price to the two EMA lines and the
relationship between the two EMAs
CDCActionZone is your barebones basic, tried and true, trend following system
that is very simple to follow and has also proven to be relatively safe.
## How to use ##
The basic method for using ActionZone is to follow the green/red color.
Buy when bar closes in green.
Sell when bar closes in red.
There is a small label to help with reading the buy and sell signal.
Using it this way is safe but slow and is expected to have around 35-40%
accuracy, while yielding around 2-3 profit factors. The system works best
on larger time frames.
The more advanced method uses the zones to switch between different
trading system and biases, or in conjunction with other indicators.
example 1:
Buy when blue and Bullish Divergence between price and RSI is visible,
if not Buy on Green and vise-versa
example 2:
Set up a long-biased grid and trade long only when actionzone is in
green, yellow or orange.
change the bias to short when actionzone turns to te bearish side
(red, blue, aqua)
(Look at colors on a larger time frame)
## Note ##
The price field is set to close by default. change to either HL2 or OHLC4
when using the system in intraday timeframes or on market that does not close
(ie. Cryptocurrencies)
## Note2 ##
The fixed timeframe mode is for looking at the current signal on a larger time frame
ie. When looking at charts on 1h you can turn on fixed time frame on 1D to see the
current 'zone' on the daily chart plotted on to the hourly chart.
This is useful if you wanted to use the system's 'Zones' in conjunction with other
types of signals like Stochastic RSI, for example.
MACD crossover while RSI Oversold/OverboughtThis indicator draws signals on the chart when a Bullish MACD Crossover occurs at the same time RSI is "oversold", and also when Bearish MACD Crossover occurs at the same time RSI is "overbought"
Indicators are drawn on the chart in the following scenarios:
1. Bullish signal
a. MACD bullish crossover occurs on a single bar
b. RSI was below the Oversold threshold (29 by default) within the prior 5 bars
2. Bearish signal
a. MACD bearish crossover occurs on a singnle bar
b. RSI was above the Overbought threshold (71 by default) within the prior 5 bars

AverageTrueRangeConvergenceDivergenceV1sloth288Simple indicator with the thought of merging MACD and ATR. The idea has come from trying to find a way to define sideways markets. Whipped this up quickly to explore the idea.
Feel free to throw in suggestions or even mention other open source indicators that define sideways markets well.
Simple instructions
If histogram green, breakouts/trade zone.
If histogram red, sideways/keep out.

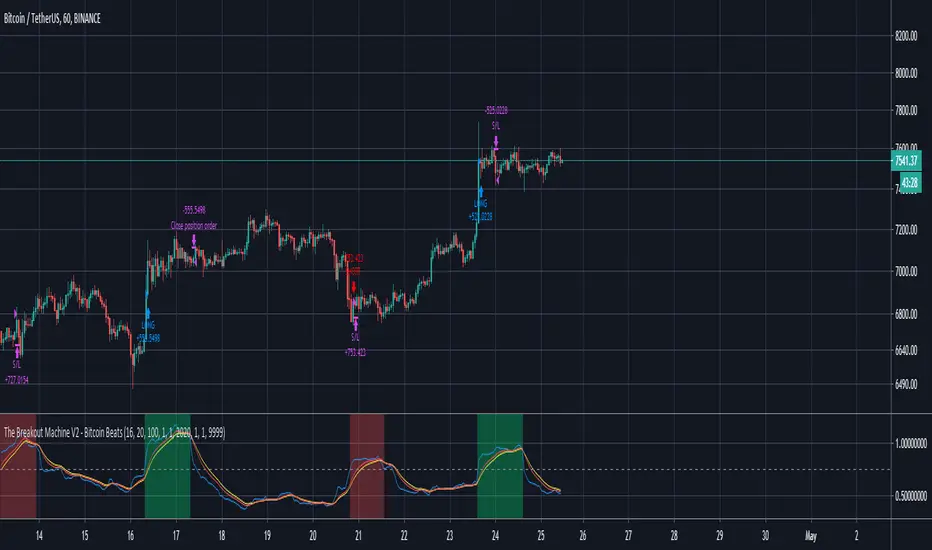
The Breakout Machine V2 BTCUSDT - Bitcoin BeatsHello, Hello, Hello and welcome back to Bitcoin Beats.
As the title suggests, this is Version 2 of The Breakout Machine. Unlike the previous version, this one has been fine-tuned to work best on Binance Futures(BTCUSDT).
The stats shown below are from 2020.
PLEASE BE CAREFUL WITH YOUR LEVERAGE AND DON'T GET REKT.
Trade at your own risk! Good luck!
This strategy takes MACD and Volume spikes to calculate pumps and dumps in the bitcoin market.
I've also added custom backtesting inputs and leverage for you all to experiment with and see the profitability of the Strategy.
Alerts version coming soon...
Thank you, And goodbye, from Bitcoin Beats.
Ichimoku Cloud & ADX & MACD with TSL [tg1]Hi There! Used the time at home during the corona to learn Pinescript and work on this strategy. Its finetuned for BTCUSDT on mid-high timeframe, can be used for other TF/markets, but be extra careful).
The strategy is mainly build around Ichimoku Kinko Hyo and its Tenkan and Kijun crosses. It aims to only buy/sell when there is a strong trend in any direction (using MAs, ADX and ATR) and enters a trade based on these conditions:
1) Tenkan > Kijun
2) Close > Kumo
3) MACD > Signal
4) ADX > Custom value
The same applies for shorts, just the other way around.
I added a TSL based on either % or ATR fixed % for improved risk management. Let me know if any questions.

Open Close Profit - [Alerts]This script comes with the following indicators and features:
Moving Average trend filter (Hull, ZLEMA, McGinley)
Pin Bar Filter
MACD indicator
Pump and Dump filter
Entry, Take Profit, and Stop Loss Alerts
And a few more indicators in the back-end to increase accuracy, optimize entries and filter out sideways PA
This script works really well as a scalper on lower Time Frames as well as on higher Time Frames. Besides that you can also use it on pretty much any coin or asset.
This script is not repainting. We advise to use alerts on “Once Per Bar Close”.
If you’d like to automate this script you can do that by using AutoView, ProfitView, ProfitTrailer, CryptoHopper etc.
Leave a message if you’d like to try it out.
