RSI + MFIRSI and MFI combined, width gradient fields if OS or OB, shows divergences separate for wicks and bodies, shows dots when mfi and rsi oversold at the same time. مؤشر Pine Script®من wilinskilukasz70
AI Money FlowAI Money Flow is a revolutionary trading indicator that combines cutting-edge artificial intelligence technologies with traditional Smart Money concepts. This indicator provides comprehensive market analysis with emphasis on signal accuracy and reliability. Key Features: Volume Profile with Smart Money Analysis - Displays real money flow instead of just volume, identifying key support and resistance levels based on actual trader activity. Volatility-Based Support & Resistance - Intelligent support and resistance levels that dynamically adapt to market volatility in real-time for maximum accuracy. Order Flow Analysis - Advanced detection of buying and selling pressure that reveals the true intentions of large market players. Machine Learning Optimization - Futuristic AI technology that automatically learns and optimizes settings for each specific asset and timeframe. Risk Management - Advanced volatility and price spike detection for better risk management and capital protection. Real-time Dashboard - Modern dashboard with color-coded signals provides instant overview of market conditions and trends. Accuracy: 88-93%مؤشر Pine Script®من kameniczkifx5552
Aggregated Open Interest Multi-Exchange (USD)This indicator aggregates Open Interest (OI) data from multiple major cryptocurrency exchanges into a single unified view in USD, using data available on TradingView. It automatically adapts to the asset you're viewing on the chart. Features: Aggregates OI from 7 major exchanges: Binance, Bybit, OKX, Bitget, Deribit, HTX, and Coinbase All values converted to USD - unlike native OI which shows contracts/coins Uses only data available on TradingView platform Automatically detects the asset from your chart (BTC, ETH, SOL, etc.) True apples-to-apples comparison across exchanges Displays as candlesticks showing OI open, high, low, and close Toggle exchanges on/off individually Handles different contract types per exchange automatically Why USD conversion matters: Traditional OI indicators show values in contracts or crypto units, making it difficult to compare across exchanges. This indicator converts everything to USD, giving you the real dollar value of open positions across all exchanges. How it works: Simply add the indicator to any crypto perpetual futures chart. It will automatically fetch and aggregate OI data from all supported exchanges for that asset using TradingView's built-in data feeds, converting everything to USD. Supported Exchanges: Binance, Bybit, Bitget, HTX: USDT perpetuals Deribit: BTC/ETH use USD contracts, others use USDC OKX: Contract-based (automatically converted) Coinbase: USDC perpetuals Perfect for traders who want a comprehensive view of total market Open Interest in USD across exchanges using reliable TradingView data. مؤشر Pine Script®من carlosbucciتم تحديثه 22105
- Standardized Money Flow Index with Multi-MA and BB OverlayThis custom Money Flow Index (MFI) script enhances the standard MFI by introducing multiple layers of configurability, statistical normalization, and visual clarity. It begins with the traditional MFI calculation using the average price, hlc3, and a user-defined length, then offers the option to standardize the output. Standardization transforms the MFI into a z-score by subtracting a rolling mean and dividing by a rolling standard deviation, making the indicator statistically interpretable across different assets, timeframes, and volatility regimes. When standardization is active, the overbought and oversold thresholds shift from the conventional 80 and 20 to +2 and –2, aligning them with standard deviation boundaries and improving signal clarity in volatile environments. Beyond standardization, the script introduces a robust smoothing engine. Users can choose from several moving average types, including SMA, EMA, SMMA (RMA), WMA, and VWMA, to reduce noise and highlight trend shifts. A particularly advanced option is the “SMA + Bollinger Bands” mode, which overlays volatility envelopes around the smoothed MFI using a user-defined standard deviation multiplier. This feature helps traders identify when the MFI is unusually high or low relative to its recent behaviour, adding a volatility-adjusted layer of insight, especially useful in momentum or mean-reversion setups. Visually, the script is designed for clarity, modularity, and flexibility. It plots the raw or standardized MFI in purple, overlays the smoothed version in yellow if enabled, and adds green Bollinger Bands when selected. It also includes horizontal reference lines for overbought, oversold, and midpoint levels, which dynamically adjust based on whether standardization is active. A shaded background between the overbought and oversold lines further enhances readability, helping traders quickly assess momentum extremes and potential inflection zones. Compared to the standard MFI, which offers a fixed calculation, limited visual feedback, and no statistical context, this enhanced version is modular, customizable, and statistically grounded. It allows traders to tailor the indicator to their strategy, whether they prefer raw signals, smoothed trends, or volatility-adjusted extremes. These enhancements make it a powerful building block for more sophisticated signal engines, especially when combined with filter gating, persistent state logic, or multi-indicator overlays. مؤشر Pine Script®من chriskokal1تم تحديثه 24
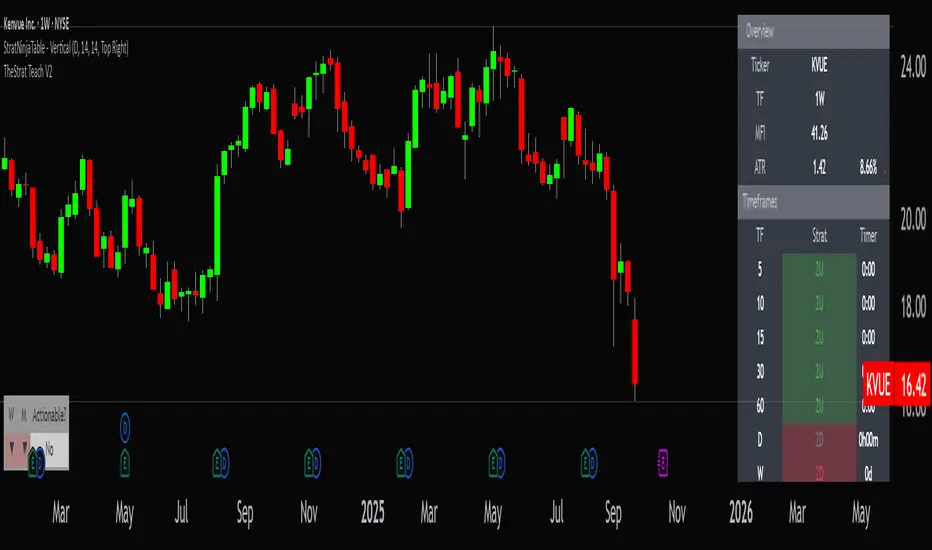
StratNinjaTable - VerticalA Pine Script v6 indicator that displays a vertical table with key The Strat data and supporting metrics. ✦ Table Structure: Overview: Ticker – the stock symbol. TF – the chart’s main timeframe. MFI – Money Flow Index with selectable timeframe. ATR – Average True Range with color coding: Green – below 3%. Yellow – between 3% and 6%. Red – above 6%. Timeframes: Displayed vertically (5m, 15m, 1H, D, W, M, etc.). Each shows the current bar type according to The Strat (1, 2U, 2D, 3). Text color reflects candle direction (green = close above open, red = close below open). Includes a countdown timer to bar close. Fundamentals: Market Cap – in billions. Sector – stock sector. SMA20 Δ – distance from the 20-period SMA (in %). Avg Volume (30d) – average 30-day volume (in millions). ✦ Adjustments Made: Removed the Strat Pattern section completely. Removed the DIR column – direction is now represented by Strat cell text color. Reordered Overview section: Ticker → TF → MFI → ATR. ATR now has three levels of coloring (Green/Yellow/Red) for >3% and >6%مؤشر Pine Script®من koriatmanagement26
Multi-Indicator Panel (RSI, Stoch, MACD, VIX Fix, MFI)A versatile single-pane oscillator panel combining RSI, Stochastic, MACD (scaled to 0–100), Williams VIX Fix (normalized & inverted: low value = high fear), and MFI. Each module is toggleable, with reference levels, background highlights, and ready-made alerts. Key features Per-indicator toggles: RSI, Stoch %K/%D, MACD (lines + optional histogram), inverted 0–100 VIX Fix, and MFI. Standard levels & center line at 50; adjustable overbought/oversold thresholds. Contextual background coloring (optional) for extreme conditions. Built-in alerts: RSI/Stoch OB/OS, MACD–Signal cross, VIX Fix “High Fear/Low Fear,” and MFI OB/OS. Unified scale: MACD mapped around 50 to align with other oscillators; VIX Fix normalized to 0–100. How to use (quick) Add the indicator → enable needed modules via “Indicator Toggles.” Tune periods & levels (e.g., RSI 14, Stoch 14/3, MACD 12-26-9, VIX Fix 22/252, MFI 14). (Optional) Turn on MACD histogram. Create alerts from “Add alert on…” using the provided conditions. Interpretation notes Inverted VIX Fix: low values ⇒ high fear/volatility (potential bounces); high values ⇒ complacency. Scaled MACD: lines around 50 ≈ MACD zero; line crosses remain valid despite scaling. Disclaimer Analysis tool, not financial advice. Test across timeframes/instruments and pair with risk management.مؤشر Pine Script®من rahmadsaleh86تم تحديثه 36
Dynamic Threshold Money Flow Indexi thought this script was a clever idea, but the more i tried to improve it, the worse it seemed to get. the idea behind this script was to build a context around a Money Flow Index that changes based on market conditions. the width of the channel is controlled by a combination of the choppiness index and an inverted, normalized, absolute value of the ROC. when the market begins trending, the channel narrows, making the MFI more likely to break out of the channel in the direction of the emerging trend. as the market becomes more choppy and the trend diminishes, the channel widens, recapturing the MFI. my initial hopes for this script was that the context-based thresholds would spare the user from choppy markets, but perhaps i need to make the channel non-linear.مؤشر Pine Script®من Shaerodenتم تحديثه 1181
Trend+Volume Confluence IndicatorScalper and swing trading signals: use the 15–30 minute charts for scalps and the 4–8 hour charts for swings. Add the Money Flow Index (MFI) for extra confluence. In an uptrend, if the MFI is at or above the halfway mark and rising, take the long. In a downtrend, if the MFI is at or below the halfway mark and falling, take the short. مؤشر Pine Script®من NLQ_XYZ1117
StratNinjaTableAuthor’s Instructions for StratNinjaTable Purpose: This indicator is designed to provide traders with a clear and dynamic table displaying The Strat candle patterns across multiple timeframes of your choice. Usage: Use the input panel to select which timeframes you want to monitor in the table. Choose the table position on the chart (top left, center, right, or bottom). The table will update each bar, showing the candle type, direction arrow, and remaining time until the candle closes for each selected timeframe. Hover over or inspect the table to understand current market structure per timeframe using The Strat methodology. Notes: The Strat pattern is displayed as "1", "2U", "2D", or "3" based on the relationship of current and previous candle highs and lows. The timer updates in real-time and adapts to daily, weekly, monthly, and extended timeframes. This script requires Pine Script version 6. Please use it on supported platforms. MFI or other indicators are not included in this base version but can be integrated separately if desired. Credits: Developed and inspired by shayy110 — thanks for your foundational work on The Strat in Pine Script. Disclaimer: This script is for educational and informational purposes only. Always verify signals and manage risk accordingly.مؤشر Pine Script®من koriatmanagement42
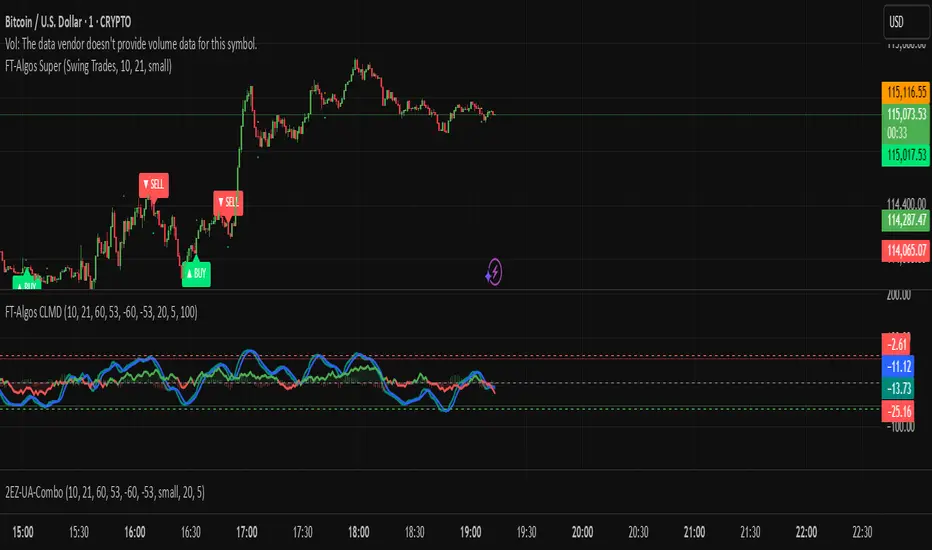
FT-Algos SuperFT-Algos: Unified Alpha Suite FT-Algos is an all-in-one Pine Script indicator designed to support traders across scalping and swing trading styles with unique multi-strategy logic and clear signals. Key Features: Three Trading Modes: Quick Scalps — Fast momentum-based entries optimized for ultra-short timeframes. Precision Scalps — Combines MACD flips, Kalman smoothing, Gaussian filters, ZLEMA, and Heikin Ashi SuperTrend to generate high-confidence scalping signals. Swing Trades — Uses trend stacking with Kalman, ZLEMA, and MACD crossovers confirmed by higher timeframe SuperTrend direction. Non-Repainting Signals: All entries rely on confirmed candle closes to avoid repainting and false signals. Visual Entry Markers: Compact BUY and SELL triangle labels placed directly above/below candles for clear signal visualization. Dynamic Take Profit and Stop Loss Levels: Calculated using Average True Range (ATR) to adjust for current market volatility. User Configurable Settings: Easily toggle signal visibility, TP/SL display, and short entry signals. Alert Conditions: Built-in alerts for buy and sell signals enable integration with TradingView’s alert system. How FT-Algos works: FT-Algos uniquely blends several filtering methods including Kalman and Gaussian smoothing, momentum evaluation, and multi-timeframe trend validation to minimize noise and improve entry precision. Each mode serves different trading styles—from rapid scalping to higher timeframe swing trading—allowing traders to adapt to their preferred strategy seamlessly. Disclaimer: This script is provided as-is for educational and informational purposes only. It does not constitute financial advice. Please test thoroughly and trade responsibly.مؤشر Pine Script®من FT-Algos1
FT-Algos CLMDFT‑Algos CLMD — Hybrid Momentum & Money Flow Detector FT‑Algos CLMD is a precision‑built trading tool that blends advanced momentum tracking with dynamic money flow analysis. It provides traders with a clear, dual‑layered view of market strength and potential turning points. Key Features Momentum oscillator with overbought/oversold zone markers. Integrated money flow overlay, scaled for direct visual comparison. Optional histogram view of momentum differentials. Adjustable smoothing and scaling controls for full customization. Automatic positive/negative zone shading for quick sentiment reading. How It Works This tool analyzes both momentum shifts and capital flow pressure to highlight moments of potential market imbalance. When both layers align, the probability of a strong move can increase — making it a powerful addition to any trading system. Notes Designed for chart analysis; does not execute trades automatically. Past performance is not indicative of future results. Always combine with disciplined risk management and other forms of analysis.مؤشر Pine Script®من FT-Algos2
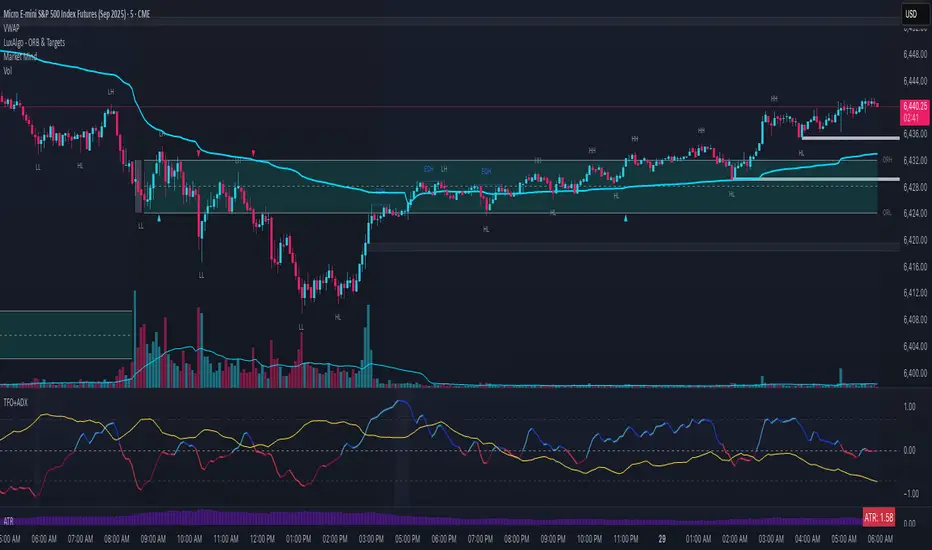
TFO + ADX with Histogram & SignalTrend Flow Oscillator (TFO + ADX) – Histogram + Signal This version of the original TFO+ADX introduces a MACD-style histogram and signal line overlay for clearer momentum and trend visualization. The Trend Flow Oscillator (TFO+ADX) blends two powerful volume-based tools — the Money Flow Index (MFI) and Chaikin Money Flow (CMF) — along with a normalized Average Directional Index (ADX). The result is a comprehensive momentum and trend strength tool that offers a more precise read on when markets are gaining or losing conviction. ⸻ How It Works 1.Money Flow Index (MFI) • Measures volume-weighted buying/selling pressure using price and volume. • Scaled between –1 and +1 for visual clarity. 2.Chaikin Money Flow (CMF) • Evaluates volume distribution over time — institutional buying (accumulation) or selling (distribution). • Also scaled between –1 and +1. 3.TFO Composite Line • Combines MFI and CMF into a single flow reading. • A signal line (EMA) tracks the trend of this flow. • A histogram plots the difference between the TFO and its signal, giving clear signals on shifts in momentum. 4.Normalized ADX Overlay • Shows trend strength on the same scale (–1 to +1). • ADX > 0 indicates strong trending conditions. • ADX < 0 signals weak or consolidating conditions. ⸻ Visual Interpretation 1. Histogram Bars • Green: TFO is above the signal line → bullish momentum accelerating • Red: TFO is below the signal line → bearish momentum building • Bar height represents the strength of the momentum shift 2. Signal Line • Tracks the smoothed trend of the TFO composite • Histogram crossing above or below zero reflects momentum crossover and can act as entry or exit signals 3. TFO Raw Line (Optional) • Still available for reference alongside the histogram • Shows the unsmoothed blended money flow direction (MFI + CMF) 4. Extreme Zones • Background shading appears when TFO exceeds ±1.0 • Helps highlight areas of stretched or unsustainable momentum, useful for spotting potential reversals or exhaustion مؤشر Pine Script®من WalrusQuantتم تحديثه 78
Trend Flow Oscillator (CMF + MFI) + ADX## Trend Flow Oscillator (TFO + ADX) Indicator Description The Trend Flow Oscillator (TFO+ADX) combines two volume-based indicators, Money Flow Index (MFI) and Chaikin Money Flow (CMF), along with the Average Directional Index (ADX) into one comprehensive oscillator. This indicator provides traders with insights into momentum, volume flow, and trend strength, clearly indicating bullish or bearish market conditions. ### How the Indicator Works: 1. **Money Flow Index (MFI)**: * Measures buying and selling pressure based on price and volume. * Scaled from -1 to +1 (where positive values indicate buying pressure, negative values indicate selling pressure). 2. **Chaikin Money Flow (CMF)**: * Evaluates money flow volume over a set period, reflecting institutional buying or selling. * Also scaled from -1 to +1 (positive values suggest bullish accumulation, negative values bearish distribution). 3. **Average Directional Index (ADX)**: * Measures trend strength, indicating whether a market is trending or ranging. * Scaled from -1 to +1, with values above 0 suggesting strong trends, and values near or below 0 indicating weak trends or sideways markets. * Specifically, an ADX value of 0 means neutral trend strength; positive values indicate a strong trend. ### Indicator Levels and Interpretation: * **Zero Line (0)**: Indicates neutral conditions. When the oscillator crosses above zero, it signals increasing bullish momentum; crossing below zero indicates bearish momentum. * **Extreme Zones (+/- 0.75)**: * Oscillator values above +0.75 are considered overbought or highly bullish. * Oscillator values below -0.75 are considered oversold or highly bearish. * The indicator features subtle background shading to visually highlight these extreme momentum areas for quick identification. * Shading when values above or below the +/-1.0 level. * **Color Coding**: * Bright blue indicates strengthening bullish momentum. * Dark blue signals weakening bullish momentum. * Bright red indicates strengthening bearish momentum. * Dark maroon signals weakening bearish momentum. مؤشر Pine Script®من WalrusQuantتم تحديثه 11115
MVO - MA Signal StrategyStrategy Description: MA Signal Strategy with Heikin Ashi, Break-even and Trailing Stop ⸻ 🔍 Core Concept This strategy enters long or short trades based on Heikin Ashi candles crossing above or below a moving average (MA), with optional confirmation from the Money Flow Index (MFI). It includes: • Dynamic stop loss and take profit levels based on ATR • Optional break-even stop adjustment • Optional trailing stop activation after breakeven • Full visual feedback for trades and zones ⸻ ⚙️ Indicators Used • Heikin Ashi Candles: Smooth price action to reduce noise. • Simple Moving Average (MA): Determines trend direction. • Average True Range (ATR): Sets volatility-based SL/TP. • Money Flow Index (MFI): Optional momentum filter for entries. ⸻ 📈 Trade Entry Logic ✅ Long Entry: Triggered if: • Heikin Ashi close crosses above the MA or • MFI is below 20 and Heikin Ashi close is above the MA ❌ Short Entry: Triggered if: • Heikin Ashi close crosses below the MA or • MFI is above 90 and Heikin Ashi close is below the MA ⸻ 🛑 Stop Loss & Take Profit • SL is set using riskMult * ATR • TP is set using rewardMult * ATR Example: • If ATR = 10, riskMult = 1, rewardMult = 5 → SL = 10 points, TP = 50 points from entry ⸻ ⚖️ Break-even Logic (Optional) • If price moves in your favor by breakevenTicks * ATR, SL is moved to entry price. • Enabled via checkbox Enable Break Even. ⸻ 📉 Trailing Stop Logic (Optional) • Once break-even is hit, a trailing stop starts moving behind price by trailATRmult * ATR. • Trailing stop only activates after break-even is reached. • Enabled via checkbox Enable Trailing Stop. 📊 Visual Elements • Heikin Ashi candles are drawn on the main chart. • Trade zones are shaded between SL and TP during open trades. • Lines mark Entry, SL, TP, Break-even trigger. • Markers show entries and exits: • Green/red triangles = long/short entries • ✅ = Take profit hit • ❌ = Stop loss hit ✅ Best Use Case • Trending markets with strong pullbacks • Works on multiple timeframes • Better suited for assets with consistent volatility (ATR behavior)استراتيجية Pine Script®من averagemouse95455
Stochastic Money Flow IndexThe Stochastic Money Flow Index (or Stochastic MFI ), is a variation of the classic Stochastic RSI that uses the Money Flow Index (MFI) rather than the Relative Strength Index (RSI) in its calculation. While the RSI focuses solely on price momentum, the MFI is a volume-weighted indicator, meaning it incorporates both price and volume data. The Stochastic MFI is intended to provide a more precise and sensitive reading of the MFI by measuring the level of the MFI relative to its range over a specific period. Settings Stochastic Settings %K Length : The number of periods used to calculate the Stochastic. (Default: 14) %K Smoothing : The SMA length used to 'smooth' the %K line. (Default: 3) %D Smoothing : The SMA length used to 'smooth' the %D line. (Default: 1) Money Flow Index Settings MFI Length : The number of periods used to calculate the Money Flow Index. (Default: 14) MFI Source : The source used to calculate the Money Flow Index. (Default: close) Additional Settings Show Overbought/Oversold Gradients? : Toggle the display of overbought/oversold gradients. (Default: true) مؤشر Pine Script®من iambrennanwalshتم تحديثه 194
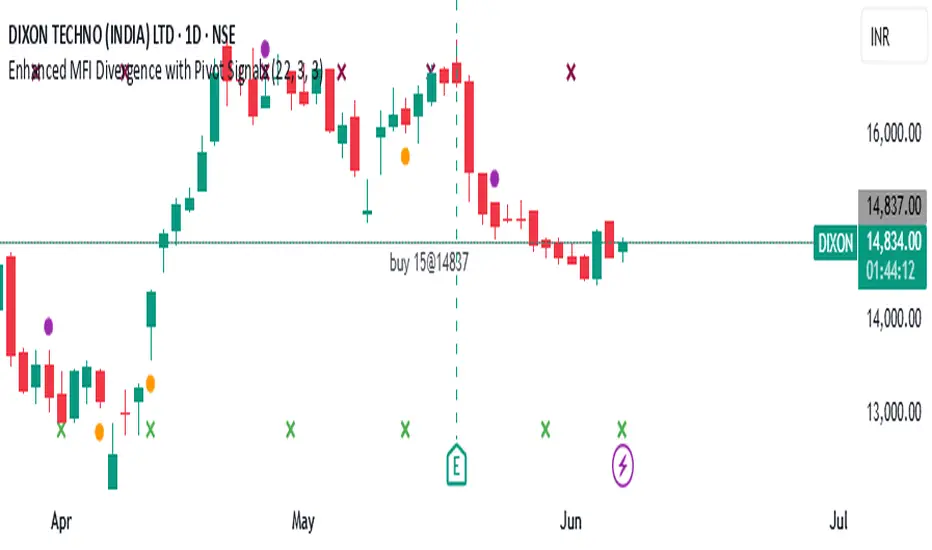
Enhanced MFI Divergence with Pivot SignalsEnhanced MFI Divergence with Pivot Signals This custom Pine Script indicator identifies bullish and bearish divergences between price action and the Money Flow Index (MFI), enhancing the trader's ability to spot potential reversal zones with visual clarity and optional confirmation filters. 📊 Key Features: 🔹 MFI Divergence Detection The script detects: Bullish divergence when price forms a lower low but MFI forms a higher low. Bearish divergence when price forms a higher high but MFI forms a lower high. 🔹 Pivot-Based Logic To ensure high-confidence signals, the script uses pivot point logic to mark local highs and lows on both price and MFI. This avoids noise and focuses only on meaningful swing points. 🔹 Optional Confirmation Filter You can enable a filter that checks if MFI is above 50 during bullish divergence (implying buying pressure) and below 50 for bearish divergence (implying selling pressure), adding an extra layer of confirmation. 🔹 Signal Markers Signals are visually displayed on the chart using colored triangles: Green triangle up for bullish divergence Red triangle down for bearish divergence 🔹 Background Color Shading The background is optionally shaded green or red based on MFI’s relationship to its smoothed WMA, helping you visually interpret trend bias. 🔹 Pivot Point Debugging Tools Circles and crosses mark pivot points on price and MFI for debugging and visual clarity. 🔹 Alerts Ready Real-time alerts notify you instantly when a bullish or bearish MFI divergence occurs, allowing for quick decision-making. ⚙️ How It Helps This indicator is designed to help traders: Anticipate price reversals by identifying hidden strength or weakness in momentum, Avoid false breakouts, Confirm entries or exits based on volume-weighted momentum divergence. It works especially well when used alongside trend-following tools like moving averages, support/resistance zones, or additional volume indicators. مؤشر Pine Script®من raghavprakash0523
MFI + RSI + EMA Dynamic SignalsThe MFI + RSI + EMA Dynamic Signals is a designed to combine with widened criteria to capture more trading opportunities, it balances momentum, trend, and flexibility, making it suitable for trading on timeframes like 15-minute to 4-hour charts. How It Works The indicator uses three technical components with relaxed criteria to produce signals: Money Flow Index (MFI) for Momentum Extremes: The MFI, calculated over a 14-period length, measures buying and selling pressure using price and volume. A buy signal can trigger when MFI crosses above the oversold level (default: 30, widened from 20), indicating potential buying pressure, while a sell signal can occur when MFI crosses below the overbought level (default: 70, widened from 80), suggesting selling pressure. Relative Strength Index (RSI) for Momentum Confirmation: The RSI, calculated over a 14-period length, confirms momentum strength. Bullish momentum is confirmed when RSI is above a buy threshold (default: 45, relaxed from 50), and bearish momentum when below a sell threshold (default: 55, relaxed from 50), allowing more signals near neutral momentum levels. Exponential Moving Average (EMA) for Trend Sensitivity: The indicator uses a fast EMA (default: 9 periods) and a slow EMA (default: 21 periods) to detect trend direction and crossovers. Signals can trigger when the fast EMA crosses the slow EMA, or when the fast EMA is within a proximity threshold (default: 0.5%) of the slow EMA, capturing early trend changes and increasing signal frequency. Signal Generation Signals are generated using the previous bar’s values to prevent repainting, with widened criteria for more frequent triggers: Buy Signal: Either the MFI crosses above the oversold level or the fast EMA crosses above the slow EMA, and either RSI confirms bullish momentum (above 45) or the EMAs are near a crossover (within 0.5%). Displayed as a green upward triangle below the bar. Sell Signal: Either the MFI crosses below the overbought level or the fast EMA crosses below the slow EMA, and either RSI confirms bearish momentum (below 55) or the EMAs are near a crossover (within 0.5%). Displayed as a red downward triangle above the bar. مؤشر Pine Script®من Raisontgh54
MFI Candle Trend🎯 Purpose: The MFI Candle Trend is a custom TradingView indicator that transforms the Money Flow Index (MFI) into candle-style visuals using various smoothing and transformation techniques. Rather than displaying MFI as a line, this script generates synthetic candles from MFI values, helping traders visualize money flow trends, strength, and potential reversals with more clarity. 📌 Trend strength can be analyzed based on buying and selling pressures in the trend direction. 🧩 How It Works: Calculates MFI values for open, high, low, and close prices. Applies optional smoothing using the user-selected moving average (EMA, SMA, WMA, etc.). Transforms the smoothed MFI data into synthetic candles using a selected method: Normal: Uses raw MFI data Heikin-Ashi: Applies HA transformation to MFI Linear: Uses linear regression on MFI values Rational Quadratic: Applies advanced rational quadratic filtering via an external kernel library Colors candles based on MFI momentum: Cyan: Strong positive MFI movement Red: Strong negative MFI movement ⚙️ Key Inputs: Method: The type of smoothing method to apply to MFI Options: None, EMA, SMA, SMMA (RMA), WMA, VWMA, HMA, Mode Length: Period for both the MFI and smoothing calculation Candle: Selects the transformation mode for generating synthetic candles Options: Normal, Heikin-Ashi, Linear, Rational Quadratic Rational Quadratic: Adjusts the depth of smoothing for the Rational Quadratic filter (applies only if selected) 📊 Outputs: Synthetic MFI Candlesticks: Plotted using the smoothed and transformed MFI values. Dynamic Coloring: Cyan when MFI momentum is increasing Red when MFI momentum is decreasing Horizontal Lines: 80: Overbought zone 20: Oversold zone 🧠 Why Use This Indicator? Unlike traditional MFI indicators that use a line plot, this tool gives traders: A candle-based visualization of money flow momentum Enhanced trend and reversal detection using color-coded MFI candles A choice of smoothing filters and transformations for noise reduction A powerful combination of momentum and structure-based analysis To combine volume and price strength into a single chart element ❗Important Note: This indicator is for educational and analytical purposes only. It does not constitute financial advice. Always use proper risk management and validate with additional tools or analysis. مؤشر Pine Script®من erdas056
Money Flow Index + VWAP Trend FilterThis indicator combines the volume-weighted momentum analysis of the Money Flow Index (MFI) with the trend-filtering capabilities of the Volume Weighted Average Price (VWAP) to generate reliable buy and sell signals. By requiring MFI overbought/oversold conditions to align with the trend direction relative to VWAP, this indicator reduces false signals, making it ideal for trading on timeframes like 5-minute to 4-hour charts. How It Works The indicator uses two technical components to produce signals: Money Flow Index (MFI) for Momentum Extremes: The MFI, calculated over a default 14-period length, measures buying and selling pressure using price and volume data. A buy signal is triggered when MFI crosses above the oversold level (default: 20), indicating potential buying pressure, while a sell signal occurs when MFI crosses below the overbought level (default: 80), suggesting selling pressure. Volume Weighted Average Price (VWAP) for Trend Direction: The VWAP calculates the average price of an asset, weighted by volume, resetting at the start of each trading session (e.g., daily for stocks). It acts as a dynamic support/resistance level. A bullish trend is confirmed when the price is above the VWAP, and a bearish trend when the price is below the VWAP. This ensures MFI signals are filtered to align with the broader trend direction, plotted as a purple line on the chart. Signal Generation Signals are generated using the previous bar’s values to prevent repainting: Buy Signal: The MFI crosses above the oversold level, and the price is above the VWAP (bullish trend). Displayed as a green upward triangle below the bar. Sell Signal: The MFI crosses below the overbought level, and the price is below the VWAP (bearish trend). Displayed as a red downward triangle above the bar. مؤشر Pine Script®من Raisontgh25
WMB Oscillator | [DeV]The "WMB Oscillator" indicator is a multi-factor momentum and volatility indicator designed to give traders a dynamic edge in identifying trend strength, market pressure, and potential turning points. By combining three powerful tools—Williams %R, Money Flow Index, and Bollinger Band Width—this oscillator presents a single histogram that visually represents the interplay between overbought/oversold levels, volume-weighted pressure, and volatility expansion. Use it to anticipate trend shifts, confirm entries, or avoid traps in ranging markets. Williams %R: Williams %R measures the closing price's position relative to the recent high-low range over a defined period. It outputs a value between 0 and -100, where values closer to -100 suggest oversold conditions, and those near 0 indicate overbought. In this oscillator, the raw %R is normalized between your defined overbought and oversold thresholds, allowing it to integrate seamlessly into the combined signal without distortion from price scale differences. Money Flow Index (MFI): The MFI gauges buying and selling pressure using both price and volume. It calculates the typical price for each bar, multiplies it by volume, and compares positive versus negative money flows over time. Normalized between your custom thresholds, the MFI component helps highlight when a move is driven by real conviction (volume) rather than weak price fluctuation, enhancing the signal’s reliability. Bollinger Band Width (BB Width): BB Width quantifies volatility by measuring the percentage difference between the upper and lower Bollinger Bands relative to their moving average. When volatility contracts, BB Width narrows—often preceding explosive moves. When it expands, volatility is peaking. Here, the raw BB Width is detrended using its moving average and scaled with a user-defined multiplier to reflect its deviation strength. Why Combine These: Each of these three metrics captures a unique dimension of market behavior: %R tracks momentum in price extremes, MFI confirms the move’s strength through volume, and BB Width anticipates volatility surges. Combined, they form a balanced oscillator that reacts fluidly to market changes while filtering out noise. The result is a nuanced, multi-angle view of the market's internal dynamics, enabling smarter, more confident trading decisions.مؤشر Pine Script®من DeVrizii12
Global M2 Money Supply Top20 + Offset & WaveThe M2 Top20 is a global aggregation of the M2 money supply from the 20 largest economies in the world , providing a comprehensive view of the total liquidity in the global financial system. It is expressed in trillions of USD. This script calculates and visualizes the M2 Money Supply of the Top 20 Global Economies, adjusted to various timeframes (4H, 1D, 1W, 1M) with customizable offset adjustments (in days) from -1000 days to +1000 days. This indicator includes data from the Americas, Europe, Africa, and the Asia Middle East , offering a diverse and balanced representation of major economic regions. The M2 of each country has been converted to USD. Additionally, the user can set a minimum and maximum offset to create a wave around the main offset and expand the comparison. Combining these options, this indicator enables users to visualize a range of the global money supply, making it useful for market analysis, economic forecasting, and understanding macroeconomic trends. This indicator is particularly valuable for traders and analysts interested in understanding the dynamics of global monetary systems and their potential impact on financial markets. Key Features: Global M2 Money Supply calculation from the Top 20 Economies. Adjustable Offset: Adjust the offset to align the indicator with the best bar. Adjustment in days, usable on different timeframes (1D, 1W, 4H, 1M). Wave Projection: Displays a "probability cloud"—a smoothed area that shows the probable path of Bitcoin, derived from shifts in global liquidity. Min/Max Offset Adjustments: Customizable offsets allow you to determine the range of future windows, helping to shape the wave and better identify liquidity-driven turning points. Use Cases: Economic Forecasting: Identify trends in global money supply and their potential market impact (e.g., historically leads Bitcoin price by +/- 78 days to +/-108 days). Market Analysis: Track the growth or contraction of money supply across key economies. Macro-Economic Analysis: Understand the relationship between monetary policies and market performance. How to use: Add the indicator to your chart. Set the timeframe to 1D to customize the offset. Set the Offset (in days). Set the Offset Range Minimum and Maximum. Show/Hide the Range Wave . Use offset = 0 to have the indicator align directly with the current data, without any shift, providing a baseline for comparison with the most recent market conditions. Countries included in the M2 Top20: China (CN), Japan (JP), South Korea (KR), Hong Kong (HK), Taiwan (TW), India (IN), Saudi Arabia (SA), Thailand (TH), Vietnam (VN), United Arab Emirates (AE), Malawi (MW) – Africa, United States (US), Canada (CA), Brazil (BR), Mexico (MX), Eurozone (EU), United Kingdom (GB), Russia (RU), Poland (PL), Switzerland (CH). These countries were selected from the ranking of the World Economy Indicator of Trading View .مؤشر Pine Script®من nbourdeau486
Multi Timeframe Altered Money Flow Index by CoffeeShopCryptoMoney Flow Index is a long used tool in trading markets, understanding to where money is moving and most importantly when its going there. One of the biggest challenges was the when part. Because seeing it on your current trading chart timeframe is easy but it gets difficult if youre attempting a top-down-analysis of market structure vs price performance. The new formula presented by @CoffeeshopCrypto is a key solution to this timeframe analysis issue. Seems like I may have solved the "glitch-In-The-Matrix". The issue was always setting a secondary MFI on your chart and telling the system you wanted to watch the 1 hour MFI from a 5 minute chart. To do this you need to wait for 12 candles to close on your 5 minute chart before you can get a 1hour MFI value. The move may have already happend and you may be too late. If there was only a better faster way to see the changing values of the High Timeframe Money Flow Index in real time without changing chart times and losing place......oh wait.....there is one now! This tool allows you to tell it what timeframe you are looking at, and what you want to compare it to. It runs the calculation in the background automatically to give you the real time values of your High Timeframe chart setting on the chart you are looking at. How to trade Long When both the LFT and HTF Money flow cross above ZERO, they are both in uptrend How to trade Short When both the LFT and HTF Money flow cross below ZERO, they are both in downtrend What happens when Low timeframe is inside the high timeframe: If High timeframe MFI is below zero but the LFT MFI is above it and still below zero, you have lost your short term downtrend. The opposite is true when the high timeframe MFI is above zero. A strong constant comparative trend is when your low timeframe MFI is leading your High timeframe MFI. Personal Settings: In my usage, i find it best to multiply my trading chart timeframe by 3 and use that number as my high timeframe MFI setting This works on ANY chart time you want. For example you are not locked to the standard built TradingView chart times. If you trade on a 7 minute timeframe, you can set your HTF to 21. 7 * 3 = 21مؤشر Pine Script®من CoffeeshopCrypto44163
Money Flow Oscillator [BullByte] Overview : The Money Flow Oscillator is a versatile technical analysis tool designed to provide traders with insights into market momentum through the Money Flow Index (MFI). By integrating trend logic, dynamic support/resistance levels, multi-timeframe analysis, and additional indicators like ADX and Choppiness, this script delivers a detailed view of market conditions and signal strength—all while adhering to TradingView’s publication guidelines. Key Features : Money Flow Analysis : Uses the MFI to assess buying and selling pressure, helping traders gauge market momentum. Trend Switch Logic : Employs ATR-based calculations to determine trend direction. The background color adjusts dynamically to signal bullish or bearish conditions, and a prominent center line changes color to reflect the prevailing trend. Dynamic Support/Resistance : Calculates oscillator support and resistance over a pivot lookback period. These levels help you identify potential breakouts or reversals as the MFI moves above or below prior levels. Signal Metrics & Classifications : Combines MFI values with additional metrics to classify signals into categories such as “Strong Bullish,” “Bullish,” “Bearish,” or “Strong Bearish.” An accompanying note provides details on momentum entry and overall signal strength. Multi-Timeframe Order Flow Confirmatio n: Analyzes the MFI on a higher timeframe to confirm order flow. This extra layer of analysis helps verify the short-term signals generated on your primary chart. Volume and ADX Integration : Incorporates volume analysis and a manual ADX calculation to further validate signal strength and trend stability. A dashboard displays these metrics for quick reference. Choppiness Indicator : Includes a choppiness index to determine if the market is trending or choppy. When the market is identified as choppy, the script advises caution by adjusting the overall signal note. Comprehensive Dashboard : A built-in dashboard presents key metrics—including ADX, MFI, order flow, volume score, and support/resistance details—allowing you to quickly assess market conditions at a glance. How to Use : Trend Identification : Monitor the dynamic background and center line colors to recognize bullish or bearish market conditions. Signal Confirmation : Use the oscillator support/resistance levels along with the signal classifications and dashboard data to make informed entry or exit decisions. Multi-Timeframe Analysis : Validate short-term signals with the higher timeframe MFI order flow confirmation. Risk Management : Always combine these insights with your own risk management strategy and further analysis. Disclaimer : This indicator is provided for educational and informational purposes only. It does not constitute financial advice. Always perform your own analysis and use proper risk management before making any trading decisions. Past performance is not indicative of future results.مؤشر Pine Script®من BullByteتم تحديثه 44205