Vegas Tunnel strategyApply Vegas Tunnel,
Use EMA144 169 as medium-term trend support
Also use EMA 576 676 and 4 multiples of 144 and 169 as long-term support and trend direction
Also increase EMA 36 43 as a short-term trend support
Suitable for stocks, indices, commodities
The applicable time scale can back-test the usability of the strategy by itself, and select the most applicable target
Introduction to current trading strategy:
According to the trend, the price will enter the market when it touches the support of each stage. When it touches the bollinger bands, it is Squeeze. Hold until it leaves the bollinger bands
But the trading strategy can be more optimized, see the code for details
المتوسطات المتحركة

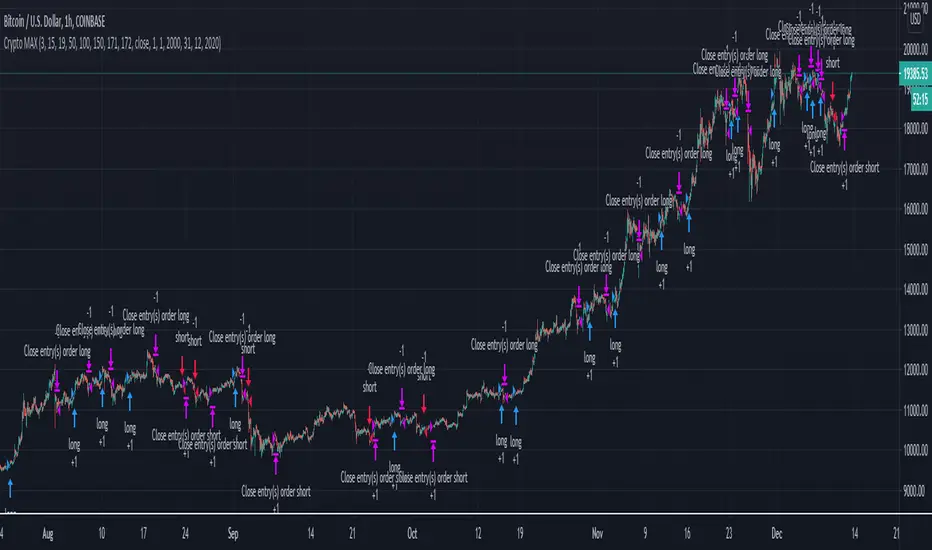
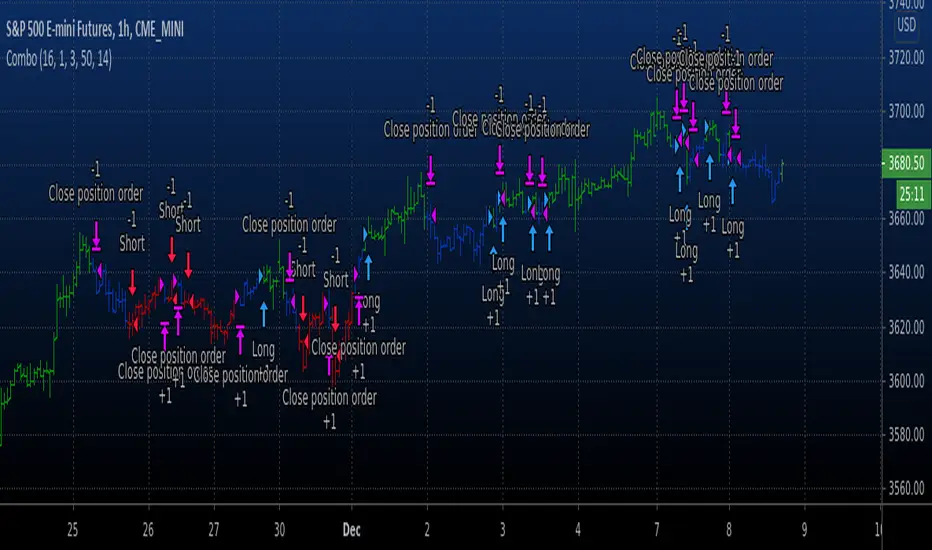
Pyramiding Entries On Early Trends (by Coinrule)Pyramiding the entries in a trading strategy may be risky but at the same time very profitable with a proper risk management approach. This strategy seeks to spot early signs of uptrends and increase the position's size while the right conditions persist.
Each trade comes with its stop-loss and take-profit to enforce a proportional risk/reward profile.
The strategy uses a mix of Moving Average based setups to define the buy-signal.
The Moving Average (200) is above the Moving Average (100), which prevents from buying when the uptrend is already in its late stages
The Moving Average (9) is above the Moving Average (100), indicating that the coin is not in a downtrend.
The price crossing above the Moving Average (9) confirms the potential upside used to fire the buy order.
Each entry comes with a stop-loss and a take-profit in a ratio of 1-to-1. After over 400 backtests, we opted for a 3% TP and 3% SL, which provides the best results.
The strategy is optimized on a 1-hour time frame.
The Advantages of this strategy are:
It offers the possibility of adjusting the size of the position proportionally to the confidence in the possibilities that an uptrend will eventually form.
Low drawdowns. On average, the percentage of trades in profit is above 60%, and the stop-loss equal to the take-profit reduces the overall risk.
This strategy returned good returns both with trading pairs with Fiat/stable coins and with BTC. Considering the mixed trends that cryptocurrencies experienced during 2020 vs BTC, this strengthens the strategy's reliability.
The strategy assumes each order to trade 20% of the available capital and pyramids the entries up to 7 times.
A trading fee of 0.1% is taken into account. The fee is aligned to the base fee applied on Binance, which is the largest cryptocurrency exchange.

Keltner Channel [LINKUSDT] 1HThis is a long-only strategy tested on LINK/USDT, 1 hour bar, from Feb 2019. The entry is determined by the breakout of upper Keltnel Channel and when the +DI is higher than 32. Instead of a fixed stop-loss from the original script , I change the exit to the middle band of the Keltnel Channel. 1st profit target will close 20% of the position. 2nd profit target will close 30% of the position. While the remaining 50% position will be closed when the price closes below the middle band of the Keltnel Channel, to take advantage of big trend. All parameters are adjustable. I added another option to enable or disable the ribbon trend filter.
My thoughts: For the same period, LINK appreciated 3000%. So I guess most in and out strategies couldn’t beat a buy and hold strategy during this period. But this doesn’t mean that this strategy is not feasible as each strategy is designed to only take advantage of a certain pattern or behavior of the market. Also, short term strategies allow you to use leverage and hence enable you to use you capital efficiently. Commission is set to 0.1%, taking account of the slippage.
Suggestion: Please perform walk forward analysis before you use real money for trading. Parameters need to be adjusted from time to time depends on your analysis. Can try using ATR for profit targets as over a longer term, the volatility might drop hence a high fixed % profit targets might not be realistic.
Any suggestions are welcome!

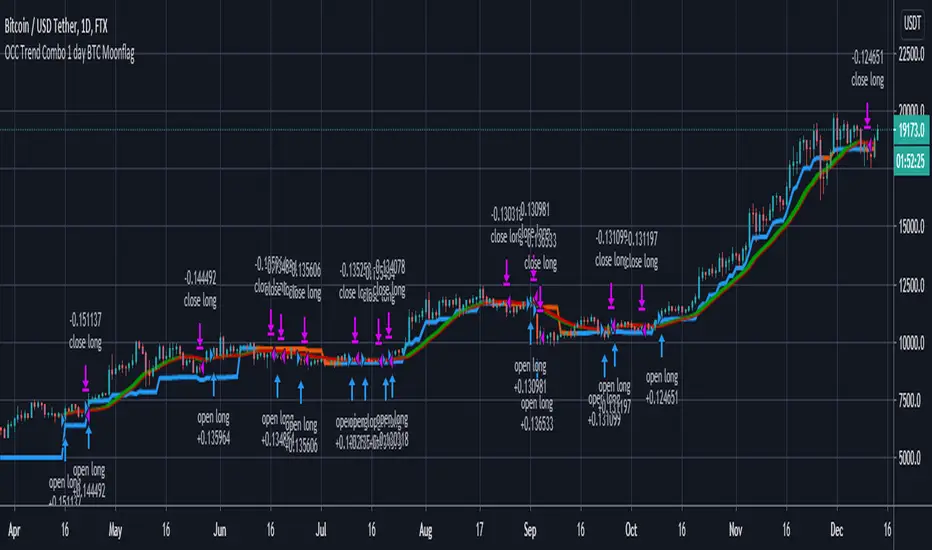
OCC Trend Combo 1 day BTC MoonflagRuns on BTC 1 DAY (NOTE USE THIS NOT THE PREVIOUS VERSION - DEFAULTS TUNED TO 1 day BTC HERE)
USE DEFAULT SETTINGS
The strategy is to maximise the profit for OCC longs (ALMA algo)
Longs start when the price action settles around the ALMA OCC, then typically breaks up
Then follow the trend indcator (blue/orange)
Shorts normally happen when the price action crosses below the ALMA OCC, although these initiate faster than the 1 day time setting - so watchout for shorts - are harder to predict than longs
So this catches most of the big move longs at their initiation
CRYPTO HA Strategy money maker long termToday I bring you another amazing strategy.
Its made of 2 EMA in this case 50 and 100.
At the same time, internaly for candles we calculate the candles using the HA system ( while still using in live the normal candles). This way we can assure that even if we use HA candles, we avoid repainting, and its legit.
We first calculate the HA candles based on the EMA 50 values, and after that , we use that candle properties to apply to EMA 100.
Once we have that, for entries we have the next conditions :
sell = o2 > c2 and o2 < c2 and time_cond
buy = o2 < c2 and o2 > c2 and time_cond
For sell : Our open from HA 100 is bigger than Close from ha 100, and the previous open is smaller than previous close
For long : Our open from ha 100 is smaller than close from ha 100 and the previous open is bigger than previous close.
Then we have 2 options :
If we wnat to go only long , which is my prefered version ,or the original one where we go both long and short.
I found that the best results are in general around bigger timeframes, 1h+ , 3h works the best so far on my tests.
For exit we have 2 versions :
1 lets say we had a long signal, as soon as we have a short signal we close the trade. Viceversa for short.
2. Is based on price % movement. In this case I use 7.5% price movement of asset.
We have no TP in use for this system.
For the purpose of this test I use 10.000 $ account. For test I use 100% of it, without any leverage.
I use the SL based on price movement , which is a very risky tool, since it can fluctuate even at 20-30% of our capital.
For comission I used 0.1% for each deal, and a slippage of 5 points.
Be cautious with this system !
If you have any questions , message me.

Crypto MultiTrend multi timeframesHello, today I bring you another crypto strategy which can work with multiple timeframes and most of crypto currencies
Its made entirelly of multiple EMA , of different lengths : like super fast, fast, normal, slow and very slow
We also combine a little bit of price action together with the trend direction both for entry and for exits, to have a more precise control.
The rules for long close is above all EMA's, they are in ascending order and the at same time close is bigger than the previous high, and previous high > second previous high, close > 3rd previous high , close > 4th previous high, close > 5th previous high, 5th high > 6th high.
For short we have the same, but instead of high, we use lows, and instead of > we use < .
As exit we have 2 conditions for long and 2 for short
To exit long we have : super fast ema < fast ema and fast ema < normal and normal < slow ema. For short, they would be the opposite, using > sign.
The second exit for long is when our current low crosses below 4 of ours EMA during the same candle. For short, is when the high crosses above 4 of ours EMA during the same candle.
CAUTIOUS : Currently it uses not risk management system, so in this current condition is extremely risky . Be careful
If you have any questions lets me know
MillebotHello Traders,
Here you find a simplified version of the Millebot strategy.
This strategy can be used as a complete system with integrated risk management. The strategy also uses a fixed stoploss and take-profit, in contrast to the full version of the Millebot, which applies a variabele SL, TP an trailing TP derived from the assets volatility.
The Millebot is a trend-following system which detects the direction of the trend through "the Baseline". The entry-point is derived by using the Hull Moving Average.
If the HMA switches direction, the trade also will be closed.
An extra confirmation indicator can be activated to verify that the trend-detection is correct.
If you have found this trading system informative or useful, please leave a comment.
This strategy works very well on leveraged trading due to the low drawdown.
Greetings Michael

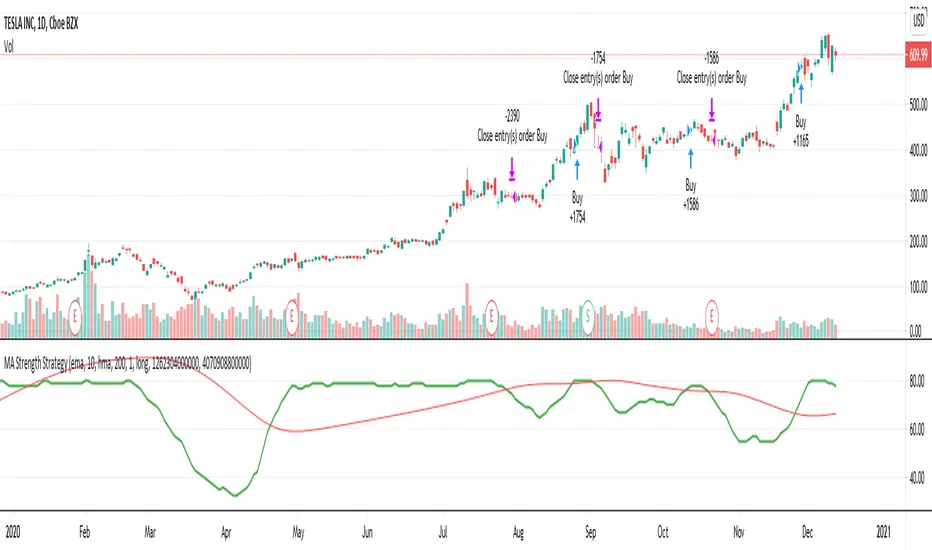
MA Strength StrategyThis is based on Aligned Moving Average Index published earlier:
But, instead of scoring trend based on how many moving averages are aligned, we are considering upside score. Higher scores are assigned for slower moving averages and lower scores for faster moving averages to give more stress to long term trend.
Buy/Sell conditions are based on moving average crossover on the upside score sum of Loopback days.
This is a very rough idea which seems to have been working ok on long only trades. Can be further improved.
Optimized RSI Strategy - Buy The Dips (by Coinrule)Buy low and sell high is every trader's mantra. While this approach looks straightforward in theory, it's sometimes challenging to put into practice. That requires stress-management to buy when price drops and resolution in selling when the price is rising. RSI is a useful tool to implement long-term and effective trading strategies. The script presents an optimized RSI trading strategy that uses a Moving average to spot the best time to buy the dip.
The strategy buys when the RSI is lower than 35, and at the same time, the price is below the MA100. In this way, the approach helps avoid catching early dips, increasing buying when the bottom approaches.
The position closes when the RSI value is above 65 . Depending on the volatility of the coins that the strategy will trade, it's possible to adjust the RSI exit value to chase larger profits.
The setup is optimized on a 15-minutes time frame and trading cryptocurrencies versus USD or stable coins.
The strategies was backtested over 150 times with multiple setups and coin to assess the best long-term system.
The strategy assumes each order to trade 30% of the available capital. A trading fee of 0.1% is taken into account. The fee is aligned to the base fee applied on Binance, which is the largest cryptocurrency exchange.

RSI of VWAP [SHORT selling]This is SHORT selling version of RSIofVWAP strategy. Settings and Logic are totally different from LONG side version , hence I am publishing it as a new strategy.
Settings
============
VWAP of RSI Length 15
Slow EMA Length 200
Short entry level 25
Cover short level 70
stop loss 5
SHORT Entry
============
condition1 : When RSIofVWAP crossdown below 25 and VWAP is below ema200
condition2: When weekly RSIofVWAP crossdown 70 and VWAP (note : session vwap , not weekly vwap) is below ema200
condition3: Use VIX value , if you want to short when the price is above ema200
vwap RSI crossing down 70 and VIX RSI is cossing up 70
enter short ... This is like falling knife :-)
I need to add the code -- later
if any of above condition is TRUE , SHORT entry will be taken
Take Profit
============
When close less than short entry price and RSIofVWAp is crossing up 25 , take profit ...close 1/3 of the position
Exit
============
When RSIofVWAP crossing up 70 level
Stop Loss
============
Stop Loss is set to 5%
Note:
1. When strategy is in SHORT position , background and bar color changes to gray
2. When strategy is already in short position , possible entries are shown in yellow background
3. RSI Length 15 is working most of the equities on hourly chart. ( RSI length 9 and 14 also works good , but not for all ... You may want to try which setting works for your symbol)
4. weekly VWAP (blue color) is also plotted by default ... you can disable it if you dont want to see it. But there is advantage keeping it on the chart , you can notice whenever weekly VWAP crosses above 70 line , trend is UP ... if you have LONG position you can hold on it ... Hurray :-)
Warning
============
For the educational purposes only

Combo Backtest 123 Reversal & Keltner Channel This is combo strategies for get a cumulative signal.
First strategy
This System was created from the Book "How I Tripled My Money In The
Futures Market" by Ulf Jensen, Page 183. This is reverse type of strategies.
The strategy buys at market, if close price is higher than the previous close
during 2 days and the meaning of 9-days Stochastic Slow Oscillator is lower than 50.
The strategy sells at market, if close price is lower than the previous close price
during 2 days and the meaning of 9-days Stochastic Fast Oscillator is higher than 50.
Second strategy
The Keltner Channel, a classic indicator
of technical analysis developed by Chester Keltner in 1960.
The indicator is a bit like Bollinger Bands and Envelopes.
WARNING:
- For purpose educate only
- This script to change bars colors.
EMA Crossover Strategy ExampleThis is a script written as an example of how to build a simple strategy with user-defined inputs based on a simple Moving Average crossover.
--
This indicator is used for backtesting Moving Average crossover strategies (only for long trades).
A "short" and "long" moving average period and calculation method (the "smoothing type") are user-adjustable. The trade is triggered when the "short" moving average crosses over the "long" moving average.
A third customizable moving average is provided which is used as a trigger to exit the trade when the *close* of a candle crosses below this "exit" moving average. Again the period and smoothing type are user-adjustable.

Combo Backtest 123 Reversal & Kaufman Moving Average Adaptive// This is combo strategies for get a cumulative signal.
//
First strategy
This System was created from the Book "How I Tripled My Money In The
Futures Market" by Ulf Jensen, Page 183. This is reverse type of strategies.
The strategy buys at market, if close price is higher than the previous close
during 2 days and the meaning of 9-days Stochastic Slow Oscillator is lower than 50.
The strategy sells at market, if close price is lower than the previous close price
during 2 days and the meaning of 9-days Stochastic Fast Oscillator is higher than 50.
Second strategy
Everyone wants a short-term, fast trading trend that works without large
losses. That combination does not exist. But it is possible to have fast
trading trends in which one must get in or out of the market quickly, but
these have the distinct disadvantage of being whipsawed by market noise
when the market is volatile in a sideways trending market. During these
periods, the trader is jumping in and out of positions with no profit-making
trend in sight. In an attempt to overcome the problem of noise and still be
able to get closer to the actual change of the trend, Kaufman developed an
indicator that adapts to market movement. This indicator, an adaptive moving
average (AMA), moves very slowly when markets are moving sideways but moves
swiftly when the markets also move swiftly, change directions or break out of
a trading range.
WARNING:
- For purpose educate only
- This script to change bars colors.
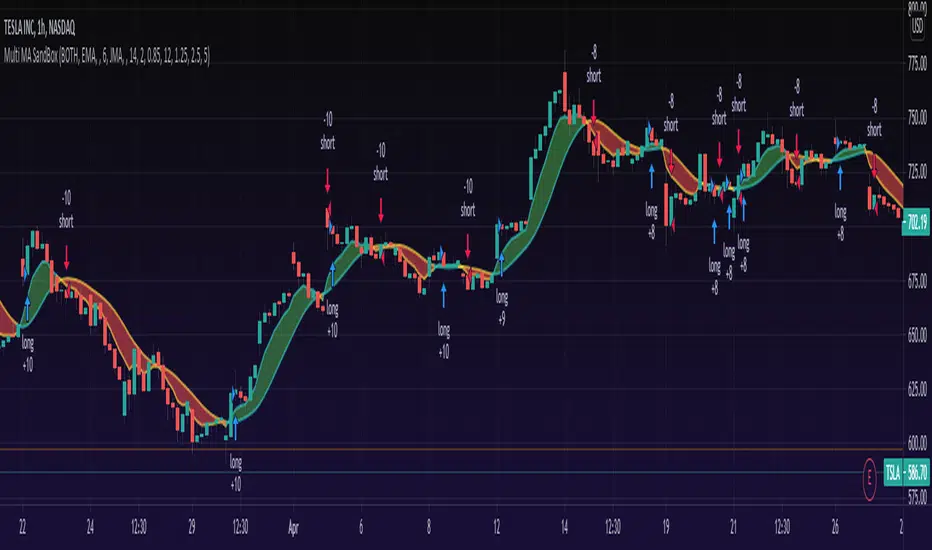
Multi MA MTF SandBox StrategyA moving averages SandBox strategy where you can experiment using two different moving averages (like KAMA, ALMA, HMA, JMA, VAMA and more) on different time frames to generate BUY and SELL signals, when they cross.
Great sandbox for experimenting with different moving averages and different time frames.
== How to use ==
We select two types of moving averages on two different time frames (or the same time frame):
First is the FAST moving average that should be at the same time frame or higher.
Second is the SLOW moving average that should be on the same time frame or higher.
== Buy and Sell Signals ==
When FAST moving average cross over the SLOW moving average we have a BUY signal (for LONG)
When FAST moving average cross under the SLOW moving average we have a SELL signal (for SHORT)
WARNING: Using a lower time frame than your chart time frame will result in unrealistic results in your backtesting and bar replay.
== NOTES ==
You can select BOTH, LONG, SHORT or NONE in the strategy settings.
You can also enable Stop Loss and Take Profit.
More sandboxes to come, Follow to get notified.
Like if you like and Enjoy!
Can also act as indicator by setting 'What trades should be taken' to 'NONE':
Crypto BOT lower timeframesThis is a crypto bot designed for lower time frames.
Its made of 2 EMA, one fast and one slower . They are combined together with Stochastic, MACD and price action patterns.
For entries we have multiple conditions :
First we check if one of our last 4 closed candles crossed above or below the faster EMA. After that for long, we check that last close is above the fast EMA, that the fast ema is above the slower EMA, at the same time that the histogram from MACD is positive and that we have crossover with the oversold line on stochastic. For the short , the opposite of long.
For exit we have TP/SL mechanic based on price % movement, in this example if the price moved 10% from the initial position it will exit.

Price action strategy FOREX with amazing results
Hello, today I bring another amazing strategy for forex .
Its made of T3 moving average , combined together with a pattern rule and a specific entry time.
We take all of that and we trade it in inverse.
So what normally for long would be : close higher than the previos high and close higher than the average, we use this as a short condition. We do the same stuff for long condition.
So in the end we end up with an amazing product.
It also has a risk management inside, with a TP/SL based on % move of the price .
Let me know how it goes .
