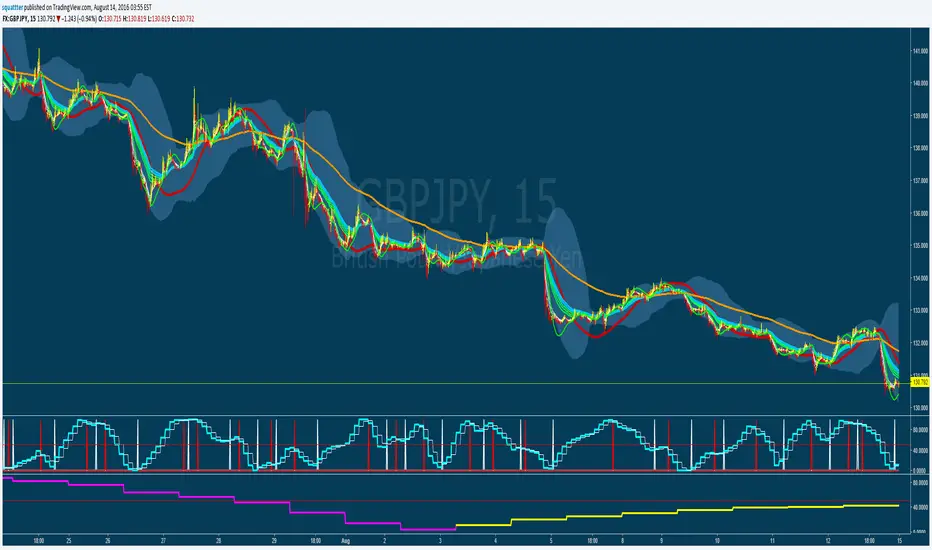
MTF Stochastic CCI ALERTWorks good on 5 or 15min set to the 2hr or 4hr time frame.
Set an alarm (Set an alert on each Long/Short "crossing down", 0.8 (or anything below 0.99), "on condition" )
Or just as a visual.
Best to use other factors to confirm but most of the time it does a pretty decent job.
Mtf

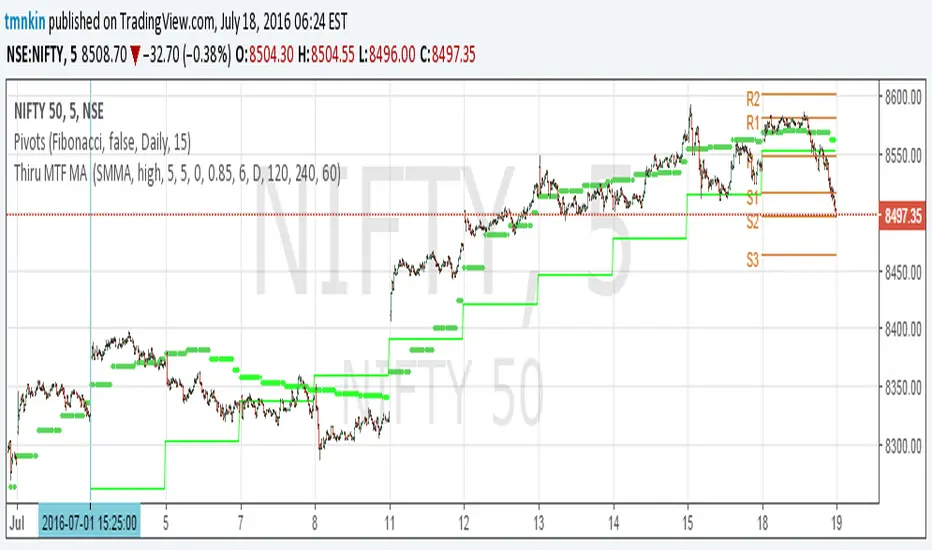
Thiru's Multi Time Frame MA DuplicatesDescription:
// - One stop shop for multiple MA duplicates over different resolutions.
// - A veritable banquet of MA's to choose from.
// - Set up you MA variables, and then plot up to 4 duplicates all using different time frames.
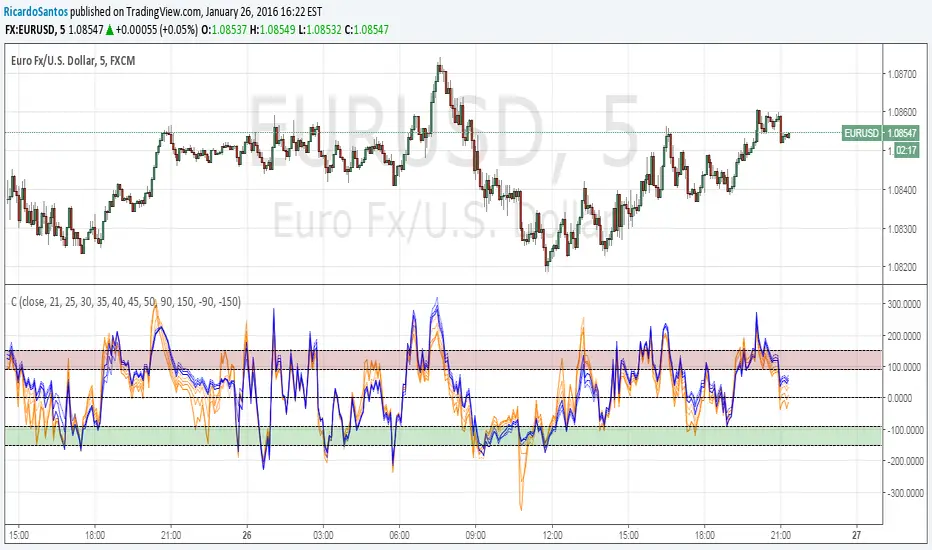
Stochastic RSI - MTF - Up/down colours - 4hr default - squattterStochastic RSI - MTF - Up/down colours - 4hr (240) default
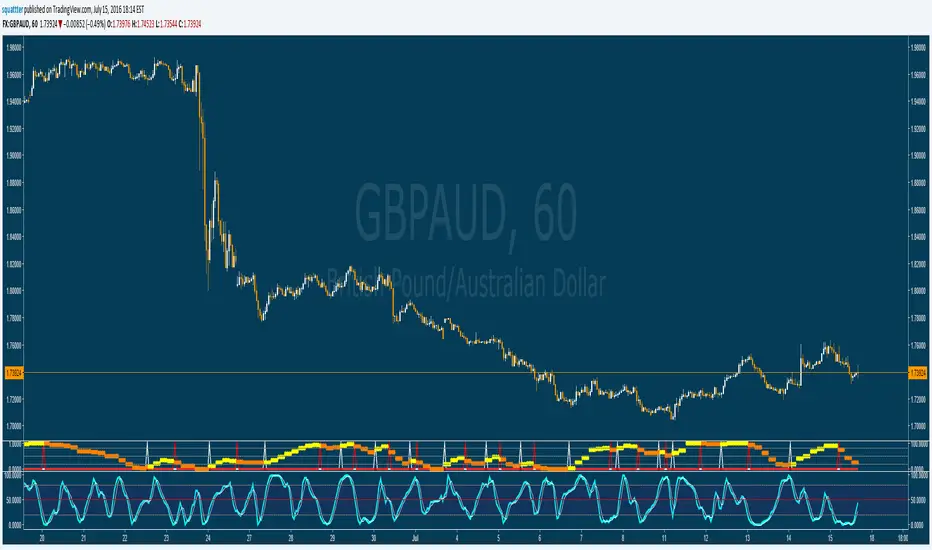
Stochastic CCI MTF w/ UP/DOWN colours - squattterStoch CCI has a nicer divergence than Stoch RSI.
Enjoy!
Stochastic CCI MTF w/ UP/DOWN colours - squattterStoch CCI has nicer divergences than Stoch RSI.
Enjoy.

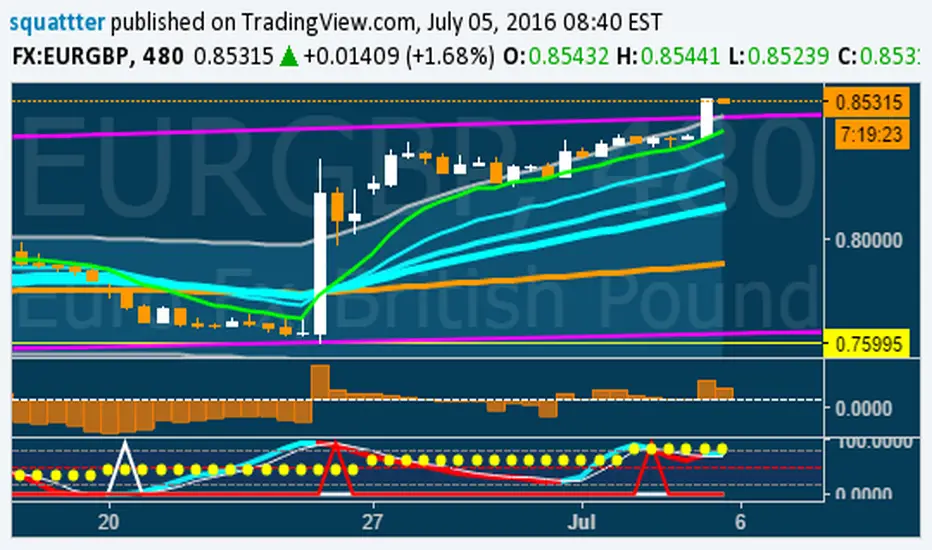
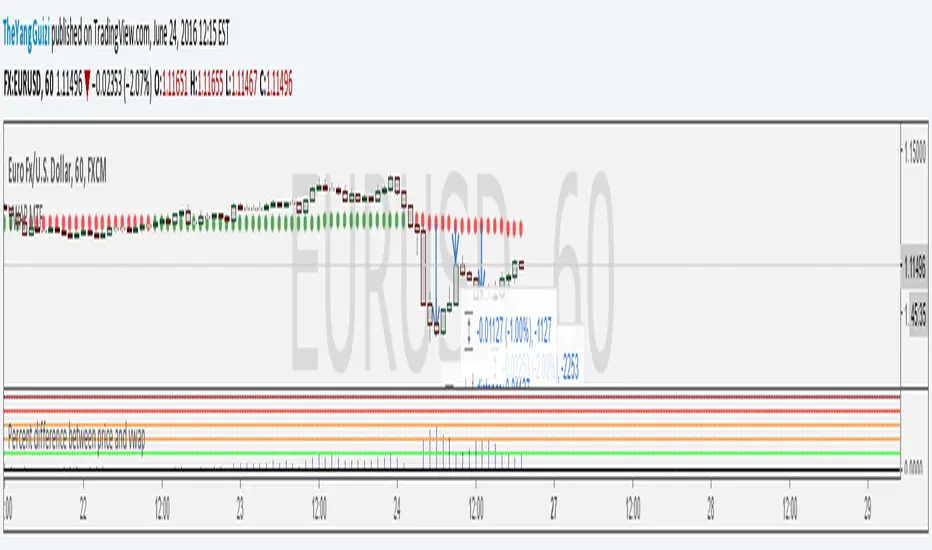
Percent Difference Between VWAP and Price MTFShows the difference between vwap and price in percent.
You can can choose between multiple timeframe vwap. Default is normal daily.
The levels on the indicator can be changed to whatever you want to.
In the chart above we can see eurusd reverting up at 3% below monthly vwap, after the brexit dip, It then turns down again at 1% from monthly and lastly it turns up again at 2% from monthly.
Script is a small modification of this:
VWAP MTF (Multi Timeframe)VWAP that can be be plotted from different timeframes.
Ex if you chose 60 min, it will plot a new vwap line at the start of every hour.
Intraday:
Used code from SandroTurriate to create this.

EMA bullish/bearish dashboard - MTFThis is a good reminder for which way you should be placing orders.
It's best to not ignore these signals!!!
lime = full bull - 100ema above 200ema and price is above 200ema
green = hallf bull - price now below 200ema but 100ema is still above the 200
maroon = full bear - opposite of full bull
red = half bear - opposite of half bull
Also with multi timeframe option - so I guess you could stack several of these on a single framed chart if you wanted.

[RS]MTF Intraday Dayly Range V0calculation to display a dayly donchian channel at any intraday timeframe.

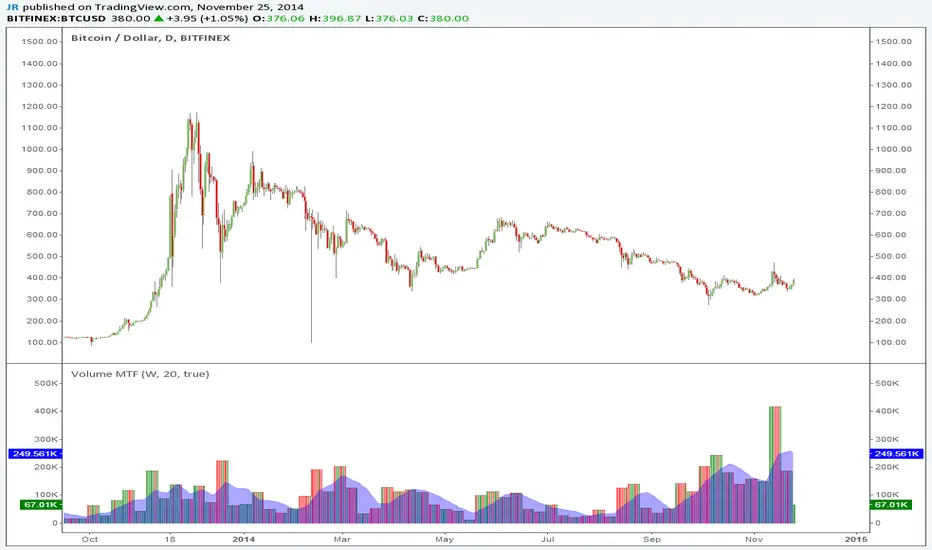
Volume MTFThis is a simple indicator you can use to separate volume from price on your chart. You can also select different time frames (MTF).
Thanks to LazyBear for cleaning up my previous messy code.
Multi-Functional Fisher Transform MTF with MACDL TRIGGERWhat this indicator gives you is a true signal when price is exhausted and ready for a fast turnaround. Fisher Transform is set for multi-time frame and also allows the user to change the length. This way a user can compare two or more time spans and lengths to look for these MACDL divergent triggers after a Fisher exhaustion. With so many indicators, it's probably best to merge these indicators and change the Fisher and Trigger colors so you can still have a look at price action (remember to scale right after merger). I've noticed from time to time when you have Fisher 34 100 and 300 up and running on two different time frames such as 5 and 15 min charts, with MACDL triggers on the 100/300 or 34/100 you get a high probability trade trigger. However, there are rare exceptions such as when price moves in a parabolic state up or down for a long period where this indication does not work. Ideally this indicator works best in a sideways market or slow rising/descending moving market.
This indicator was worked on by Glaz, nmike and myself
LazyBear also introduced the MACDL indicator
