MTC – Multi-Timeframe Trend Confirmator V2MTC – Multi-Timeframe Trend Confirmator V2
A comprehensive trend analysis indicator that systematically combines six technical indicators across three customizable timeframes, using a weighted scoring system to identify high-probability trend conditions.
ORIGINALITY AND CONCEPT
This indicator is original in its approach to multi-timeframe trend confirmation. Rather than relying on a single indicator or timeframe, it creates a composite score by evaluating six different technical conditions simultaneously across three timeframes. The scoring system weighs certain indicators more heavily based on their reliability in trend identification. The visual gauge provides an at-a-glance view of trend alignment across timeframes, making it easier to identify when multiple timeframes agree - a condition that typically produces stronger, more reliable trends.
HOW IT WORKS - DETAILED SCORING METHODOLOGY
The indicator evaluates six technical conditions on each timeframe. Each condition contributes to a composite score:
EMA 200 (Weight: 1 point)
Bullish: Price closes above EMA 200 (+1)
Bearish: Price closes below EMA 200 (-1)
Rationale: Long-term trend direction
SMA 50/200 Crossover (Weight: 1 point)
Bullish: SMA 50 above SMA 200 (+1)
Bearish: SMA 50 below SMA 200 (-1)
Rationale: Golden/Death cross confirmation
RSI 14 (Weight: 1 point)
Bullish: RSI above 55 (+1)
Bearish: RSI below 45 (-1)
Neutral: RSI between 45-55 (0)
Rationale: Momentum filter with buffer zone to avoid chop
MACD (12,26,9) (Weight: 1 point)
Bullish: MACD line above signal line (+1)
Bearish: MACD line below signal line (-1)
Rationale: Trend momentum confirmation
ADX 14 (Weight: 2 points - DOUBLE WEIGHTED)
Requires ADX above 25 to activate
Bullish: DI+ above DI- and ADX > 25 (+2)
Bearish: DI- above DI+ and ADX > 25 (-2)
Neutral: ADX below 25 (0)
Rationale: Trend strength filter - only counts when a strong trend exists. Double weighted because ADX is specifically designed to measure trend strength, making it more reliable than oscillators.
Supertrend (Factor: 3.0, ATR Period: 10) (Weight: 2 points - DOUBLE WEIGHTED)
Bullish: Direction indicator = -1 (+2)
Bearish: Direction indicator = +1 (-2)
Rationale: Dynamic support/resistance that adapts to volatility. Double weighted because Supertrend provides clear, objective trend signals with built-in stop-loss levels.
COMPOSITE SCORE CALCULATION:
Total possible score range: -10 to +10 points
Score interpretation:
Score > 2: UPTREND (majority of indicators bullish, especially weighted ones)
Score < -2: DOWNTREND (majority of indicators bearish, especially weighted ones)
Score between -2 and +2: NEUTRAL/RANGING (mixed signals or weak trend)
The threshold of +/- 2 was chosen because it requires more than just basic agreement - it typically means at least 3-4 indicators align, or that the heavily-weighted indicators (ADX, Supertrend) confirm the direction.
MULTI-TIMEFRAME LOGIC:
The indicator calculates the composite score independently for three timeframes:
Higher Timeframe (default: 4H) - Major trend direction
Mid Timeframe (default: 1H) - Intermediate trend
Lower Timeframe (default: 15min) - Entry timing
Main Trend Confirmation Rule:
The indicator only signals a confirmed trend when BOTH the higher timeframe AND mid timeframe scores agree (both > 2 for uptrend, or both < -2 for downtrend). This dual-timeframe confirmation significantly reduces false signals during choppy or ranging markets.
HOW TO USE IT
Setup:
Add indicator to chart
Customize timeframes based on your trading style:
Scalpers: 15min, 5min, 1min
Day traders: 4H, 1H, 15min (default)
Swing traders: Daily, 4H, 1H
Toggle individual indicators on/off based on your preference
Adjust Supertrend parameters if needed for your instrument's volatility
Reading the Gauge (Top Right Corner):
Each row shows one timeframe
Left column: Timeframe label
Middle column: Visual strength bars (10 bars = maximum score)
Green bars = Bullish score
Red bars = Bearish score
Yellow bars = Neutral/ranging
More filled bars = stronger trend
Right column: Numerical score
Trading Signals:
Entry Signals:
Long Entry: Wait for upward triangle arrow (appears when higher + mid TF both bullish)
Confirm gauge shows green bars on higher and mid timeframes
Lower timeframe should ideally turn green for entry timing
Chart background tints light green
Short Entry: Wait for downward triangle arrow (appears when higher + mid TF both bearish)
Confirm gauge shows red bars on higher and mid timeframes
Lower timeframe should ideally turn red for entry timing
Chart background tints light red
Position Management:
Stay in position while higher and mid timeframes remain aligned
Consider reducing position size when mid timeframe score weakens
Exit when higher timeframe trend reverses (daily label changes)
Avoiding False Signals:
Ignore signals when gauge shows mixed colors across timeframes
Avoid trading when scores are close to threshold (+/- 2 to +/- 4 range)
Best trades occur when all three timeframes align (all green or all red in gauge)
Use the numerical scores: higher absolute values (7-10) indicate stronger, more reliable trends
Practical Examples:
Example 1 - Strong Uptrend Entry:
Higher TF: +8 (strong green bars)
Mid TF: +6 (strong green bars)
Lower TF: +4 (moderate green bars)
Action: Look for long entries on lower timeframe pullbacks
Background is tinted green, upward arrow appears
Example 2 - Ranging Market (Avoid):
Higher TF: +3 (weak green)
Mid TF: -1 (weak red)
Lower TF: +2 (neutral yellow)
Action: Stay out, wait for alignment
Example 3 - Trend Reversal Warning:
Higher TF: +7 (still green)
Mid TF: -3 (turned red)
Lower TF: -5 (strong red)
Action: Consider exiting longs, prepare for potential higher TF reversal
Customization Options:
Timeframes: Adjust all three to match your trading horizon
Indicator Toggles: Disable indicators that don't suit your instrument:
Disable RSI for highly volatile crypto markets
Disable SMA crossover for range-bound instruments
Keep ADX and Supertrend enabled for trending markets
Visual Preferences:
Arrow size: 5 options from Tiny to Huge
Gauge size: Small/Medium/Large for different screen sizes
Toggle arrows on/off if you only want the gauge
Alert Setup:
Right-click chart, "Add Alert"
Condition: MTC v6 - UPTREND or DOWNTREND
Get notified when multi-timeframe confirmation occurs
Best Practices:
Use with Price Action: The indicator works best when combined with support/resistance levels, chart patterns, and volume analysis
Risk Management: Even with multi-timeframe confirmation, always use stop losses
Market Context: Works best in trending markets; less reliable in strong consolidation
Backtesting: Test the default settings on your specific instrument and timeframe before live trading
Patience: Wait for full multi-timeframe alignment rather than taking premature signals
Technical Notes:
All calculations use Pine Script's security function to fetch data from multiple timeframes
Prevents repainting by using confirmed bar data
Gauge updates in real-time on the last bar
Daily labels mark at the open of each new daily candle
Works on all instruments and timeframes
This indicator is ideal for traders who want objective, systematic trend identification without the complexity of analyzing multiple indicators manually across different timeframes.
-NATANTIA
Multi-timeframe

Liquidity Sweep & FVG StrategyThis strategy combines higher-timeframe liquidity levels, stop-hunt (sweep) logic, Fair Value Gaps (FVGs) and structure-based take-profits into a single execution engine.
It is not a simple mash-up of indicators: every module (HTF levels, sweeps, FVGs, ZigZag, sessions) feeds the same entry/exit logic.
1. Core Idea
The script looks for situations where price:
Sweeps a higher-timeframe high/low (takes liquidity around obvious levels),
Then forms a displacement candle with a gap (FVG) in the opposite direction,
Then uses the edge of that FVG as a limit entry,
And manages exits using unswept structural levels (ZigZag swings or HTF levels) as targets.
The intent is to systematically trade failed breakouts / stop hunts with a defined structure and risk model.
It is a backtesting / study tool, not a signal service.
2. How the Logic Works (Conceptual)
a) Higher-Timeframe Liquidity Engine
Daily, Weekly and Monthly highs/lows are pulled via request.security() and stored as HTF liquidity levels.
Each level is drawn as a line with optional label (1D/1W/1M High/Low).
A level is marked as “swept” once price trades through it; swept levels may be removed or shortened depending on settings.
b) Sweep & Manipulation Filter
A low sweep occurs when the current low trades through a stored HTF low.
A high sweep occurs when the current high trades through a stored HTF high.
If both a high and a low are swept in the same bar, the script flags this as “manipulation” and blocks new entries around that noise.
The script also tracks the sweep wick, bar index and HTF timeframe for later use in SL placement and labels.
c) FVG Detection & Management
FVGs are defined using a 3-candle displacement model:
Bullish FVG: high < low
Bearish FVG: low > high
Only gaps larger than a minimum size (ATR-based if no manual value is set) are kept.
FVGs are stored in arrays as boxes with: top, bottom, mid (CE), direction, and state (filled / reclaimed).
Boxes are auto-extended and visually faded when price is far away, or deleted when filled.
d) Entry Conditions (Sweep + FVG)
For each recent sweep window:
After a low sweep, the script searches for the nearest bullish FVG below price and uses its top edge as a long limit entry.
After a high sweep, it searches for the nearest bearish FVG above price and uses its bottom edge as a short limit entry.
A “knife protection” check blocks trades where price is already trading through the proposed stop.
Only one entry per sweep is allowed; entries are only placed inside the configured NY trading sessions and only if no manipulation flag is active and EOD protection allows it.
e) Stop-Loss Placement (“Tick-Free” SL)
The stop is not placed directly on the HTF level; instead, the script scans a window around the sweep bar to find a local extreme:
Longs: lowest low in a configurable bar window around the sweep.
Shorts: highest high in that window.
This produces a structure-based SL that is generally outside the main sweep wick.
f) Take-Profit Logic (ZigZag + HTF Levels)
A lightweight ZigZag engine tracks swing highs/lows and removes levels that have already been broken.
For intraday timeframes (< 1h), TP candidates come from unswept ZigZag swings above/below the entry.
For higher timeframes (≥ 1h), TP candidates fall back to unswept HTF liquidity levels.
The script picks up to two targets:
TP1: nearest valid target in the trade direction (or a 2R fallback if none exists),
TP2: second target (or a 4R fallback if none exists).
A multi-TP model is used: typically 50% at TP1, remainder managed towards TP2 with breakeven plus offset once TP1 is hit.
g) Session & End-of-Day Filters
Three predefined NY sessions (Early, Open, Afternoon) are available; entries are only allowed inside active sessions.
An End-of-Day filter checks a user-defined NY close time and:
Blocks new entries close to the end of the day,
Optionally forces flat before the close.
3. Inputs Overview (Conceptual)
Liquidity settings: which HTF levels to track (1D/1W/1M), how many to show, and sweep priority (highest TF vs nearest vs any).
FVG settings: visibility radius, search window after a sweep, minimum FVG size.
ZigZag settings: swing length used for TP discovery.
Execution & protection: limit order timeout, breakeven offset, EOD protection.
Visuals: labels, sweep markers, manipulation warning, session highlighting, TP lines, etc.
For exact meaning of each input, please refer to the inline comments in the open-source code.
4. Strategy Properties & Backtesting Notes
Default strategy properties in this script:
Initial capital: 100,000
Order size: 10% of equity (strategy.percent_of_equity)
Commission: 0.01% per trade (adjust as needed for your broker/asset)
Slippage: must be set manually in the Strategy Tester (recommended: at least a few ticks on fast markets).
Even though the order size is 10% of equity, actual risk per trade depends on the SL distance and is typically much lower than 10% of the account. You should still adjust these values to keep risk within what you personally consider sustainable (e.g. somewhere in the 1–2% range per trade).
For more meaningful results:
Test on liquid instruments (e.g. major indices, FX, or liquid futures).
Use enough history to reach 100+ closed trades on your market/timeframe.
Always include realistic commission and slippage.
Do not assume that past performance will continue.
5. How to Use
Apply the strategy to your preferred symbol and timeframe.
Set broker-like commission and slippage in the Strategy Tester.
Adjust:
HTF levels (1D/1W/1M),
Sessions (NY windows),
FVG search window and minimum size,
ZigZag length and EOD filter.
Observe how entries only appear:
After a HTF sweep,
In the configured session,
At a FVG edge,
With TP lines anchored at unswept structure / liquidity.
Use this primarily as a research and backtesting tool to study how your own ICT / SMC ideas behave over a large sample of trades.
6. Disclaimer
This script is for educational and research purposes only.
It does not constitute financial advice, and it does not guarantee profitability. Always validate results with realistic assumptions and use your own judgment before trading live.

Smart RSI Composite [DotGain]Summary
Do you want to know the "True Direction" of the market without getting distracted by noise on a single timeframe?
The Smart RSI Composite simplifies market analysis by aggregating momentum data from 10 different timeframes (5m to 12M) into a single, easy-to-read Histogram.
Instead of looking at 10 separate charts or dots, this indicator calculates the Average RSI of the entire market structure. It answers one simple question: "Is the market predominantly Bullish or Bearish right now?"
⚙️ Core Components and Logic
This indicator works like a consensus mechanism for momentum:
Data Aggregation: It pulls RSI values from 10 customizable slots (Default: 5m, 15m, 1h, 4h, 1D, 1W, 1M, 3M, 6M, 12M). All slots are enabled by default.
Smart Averaging: It calculates the arithmetic mean of all active timeframes. If the 5m chart is bearish but the Monthly chart is bullish, this indicator balances them out to show you the net result.
Histogram Visualization: The result is plotted as a histogram centered around the 50-line (Neutral).
🚦 How to Read the Histogram
The histogram bars indicate the aggregate strength of the trend based on the Average RSI:
🟩 DARK GREEN (Strong Bullish)
Condition: Average RSI > 60.
Meaning: The market is in a strong uptrend across most timeframes. Momentum is firmly on the buyers' side.
🟢 LIGHT GREEN (Weak Bullish)
Condition: Average RSI between 50 and 60.
Meaning: Slight bullish bias. The bulls are in control, but momentum is not yet extreme.
🔴 LIGHT RED (Weak Bearish)
Condition: Average RSI between 40 and 50.
Meaning: Slight bearish bias. The bears are taking control.
🟥 DARK RED (Strong Bearish)
Condition: Average RSI < 40.
Meaning: The market is in a strong downtrend across most timeframes. Momentum is firmly on the sellers' side.
Visual Elements
Center Line (50): This acts as the Zero-Line. Above 50 is bullish, below 50 is bearish.
Zone Lines (30/70): Dashed lines indicate the traditional Overbought/Oversold levels applied to the aggregate average.
Key Benefit
The Smart RSI Composite acts as a powerful Macro Trend Filter .
Pro Tip: Never go long if the Histogram is Dark Red, and avoid shorting when it is Dark Green. Use this tool to align your trades with the overall market momentum.
Have fun :)
Disclaimer
This "Smart RSI Composite" indicator is provided for informational and educational purposes only. It does not, and should not be construed as, financial, investment, or trading advice.
The signals generated by this tool (both "Buy" and "Sell" indications) are the result of a specific set of algorithmic conditions. They are not a direct recommendation to buy or sell any asset. All trading and investing in financial markets involves substantial risk of loss. You can lose all of your invested capital.
Past performance is not indicative of future results. The signals generated may produce false or losing trades. The creator (© DotGain) assumes no liability for any financial losses or damages you may incur as a result of using this indicator.
You are solely responsible for your own trading and investment decisions. Always conduct your own research (DYOR) and consider your personal risk tolerance before making any trades.

Smart RSI MTF Matrix [DotGain]Summary
Are you tired of trading trend signals, only to miss the bigger picture because you are focused on a single timeframe?
The Smart RSI MTF Matrix is the ultimate "Cockpit View" for momentum traders. Unlike chart overlays that can sometimes clutter your price action, this indicator organizes RSI conditions across 10 different timeframes simultaneously into a clean, separate Heatmap pane.
It monitors everything from the 5-minute chart all the way up to the 12-Month view , giving you a complete X-ray vision of the market's momentum structure instantly.
⚙️ Core Components and Logic
The Smart RSI MTF Matrix relies on a sophisticated hierarchy to deliver clear, actionable context:
Multi-Timeframe Engine: The script runs 10 independent RSI calculations in the background, organized in rows from bottom (Short Term) to top (Long Term).
Classic RSI Thresholds:
Overbought (> 70): Indicates price may be extended to the upside.
Oversold (< 30): Indicates price may be extended to the downside.
Smart Visibility System (The "Secret Sauce"): Not all signals are equal. A 5-minute signal is "noise" compared to a Yearly signal. This indicator automatically applies Transparency to differentiate importance. The visibility increases by 10% for each higher timeframe slot (Row).
🚦 How to Read the Matrix
The indicator plots dots in 10 stacked rows. The position and opacity tell you the direction and significance:
🟥 RED DOTS (Overbought Condition)
Trigger: RSI is above 70 on that specific timeframe.
Meaning: Potential bearish reversal or pullback.
🟩 GREEN DOTS (Oversold Condition)
Trigger: RSI is below 30 on that specific timeframe.
Meaning: Potential bullish reversal or bounce.
⚪ GRAY DOTS (Neutral)
Trigger: RSI is between 30 and 70.
Meaning: No extreme momentum present.
👻 TRANSPARENCY (Signal Strength)
The visibility of the dot tells you exactly which Timeframe (Row) is triggered. The higher the row, the more solid the color:
Faint (10-30% Visibility): Rows 1-3 (5m, 15m, 1h). Used for scalping entries.
Medium (40-60% Visibility): Rows 4-6 (4h, 1D, 1W). Used for swing trading context.
Solid (70-100% Visibility): Rows 7-10 (1M, 3M, 6M, 12M). Used for identifying major macro cycles.
Visual Elements
Structure: Row 1 (Bottom) represents the 5-minute timeframe. Row 10 (Top) represents the 12-Month timeframe.
Vertical Alignment: If you see a vertical column of Red or Green dots, it indicates Multi-Timeframe Confluence —a highly probable reversal point.
Key Benefit
The goal of the Smart RSI MTF Matrix is to keep your main chart clean while providing maximum information. You can instantly see if a short-term pullback (Faint Green Dot) is happening within a long-term uptrend (Solid Gray/Red Dot), allowing for precision entries.
Have fun :)
Disclaimer
This "Smart RSI MTF Matrix" indicator is provided for informational and educational purposes only. It does not, and should not be construed as, financial, investment, or trading advice.
The signals generated by this tool (both "Buy" and "Sell" indications) are the result of a specific set of algorithmic conditions. They are not a direct recommendation to buy or sell any asset. All trading and investing in financial markets involves substantial risk of loss. You can lose all of your invested capital.
Past performance is not indicative of future results. The signals generated may produce false or losing trades. The creator (© DotGain) assumes no liability for any financial losses or damages you may incur as a result of using this indicator.
You are solely responsible for your own trading and investment decisions. Always conduct your own research (DYOR) and consider your personal risk tolerance before making any trades.

Smart RSI MTF [DotGain]Summary
Are you tired of constantly switching between timeframes to check the RSI, only to miss the bigger picture?
The Smart RSI MTF (Multi-Timeframe) is designed to solve this exact problem. It is a streamlined chart overlay that monitors RSI conditions across up to 10 different timeframes simultaneously —from the 1-minute chart all the way up to the Monthly view.
This indicator removes the need for multiple open tabs and declutters your analysis by plotting signals directly on your main chart using a smart "visual hierarchy" system based on transparency.
⚙️ Core Components and Logic
The Smart RSI MTF relies on a sophisticated 3-layer logic to deliver clear, actionable context:
Multi-Timeframe Engine: The script runs 10 independent RSI calculations in the background. It checks standard intervals (5m, 15m, 1h, 4h, Daily, Weekly, Monthly) to ensure you never miss a momentum extreme on any scale.
Classic RSI Thresholds:
Overbought (> 70): Indicates price may be extended to the upside.
Oversold (< 30): Indicates price may be extended to the downside.
Smart Visibility System (The "Secret Sauce"): Not all signals are equal. A 5-minute Overbought signal is "noise" compared to a Weekly Overbought signal. This indicator automatically applies Transparency to differentiate importance:
Minutes = High Transparency (Faint).
Hours = Medium Transparency.
Days/Weeks/Months = No Transparency (Solid/Bold).
🚦 How to Read the Indicator
The indicator plots shapes (Labels by default) directly above or below the candles. The appearance tells you the direction and the timeframe significance:
🟥 RED SIGNALS (Overbought Condition)
Trigger: RSI is above 70 on a specific timeframe.
Location: Placed above the candle bar.
Meaning: Potential bearish reversal or pullback.
🟩 GREEN SIGNALS (Oversold Condition)
Trigger: RSI is below 30 on a specific timeframe.
Location: Placed below the candle bar.
Meaning: Potential bullish reversal or bounce.
👻 TRANSPARENCY (Signal Strength)
Faint/Ghostly: The signal comes from a lower timeframe (e.g., 5m, 15m). Use for scalping or entry timing.
Solid/Bright: The signal comes from a major timeframe (e.g., Daily, Weekly). Use for swing trading and identifying major market turns.
Visual Elements
Symbol Shapes: Fully customizable (Label, Diamond, Circle, Triangle, etc.) via settings.
Stacking: If multiple timeframes trigger at once, symbols will overlay, creating a visually denser and darker color, indicating Confluence .
Key Benefit
The goal of the Smart RSI MTF is to help traders instantly spot Confluence . When you see a faint short-term signal align with a solid long-term signal, you have identified a high-probability reversal zone without leaving your chart.
Have fun :)
Disclaimer
This "Smart RSI MTF" indicator is provided for informational and educational purposes only. It does not, and should not be construed as, financial, investment, or trading advice.
The signals generated by this tool (both "Buy" and "Sell" indications) are the result of a specific set of algorithmic conditions. They are not a direct recommendation to buy or sell any asset. All trading and investing in financial markets involves substantial risk of loss. You can lose all of your invested capital.
Past performance is not indicative of future results. The signals generated may produce false or losing trades. The creator (© DotGain) assumes no liability for any financial losses or damages you may incur as a result of using this indicator.
You are solely responsible for your own trading and investment decisions. Always conduct your own research (DYOR) and consider your personal risk tolerance before making any trades.

Volume Weighted Average Price AdvancedVWAP (Advanced) with Multi‑Venue Aggregation and Historical Value Areas
Core: Anchored VWAP with configurable anchor (session/week/month/quarter/year/decade/century or corporate events), offset, and up to three standard-deviation bands.
Multi‑Venue Aggregation: Optionally pull price/volume from up to 5 additional exchanges/symbols (pair-matched by default). VWAP/σ are computed on the aggregated price*volume.
Value Area Blocks: Each completed anchor draws a block from the chosen basis (±1σ or ±2σ) or an optional percentile-based range (default 20–80%). Blocks project to the exact next anchor boundary, or you can extend them to the latest bar. Prior-period VWAP lines are shown inside the blocks.
Volume Gate: Optionally skip drawing prior blocks when the anchor’s aggregated volume is below a median/mean baseline times a multiplier.
HTF Context: Optional higher-timeframe VWAP overlay; can filter the current VWAP/bands so they only show when aligned with the HTF VWAP.
Venue Health: Label shows how many extra venues were included (non‑na) and median venue volume; flags divergence when primary volume is below venue median × threshold.
Alerts: Price in current value area (VWAP ±1σ) and price crossing the most recent prior VWAP.
Styling: Bands and fills are minimal; HTF VWAP is a distinct line; value-area blocks are shaded with prior VWAP lines inside.
Configure via the grouped inputs: VWAP Settings, Additional Exchange Sources, Historical Value Areas, HTF Context, and Bands Settings.

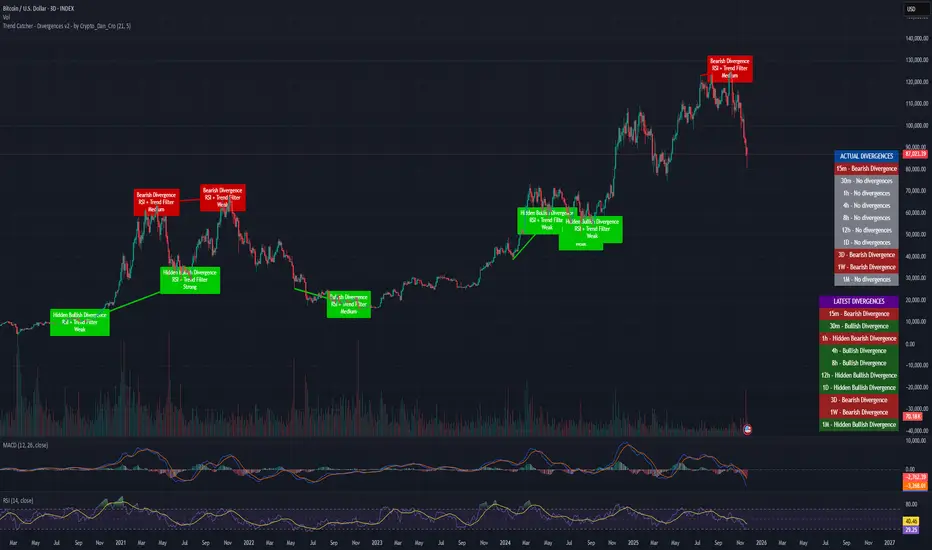
Trend Catcher - Divergences v2 - by Crypto_Dan_CroIf you want to get this indicator, contact me on
X handle: @crypto_dan_cro
What is Trend Catcher - Divergences v2?
It's advanced TradingView indicator designed to automatically detect and visualize divergences between price action and the RSI indicator, enhanced with smart filtering and visual strength analysis.
This tool helps traders identify potential trend reversals, continuation opportunities, and areas of weakening momentum with high clarity and precision.
Key Features
Automatic Detection of Divergences:
- Bullish divergence
- Bearish divergence
- Hidden bullish divergence
- Hidden bearish divergence
Overlap Prevention System
When bullish and bearish divergences occur in the same zone, the script intelligently prioritizes the stronger and more reliable signal to avoid confusion and clutter.
Visual Chart Rendering
Each divergence is displayed with:
- A line connecting key swing points
- A label showing: Divergence type, Active confirmation filter, Signal strength (Weak / Medium / Strong / Extreme)
Divergence Strength Heatmap
The indicator includes a Heatmap system that visually represents divergence strength using color intensity:
- Weak divergences appear lighter and more transparent
- Strong divergences appear bold and highly visible
Strength Classification Levels
Every divergence is categorized into one of four levels: Weak, Medium, Strong, Extreme
Confirmation Filters
- RSI + Trend Filter (recommended)
- RSI + MACD
- RSI + OBV
- MACD + Price Action
Multi-Timeframe Information Panels
ACTUAL DIVERGENCES
Displays currently active divergences across timeframes
LATEST DIVERGENCES
Shows the most recent divergence detected on each timeframe
Included timeframes:
15m, 30m, 1h, 4h, 8h, 12h, 1D, 3D, 1W, 1M
Ideal Use Cases
This indicator is perfect for:
- Swing trading
- Identifying reversal zones
- Momentum exhaustion detection
- Supporting price action strategies
- Trend confirmation and filtering
Trend Catcher – Divergences v2 provides a powerful yet clear approach to divergence trading by combining:
- Smart logic
- Visual clarity
- Strenght analysis
- Reliable filtering
It is built for traders who want precision, clarity, and confidence when trading divergences.
Crypto markets are volatile, if you choose to use this indicator for trading, you are doing it on your own. Crypto_dan_cro is not responsible for any profits or losses created by using this Indicator.
Stochastic Pro+ Suite📚 What Is the Stochastic Oscillator?
The stochastic oscillator is a momentum indicator comparing a security's closing price to its price range over a set number of periods. The %K line represents the raw stochastic value, while the %D line is a smoothed moving average of %K.
Stochastic helps identify:
Overbought and oversold conditions
Bullish and bearish crossovers
Momentum shifts before price reversals
It is widely used in both trending and ranging markets.
💡 What Makes This Suite Different?
This script supercharges the traditional stochastic with a multi-timeframe engine , divergence detection , and a highly customizable visual suite , including:
✅ Core Features:
- Multi-Timeframe (%K, %D, Spread): Pulls stochastic data from any higher timeframe for improved signal quality.
- Custom Overbought/Oversold Levels: Fully adjustable OB/OS thresholds (default: 80/20).
- %K-%D Spread Histogram: View the difference between %K and %D visually as a histogram.
- Color-coded Cross Highlights: Optional background shading for key crossover events in OB/OS zones (high probability reversal areas).
🔍 Divergence Detection (Optional):
- Bullish Divergence: Price makes lower lows while %K makes higher lows.
- Bearish Divergence: Price makes higher highs while %K makes lower highs.
- Customizable pivot lookbacks and range filters to control divergence strictness.
- Visual divergence labels plotted directly on the oscillator.
🎛️ Fully Toggleable Visuals:
Show/hide %K, %D, OB/OS lines, spread histogram, background highlight, and divergence — all via simple checkboxes.
🔔 Alerts:
Set alerts for both bullish and bearish divergences — ideal for swing, day, or trend reversal strategies.
⚙️ Use Cases
- Spot exhaustion in overbought/oversold zones
- Confirm or filter entries with divergence signals
- Monitor multiple timeframes without switching charts
- Use as a signal tool in confluence with price action or volume indicators
⚠️ Disclaimer
This tool is for educational and informational purposes only. It does not constitute financial advice, trading advice, or investment guidance. Always do your own research and consult a qualified financial advisor before making trading decisions.

IMS 4H Structural Framework (MA / Pivot / MTF Levels)IMS 4H Structural Framework (MA / Pivot / MTF Levels)
✅ SHORT, COMPLIANT DESCRIPTION (Invite-Only Safe)
Description:
This tool visualizes a 4H Institutional Market Structure (IMS) framework by combining three workflow components into a single structural map—MA-based bias shifts, pivot-derived 4H trendlines, and multi-timeframe (1H/45m) structural levels.
It does not generate signals or performance claims.
The framework is designed purely for visual, discretionary analysis of structural flow, risk context, and higher-timeframe alignment.
Core Components:
• 4H Bias Shift (MA): Highlights directional bias transitions.
• 4H Trendlines (Pivot-Based): Shows structural slopes and reaction zones.
• MTF Levels (1H & 45m): Adds micro-structure inside the 4H box for refinement.
• Caution Zones: Marks potential reaction areas near support/resistance or trendlines.
• Dashboard: Displays bias context and educational guidance only.
Intended Use:
For traders who analyze 4H structural flow and wish to visualize bias, context, and multi-timeframe alignment—not for automation or signals.
________________________________________
✅ SHORT, SAFE DISCLAIMER (Invite-Only Approved)
Disclaimer:
This tool is for educational and informational purposes only.
It does not provide trading signals, financial advice, or performance guarantees.
All decisions remain solely with the user.

Multitimeframe Stochastic RSIIndicator is Combining 4 different timeframe Stochastic RSI and show buy signal when all of them are oversold and sell signal when all of them are overbought.
Default settings are set up for 15 minute timeframe:
K1 - 15M (period = 14)
K2 - 30M (period = 28)
K3 - 1H (period = 56)
K4 - 2H (period = 112)
It indicates top and bottoms of given period.
Its good to use as a confirmation indicator.
Feel free to comment and use it.
Greetings!

MCM By Inner Racers# MCM By Inner Racers - Multi-Timeframe Key Levels & Session Indicator
## 📊 Overview
**MCM (Multi-Timeframe Chart Mapping)** is a comprehensive trading indicator designed for professional traders who need clear visual representation of critical price levels, session ranges, and time-based market structure. This all-in-one tool eliminates chart clutter while providing essential information for ICT, SMC, and institutional trading methodologies.
---
## ✨ Key Features
### 📅 **Previous Daily Levels**
- **Previous Day High (PDH)** - Acts as key resistance/liquidity zone
- **Previous Day Low (PDL)** - Acts as key support/liquidity zone
- **Previous Day Mid (PDM)** - 50% equilibrium level for mean reversion trades
- **Daily Separators** - Vertical lines marking new trading days
### 📆 **Previous Weekly Levels**
- **Previous Week High (PWH)** - Major weekly resistance for swing trading
- **Previous Week Low (PWL)** - Major weekly support for swing trading
- **Previous Week Mid (PWM)** - Weekly equilibrium for higher timeframe bias
- **Weekly Separators** - Vertical lines marking new trading weeks
### 🌅 **True Day Opens (TDO)**
- Displays opening prices at **midnight NY time** for the past 1-10 days
- Each level labeled as "TDO D-0", "TDO D-1", "TDO D-2", etc.
- Critical for tracking institutional reference points and gap trading
- Respects true midnight opens (not session opens)
### 📍 **Weekly Opens**
- **Monday 00:00 Open** - True weekly open at Monday midnight NY time
- **Sunday 17:00 Open** - Forex market open (Sunday 5 PM NY time)
- Essential for understanding weekly bias and manipulation zones
### 🌏 **Trading Session Ranges**
Dynamic session boxes that track real-time high/low ranges:
- **Asian Session** (Default: 20:00-00:00 NY) -
- **London Session** (Default: 02:00-05:00 NY) -
- **New York Session** (Default: 07:00-16:00 NY) -
All session times are **fully customizable** in 15-minute increments.
---
## 🎯 Who Is This For?
✅ **ICT/SMC Traders** - Key levels for market structure, liquidity, and order flow
✅ **Session Traders** - Identifying killzones and optimal entry zones
✅ **Swing Traders** - Previous day/week levels as support/resistance
✅ **Multi-Timeframe Analysts** - Understanding price relationships across timeframes
✅ **Forex & Indices Traders** - NY time-based analysis for institutional moves
---
## 🎨 Full Customization
Every element is fully customizable:
- ✏️ **Colors** - Match your chart theme perfectly
- 📏 **Line Widths** - 1-5 pixels for visibility
- 🎭 **Line Styles** - Solid, Dashed, or Dotted
- 🏷️ **Labels** - Custom text and 5 size options (Tiny to Huge)
- ⏱️ **Session Times** - Adjust to your timezone or broker
- 📐 **Line Extension** - 20-500 bars forward projection
- 👁️ **Toggle Visibility** - Show/hide any feature independently
---
## 🔧 Technical Highlights
- Uses **request.security()** for accurate higher timeframe data
- Implements **lookahead=barmerge.lookahead_on** for non-repainting levels
- All times calculated in **America/New_York timezone** for consistency
- Efficient line management with proper deletion/recreation
- Maximum 500 lines supported for clean chart performance
- Session detection respects broker time differences
---
## 📖 How To Use
### **For Day Traders:**
1. Enable Daily Levels + True Day Opens for intraday structure
2. Use Session Ranges to identify high-probability trading windows
3. Watch for price reactions at PDH/PDL and TDO levels
### **For Swing Traders:**
1. Enable Weekly Levels for higher timeframe bias
2. Use PWH/PWL as major support/resistance zones
3. Monitor Weekly Opens for institutional reference points
### **For Multi-Timeframe Analysis:**
1. Combine Daily + Weekly levels for confluence zones
2. Use Mid levels (50%) for mean reversion opportunities
3. Align session ranges with higher timeframe structure
---
## ⚙️ Setup Tips
- **Timeframe:** Works on all timeframes (recommended: 1m to 1H for intraday)
- **Chart Type:** Overlay indicator - displays directly on price chart
- **Clean Charts:** Toggle off features you don't need for specific strategies
- **Labels:** Turn off labels for cleaner charts, turn on for reference
- **Line Extension:** Adjust based on your screen size and bar count
---
## 🚀 What Makes This Different?
Unlike basic support/resistance indicators, MCM provides:
- ✅ **True NY midnight opens** (not session opens)
- ✅ **Multiple day opens** tracking (not just previous day)
- ✅ **Dynamic session ranges** (not static boxes)
- ✅ **Both true weekly opens** (Monday 00:00 AND Sunday 17:00)
- ✅ **Fully customizable everything** (colors, styles, labels, times)
- ✅ **Non-repainting levels** using proper lookahead settings
- ✅ **All-in-one solution** (no need for multiple indicators)
---
## 📝 Notes
- All times are in **America/New_York timezone** for consistency with institutional trading
- Previous levels update at the start of each new day/week
- Session ranges are calculated dynamically during active sessions
- Lines extend forward for clear visual reference
- Works with any symbol: Forex, Indices, Crypto, Stocks
---
## 🏷️ Tags
`Multi-Timeframe` `Key Levels` `ICT` `Smart Money Concepts` `Sessions` `Previous Day High/Low` `Previous Week High/Low` `Support Resistance` `Institutional Trading` `Order Flow` `Liquidity` `Market Structure`
---
© Inner_Racers
For questions, suggestions, or feedback, please leave a comment below!
**⭐ If you find this indicator helpful, please give it a boost and share with fellow traders!**

Fair Value Gap Pro by Bifrost InstituteFair Value Gap Pro brings institutional-style FVGs to TradingView with the precision and controls traders actually need. It detects clean 3-candle gaps on any higher timeframe, projects them onto your active chart, and overlays precise buy/sell volume ratios so you can judge the quality of a gap at a glance. Everything is customizable—from colors and line styles to tag markers, and volume display—so the tool adapts to your workflow instead of the other way around.
🔭 Multi-Timeframe Engine
Higher Timeframe Detection: Choose any HTF (M5, H1, H4, D1, etc.) and view those gaps on any lower-TF chart
Smart Gap Detection: Strict 3-candle mode ensures only successive bars form gaps—automatically rejects weekend gaps and market closures
Configurable History: Scan back 1-500+ bars with intelligent processing
Extend Until Filled: Gaps dynamically extend forward until price fills them, or use fixed-width mode
Advanced Fill Logic: Fill Rules - Close only, wick only, or close/wick; Fill Depth: TouchAny (immediate edge touch) or TouchMid (requires 50% penetration)
TouchMid Margin: Fine-tune difficulty with -50% to +50% adjustment (e.g., -10% = easier fill at 40% depth)
Weekend Gap Protection: Prevents false fills from market gaps—only real price action counts
📊 HTF-Accurate Volumetrics
True HTF Volume: Uses higher timeframe bar data for accurate volume matching across all chart timeframes
Buy vs Sell Delta: Integrated volume analysis for every FVG shows institutional pressure
Display Formats: Decimal ratios, percentages, or raw values (with K/M/B suffixes)
Volume Modes: Bar Delta (fast & reliable, recommended), Tick Delta (optional, feed-dependent)
Clear "+" (buy) and "–" (sell) prefixes for instant reading
🎨 Fully Customizable Appearance
Color Control: Color pickers for Bullish/Bearish FVG fills & Filled state colors (different from active), Band lines, midlines, and text labels.
Formation and fill tag markers
Line Styling: Color & Width
🔔 Alerts
Toggle formation/fill alerts independently
🏷 Tags
Visual Tags: Show markers - Text / Icon per event type
Icon choices: Circle, Square, Diamond, Star, Up/Down Arrow
Independent colors for formation vs fill tags
Auto-remove "formed" tag when "filled" tag appears
Configurable size and positioning
🧩 Rendering & Fill Display
Triple-Band Display: Upper, mid, and lower boundary lines with configurable styles
Filled Rectangle: Semi-transparent fill between boundaries for clear visualization
Fill State Management: Hide filled gaps completely, or keep them visible with distinct "filled" colors.
"Use Filled Colours" option for easy state identification
Quality Filters: Minimum body size filter (in chart points) to exclude noise from low-volatility periods
⚙️ Quality-of-Life Features
Performance Optimized: Efficient HTF/LTF time mapping with binary search algorithms
Cross-Symbol Compatible: Robust handling across all symbols and data feeds
Sensible Defaults: Works beautifully out of the box—tweak only what you need
Minimal Chart Clutter: Designed to keep critical information visible without overwhelming your workspace
💡 Perfect For
Institutional gap traders who need precision and control
Multi-timeframe analysts requiring HTF context on LTF charts
Volume profile traders seeking buy/sell pressure confirmation
Traders who value clean, professional chart aesthetics
Anyone tired of indicators that force rigid workflows
Fair Value Gap Pro doesn't just show you gaps—it gives you the complete institutional picture with the flexibility to trade your way.

RSI + MACD Multi-Timeframe StrategyThis strategy combines the Relative Strength Index (RSI) from the daily timeframe with the Moving Average Convergence Divergence (MACD) from the 4-hour timeframe to generate precise long entry and exit signals.
The system uses a multi-timeframe approach to align longer-term trend conditions with shorter-term momentum shifts — allowing traders to catch dips with confirmation and exit before reversals.
🧠 Strategy Logic
✅ Long Entry Condition:
- RSI on the daily (1D) timeframe is oversold (below your defined threshold)
- MACD on the 4H timeframe crosses above the signal line
→ A long trade is opened when these two align
✅ Long Exit Condition:
- RSI on the daily timeframe is overbought
- MACD on the 4H timeframe crosses below the signal line
→ The long trade is closed when these two conditions are met
💡 This strategy currently supports long entries only. Short logic can be added if needed.
📊 Indicator Components
🔹 RSI (Relative Strength Index):
- A momentum oscillator that measures the speed and magnitude of price changes.
- Helps identify overbought (potential sell) and oversold (potential buy) conditions.
- Applied on the 1D timeframe (by default) to reflect broader market trend or exhaustion levels.
🔹 MACD (Moving Average Convergence Divergence):
- A trend-following momentum indicator based on moving averages.
- The MACD Line (fast EMA - slow EMA) crossing above the Signal Line indicates bullish momentum.
- Used here on the 4-hour timeframe (by default) for shorter-term momentum confirmation.
🔹 Multi-Timeframe (MTF) Logic:
- Uses request.security() to pull higher timeframe data (1D for RSI, 4H for MACD).
- Ensures no repainting, as it only uses closed candles from the higher timeframe.
- Aligns longer-term signals with shorter-term entries, reducing false signals.
📈 Plotting Options
The script includes a plot selector input allowing you to toggle between:
- RSI Plot (with overbought/oversold lines)
- MACD Plot (MACD line and signal line)
- This helps visualize signal conditions clearly on your chart.
🛠 Customization
- RSI & MACD settings are fully configurable
- RSI and MACD timeframes can be adjusted independently
⚠️ Disclaimer
This strategy is provided for educational and informational purposes only.
It is not financial advice or a recommendation to buy or sell any asset.
Past performance does not guarantee future results. Always test strategies in a simulated environment before live use, and consult with a licensed financial advisor for investment decisions.

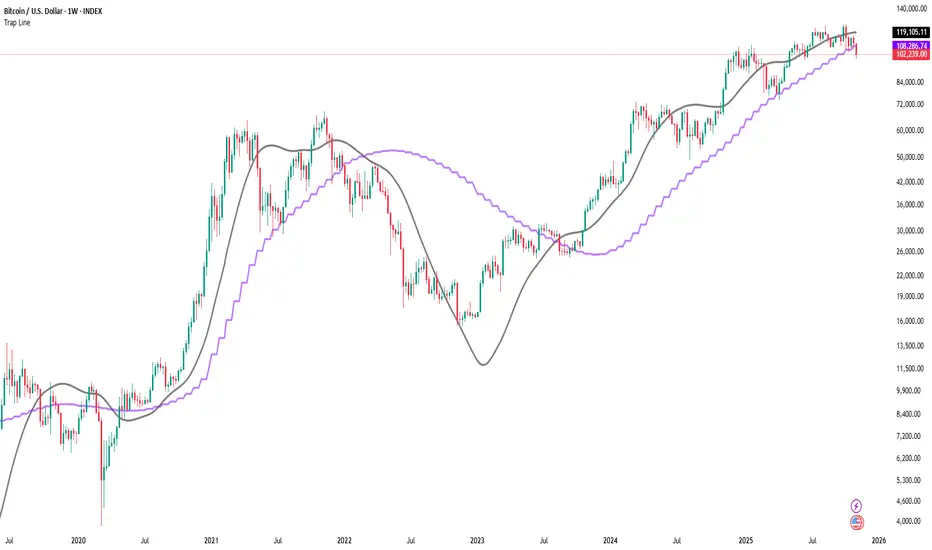
Trap LineOverview
Trap Line is a higher-timeframe trend framework designed to define market regimes using smoothed weekly (1W) and three-week (3W) baselines. Price trading above the line reflects a bullish regime; price below the line reflects a bearish one. The goal is regime discipline—stay aligned with the dominant higher-timeframe direction and avoid late, emotional entries. All parameters are fixed to ensure consistent behavior across symbols.
Core logic (concepts, not full code)
• Computes a Hull-type moving average on 1W and 3W closes (with optional linear-regression pre-filtering) and projects them onto lower timeframes via interpolation.
• Produces a smooth, lag-reduced structural baseline that tracks the weekly trend path.
• Observing price vs. the baseline highlights potential trap zones—temporary breaches that often fail without a confirmed weekly close.
• The 3-Week Trap Line adds a macro confirmation layer and is hidden by default in the Style tab to keep charts clean.
Inputs
• Parameters (length, smoothing type, regression toggle, interpolation mode) are fixed to prevent overfitting and preserve repeatability.
How to read it
• Above the line => bullish regime.
• Below the line => bearish regime.
• A confirmed weekly close through the line suggests a regime transition.
• A weekly close above the line with a green candle supports bullish continuation; a weekly close below the line with a red candle supports bearish continuation.
• Intraweek deviations near the line are often noise and may fade.
Practical use cases
• Weekly bias filter for swing/position frameworks.
• Regime confirmation across related assets or sectors.
• Portfolio overlay: favor long exposure in bullish regimes; reduce risk in bearish regimes.
• Combine with volume or ATR-based tools to assess trend quality.
Best practices
• Wait for the weekly close before declaring regime flips.
• Avoid overreacting to intraweek moves around the baseline.
• Combine with structure analysis (HH/HL vs. LH/LL) and higher-timeframe S/R.
• Use standard time-based candles; avoid interpreting signals on Heikin Ashi, Renko, Kagi, Point & Figure, or Range charts.
Technical notes
• Built on locked higher-timeframe data (1W and 3W).
• Interpolation is used to render HTF structure smoothly on lower charts.
• Non-repainting : values finalize when the higher timeframe closes; lower-TF plotting is interpolated, not forward-looking.
Who it is for
• Traders who want a consistent, rules-based higher-timeframe bias filter.
• Systematic users who prefer fixed-parameter baselines for regime context.
Limitations & disclosures
• Closed-source; educational and analytical use only.
• Not financial advice. Markets involve risk; past performance does not guarantee future results.
Release notes
• Includes the 3-Week Trap Line (3W). It is hidden by default in the Style tab; enable it if you want an additional macro confirmation layer.
• Fixed-parameter design (no user-tweakable inputs) for consistent behavior across symbols.
• Non-repainting values finalize on 1W/3W candle close.
Originality & why closed-source
This is not a reimplementation of public open-source scripts. Trap Line uses a specific combination of higher-timeframe Hull smoothing, optional linear-regression pre-filtering, and lower-timeframe interpolation designed to expose trap zones (temporary regime breaches that often fail without a confirmed weekly close). The integration and thresholds are proprietary and tuned to retain weekly structure with reduced lag. The source is closed to protect this implementation.
Integration, not a mashup
Trap Line is a single, self-contained framework. It does not merely merge other indicators; its components are integrated to produce a unified higher-timeframe baseline (1W/3W) with a defined reading protocol (above/below line, weekly-close confirmation, optional candle-color confirmation).
Indicator, not a strategy
This publication provides an indicator overlay , not a trading strategy. It includes no backtests, position logic, performance claims, or risk assumptions. Use it as an analytical bias filter within your own risk management.
Comparison to common tools
Compared to standard MAs or SuperTrend-style bands, Trap Line prioritizes (1) higher-timeframe structure fidelity, (2) reduced lag via HMA-type smoothing, and (3) explicit weekly-close confirmation to avoid premature regime flips. The optional 3-Week line acts as a macro confirmation layer and is hidden by default in the Style tab.
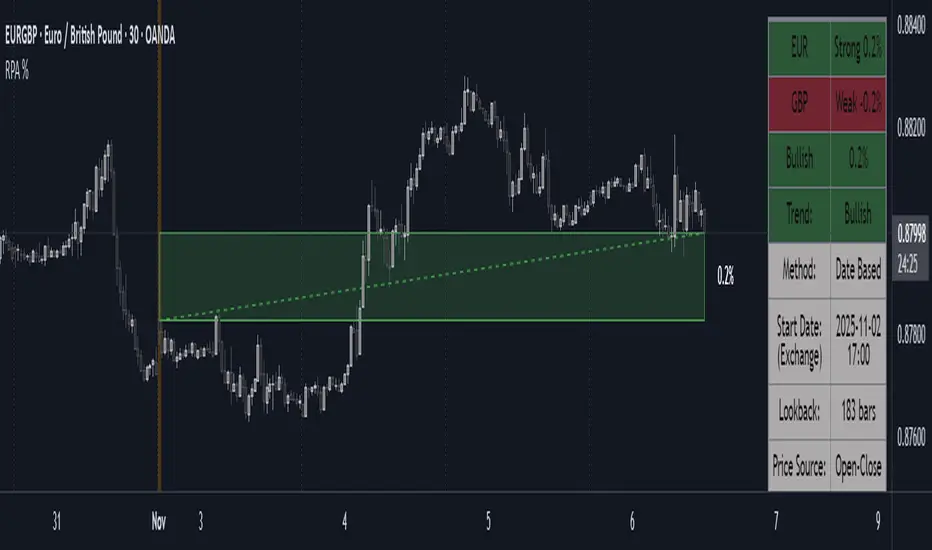
Period Range AnalyzerThis indicator analyzes a specific periodic range, which can start from a fixed date or a defined lookback period. It draws percentage levels and colored zones between the highest and lowest price. It also displays a detailed information table, which shows the price's position within the range in "Trend" mode, and the relative strength of currency pairs in "Forex" mode. The current price position is also indicated by a label with a percentage value and the name of the corresponding zone.
User Guide
Calculation Method
This setting determines how the indicator defines the range used for the calculation.
Lookback Period: In this mode, the indicator uses the last N candles (the number can be specified in the "Lookback Period (bars)" field). The range (the highest and lowest price) is "floating," meaning it is recalculated with each new candle based on the last N candles.
Date Based: In this mode, the calculation starts from a fixed date and time you select. The indicator finds the opening price of the start date and continuously tracks the highest and lowest price from that point on. This mode is ideal for measuring performance from a specific event (e.g., start of a week/month/year, news).
Data Handling Note: If you select a date in "Date Based" mode for which no data is available on the current timeframe (e.g., switching to a very low timeframe), the indicator will automatically use the earliest available candle as the starting point. All calculations (Open, Max, Min, Range, Percentage, Change, Trend) are based on this actual start date.
Start Date & Time
This setting is only active in "Date Based" mode.
Here you can specify the fixed starting point for the calculation.
The specified time is in the Exchange timezone.
Important limitation: Due to TradingView platform limits, visual elements (levels, zones) are only drawn for a maximum of 250 candles back. If the set date is older than this, the calculation still applies to the entire period (from the set date), but the drawing only covers the last 250 candles. The table always displays accurate data for the entire period.
When switching to a higher timeframe, the range may restart from a slightly later bar due to TradingView's bar alignment. For best accuracy, set your timeframe first, then select the start date.
Table Mode
This setting controls what data the information table displays.
Trend: This is the default mode, which works on any symbol (stock, index, crypto, etc.). It displays information related to the trend and the range.
Forex: This is a special mode used to measure the strength of currency and crypto pairs. It only works on symbols with exactly 6 characters (e.g., "EURUSD", "BTCUSD"). It treats the first 3 characters as the base currency (e.g., EUR) and the last 3 as the quote currency (e.g., USD). If the symbol does not have 6 characters, the table will automatically display in "Trend" mode.
Trend
This trend determination operates based on the formation order of the high and low within the analyzed range:
Its switch is located in the “Table Additional Rows” menu.
Bullish: Indicated if the low was formed before the high (on different candles). Or if they formed on the same candle, it was a bullish candle.
Bearish: Indicated if the high was formed before the low (on different candles). Or if they formed on the same candle, it was a bearish candle.
Neutral: Indicated if the high and low formed on the same candle, and it was a "doji" candle (close = open).
Upper & Lower Threshold
These settings (Upper Threshold (%) and Lower Threshold (%) in the "Label Coloring" section) primarily determine the state (Bullish/Bearish/Neutral) of the top row of the table.
The logic is not based on the percentage change of the price movement, but on the current price's position within the range, where the bottom of the range is 0% and the top is 100%.
Upper Threshold (%): The percentage level (e.g., 60.0) above which the indicator considers the price position "Bullish" (or "Strong").
Lower Threshold (%): The percentage level (e.g., 40.0) below which the indicator considers the price position "Bearish" (or "Weak").
If the price is between the two (e.g., between 40% and 60%), the signal is Neutral.
Secondary function: These thresholds also control the color of the label next to the price, provided the "Dynamic Label Coloring" option is enabled.

Range Percentage Analyzer This indicator is a tool for analyzing the market range and trend. It calculates the extent of price movement between a specified starting point and the current price, displaying it as a percentage.
The calculation can be based on a fixed lookback period (e.g., the last 30 candles) or from a fixed start date. It also provides a clear table that shows the general trend in "Trend" mode, and the relative strength of the base and quote currencies of forex pairs (e.g., EURUSD) in "Forex" mode.
User Guide
Calculation Method
This setting determines how the indicator defines the starting point for the calculation.
Lookback Period: In this mode, the indicator uses the last N candles (the number can be specified in the "Lookback Period (bars)" field, maximum 250).
The starting point is "floating," meaning it shifts with each new candle. For example, with a setting of 30, the 30th candle from the current one will always be the starting point.
Date Based: In this mode, the calculation starts from a fixed date and time you select.
This mode is ideal for measuring performance from a specific event (e.g., news, start of a week/month).
Note: If you select a date in "Date Based" mode for which no data is available on the current timeframe (e.g., switching to a very low timeframe), the indicator will automatically use the earliest available candle as the starting point.
Start Date & Time
This setting is only active in "Date Based" mode.
Here you can specify the fixed starting point for the calculation.
The specified time is in the Exchange timezone.
Important limitation: Due to TradingView platform limits, visual elements (box, line) are only drawn for a maximum of 250 candles back.
If the set date is older than this, the calculation still applies to the entire period (from the set date), but the drawing only covers the last 250 candles.
When switching to a higher timeframe, the range may restart from a slightly later bar due to TradingView's bar alignment. For best accuracy, set your timeframe first, then select the start date.
Table Mode
This setting controls what data the information table displays.
Trend: This is the default mode, which works on any symbol (stock, index, crypto, etc.). It displays information related to the trend.
Forex: This is a special mode used to measure the strength of currency pairs.
It only works on symbols with exactly 6 characters (e.g., "EURUSD", "BTCUSD"). It treats the first 3 characters as the base currency (e.g., EUR) and the last 3 as the quote currency (e.g., USD).
If the symbol does not have 6 characters, the table will automatically display in "Trend" mode.
Extremes Trend Row
If this is enabled, the table displays an additional row that determines the trend based on the formation order of the high and low within the analyzed range.
The logic is as follows:
Bullish: Indicated if the low was formed before the high.
(Or if they formed on the same candle, which was a bullish candle).
Bearish: Indicated if the high was formed before the low.
(Or if they formed on the same candle, which was a bearish candle).
Neutral: Indicated if the high and low formed on the same candle, and it was a "doji" candle (close = open).
Upper & Lower Threshold
These settings control the logic for the "Change Trend" and "Forex Display" rows at the top of the table.
They determine when the total percentage change for the entire period is considered "Bullish/Strong", "Bearish/Weak", or "Neutral".
Upper Threshold (%): The percentage value (default 0.1%) above which the indicator considers the change "Bullish/Strong".
Lower Threshold (%): The percentage value (default -0.1%) below which the indicator considers the change "Bearish/Weak".
If the change is between the two, the signal is Neutral.
ZynAlgo Trend MiniZynAlgo Trend Mini — Multi-Timeframe Trend Scanner & Compact Table UI
What this indicator does
ZynAlgo Trend Dashboard Mini scans up to five user-selected timeframes and summarizes the trend state for each, using one of three signal modes: MA Cross, Price vs MA, or RSI. It then aggregates these per-timeframe signals into an Overall Trend line and optionally shows a score count (bull/bear/neutral). A compact table dashboard renders in the corner you choose, with multiple themes or fully custom colors.
How it works (conceptual)
1) Per-timeframe signal
Choose a Signal Mode for classification:
MA Cross — compares fast vs. slow MA. If % distance exceeds Neutral Zone %, it’s Bullish/Bearish; otherwise Neutral.
Price vs MA — compares price to a single MA; % deviation beyond Neutral Zone is Bullish/Bearish; within it is Neutral.
RSI — RSI above Bullish Level ⇒ Bullish; below Bearish Level ⇒ Bearish; between the two ⇒ Neutral.
Supported MA types: EMA/SMA/HMA/WMA; lengths and thresholds are user-defined.
2) Multi-timeframe aggregation
The script counts Bullish/Bearish/Neutral outcomes across enabled TFs, then sets Overall Trend by majority (ties → Neutral). Optional score text shows the counts.
3) Dashboard rendering
Three display modes: Detailed, Compact, Minimal. You can position the panel in common corners/center and toggle title, overall row, and score.
Inputs (with tooltip-style guidance)
⏰ Timeframes
Enable Timeframe 1–5 / Timeframe 1–5 — turn on specific TFs (e.g., 5 / 15 / 60 / 240 / D). Tip: “Only enabled TFs are counted in the overall trend.”
📊 Signal Settings
Signal Mode (MA Cross / Price vs MA / RSI) — “Pick how each TF is classified.”
MA Type / Fast MA Length / Slow MA Length — “Used by MA Cross and Price vs MA; shorter fast MA reacts quicker; longer slow MA smooths noise.”
RSI Length / Bullish Level / Bearish Level — “Used by RSI mode; levels define bullish/bearish thresholds.”
Neutral Zone % — “Dead-band around 0% for MA-based modes; inside the band = Neutral.”
🎨 Display
Display Mode (Detailed / Compact / Minimal) — “Switch between full rows, condensed line, or icon-only view.”
Position — “Choose a chart corner/center for the panel.”
Show Overall Trend / Show Score Count / Show Dashboard Title — “Toggle the overall line, counts, and title.”
📝 Text & Size
Dashboard Title / Text Size / Timeframe Text Size — “Set panel title and font sizes independently.”
🎨 Theme & Colors
Color Theme — presets: Dark Neon / Dark Professional / Light Modern / Light Classic / Cyberpunk / Matrix / Custom. Tip: “Pick a preset; choose Custom to define every color.”
Custom Colors (active when Theme=Custom) — border/background/header/row/text/title/TF label and bull/bear/neutral colors.
🧱 Border & Background
Border Width — “0 hides the frame; higher values increase panel emphasis.”
Alternate Row — “Subtle row striping for readability.” (enabled in code)
🔔 Alerts
Enable Alerts — “Master on/off for the four prebuilt alerts.”
Using the indicator (suggested workflow)
Choose timeframes (e.g., M5/M15/H1/H4/D1). Disable any you don’t want counted.
Select a signal model that fits your playbook (MA Cross, Price vs MA, or RSI), then set MA/RSI lengths and the Neutral Zone %.
Pick a display mode & position. Toggle Overall Trend, Score Count, and Title as needed.
Style with a theme (or Custom colors) for readability on your chart background.
(Optional) Alerts: enable and then create alerts for unanimous or majority trends (see list below).
Reading the dashboard
Per-TF cells/icons: color and text show the state (BULLISH / BEARISH / NEUTRAL).
Overall Trend row: majority summary with ▲ / ▼ / ● icon; optional score shows counts (Bull/Bear/Neutral).
Built-in alert conditions
All Timeframes Bullish — every enabled TF is Bullish (requires ≥3 enabled).
All Timeframes Bearish — every enabled TF is Bearish (requires ≥3 enabled).
Majority Bullish — majority Bullish and Overall Trend = Bullish.
Majority Bearish — majority Bearish and Overall Trend = Bearish.
Hidden plots for Overall/Bull/Bear counts are available for alert logic/custom uses.
Three interchangeable models in one panel (MA Cross, Price-Deviation, RSI) → one UI, multiple perspectives.
Flexible aggregation that adapts to enabled TFs only (disabled TFs are excluded cleanly).
Compact, themeable UI with Detailed/Compact/Minimal layouts and corner/center anchoring — designed for clarity on busy charts.
Bar-confirmed calculations via request.security (no forward-looking values used in the logic described).
Lightweight implementation (table rendering and per-bar updates gated on barstate.islast) to minimize overhead in common workflows.
🔶 RISK DISCLAIMER
Trading is risky & most day traders lose money. All content, tools, scripts, articles, & education provided by ZynAlgo are purely for informational & educational purposes only. Past performance does not guarantee future results.

Smart Money Flow Index (SMFI) - Advanced SMC [PhenLabs]📊Smart Money Flow Index (SMFI)
Version: PineScript™v6
📌Description
The Smart Money Flow Index (SMFI) is an advanced Smart Money Concepts implementation that tracks institutional trading behavior through multi-dimensional analysis. This comprehensive indicator combines volume-validated Order Block detection, Fair Value Gap identification with auto-mitigation tracking, dynamic Liquidity Zone mapping, and Break of Structure/Change of Character detection into a unified system.
Unlike basic SMC indicators, SMFI employs a proprietary scoring algorithm that weighs five critical factors: Order Block strength (validated by volume), Fair Value Gap size and recency, proximity to Liquidity Zones, market structure alignment (BOS/CHoCH), and multi-timeframe confluence. This produces a Smart Money Score (0-100) where readings above 70 represent optimal institutional setup conditions.
🚀Points of Innovation
Volume-Validated Order Block Detection – Only displays Order Blocks when formation candle exceeds customizable volume multiplier (default 1.5x average), filtering weak zones and highlighting true institutional accumulation/distribution
Auto-Mitigation Tracking System – Fair Value Gaps and Order Blocks automatically update status when price mitigates them, with visual distinction between active and filled zones preventing trades on dead levels
Proprietary Smart Money Score Algorithm – Combines weighted factors (OB strength 25%, FVG proximity 20%, Liquidity 20%, Structure 20%, MTF 15%) into single 0-100 confidence rating updating in real-time
ATR-Based Adaptive Calculations – All distance measurements use 14-period Average True Range ensuring consistent function across any instrument, timeframe, or volatility regime without manual recalibration
Dynamic Age Filtering – Automatically removes liquidity levels and FVGs older than configurable thresholds preventing chart clutter while maintaining relevant levels
Multi-Timeframe Confluence Integration – Analyzes higher timeframe bias with customizable multipliers (2-10x) and incorporates HTF trend direction into Smart Money Score for institutional alignment
🔧Core Components
Order Block Engine – Detects institutional supply/demand zones using characteristic patterns (down-move-then-strong-up for bullish, up-move-then-strong-down for bearish) with minimum volume threshold validation, tracks mitigation when price closes through zones
Fair Value Gap Scanner – Identifies price imbalances where current candle's low/high leaves gap with two-candle-prior high/low, filters by minimum size percentage, monitors 50% fill for mitigation status
Liquidity Zone Mapper – Uses pivot high/low detection with configurable lookback to mark swing points where stop losses cluster, extends horizontal lines to visualize sweep targets, manages lifecycle through age-based removal
Market Structure Analyzer – Tracks pivot progression to identify trend through higher-highs/higher-lows (bullish) or lower-highs/lower-lows (bearish), detects Break of Structure and Change of Character for trend/reversal confirmation
Scoring Calculation Engine – Evaluates proximity to nearest Order Blocks using ATR-normalized distance, assesses FVG recency and distance, calculates liquidity proximity with age weighting, combines structure bias and MTF trend into smoothed final score
🔥Key Features
Customizable Display Limits – Control maximum Order Blocks (1-10), Liquidity Zones (1-10), and FVG age (10-200 bars) to maintain clean charts focused on most relevant institutional levels
Gradient Strength Visualization – All zones render with transparency-adjustable coloring where stronger/newer zones appear more solid and weaker/older zones fade progressively providing instant visual hierarchy
Educational Label System – Optional labels identify each zone type (Bullish OB, Bearish OB, Bullish FVG, Bearish FVG, BOS) with color-coded text helping traders learn SMC concepts through practical application
Real-Time Smart Money Score Dashboard – Top-right table displays current score (0-100) with color coding (green >70, yellow 30-70, red <30) plus trend arrow for at-a-glance confidence assessment
Comprehensive Alert Suite – Configurable notifications for Order Block formation, Fair Value Gap detection, Break of Structure events, Change of Character signals, and high Smart Money Score readings (>70)
Buy/Sell Signal Integration – Automatically plots triangle markers when Smart Money Score exceeds 70 with aligned market structure and fresh Order Block detection providing clear entry signals
🎨Visualization
Order Block Boxes – Shaded rectangles extend from formation bar spanning high-to-low of institutional candle, bullish zones in green, bearish in red, with customizable transparency (80-98%)
Fair Value Gap Zones – Rectangular areas marking imbalances, active FVGs display in bright colors with adjustable transparency, mitigated FVGs switch to gray preventing trades on filled zones
Liquidity Level Lines – Dashed horizontal lines extend from pivot creation points, swing highs in bearish color (short targets above), swing lows in bullish color (long targets below), opacity decreases with age
Structure Labels – "BOS" labels appear above/below price when Break of Structure confirmed, colored by direction (green bullish, red bearish), positioned at 1% beyond highs/lows for visibility
Educational Info Panel – Bottom-right table explains key terminology (OB, FVG, BOS, CHoCH) and score interpretation (>70 high probability) with semi-transparent background for readability
📖Usage Guidelines
General Settings
Show Order Blocks – Default: On, toggles visibility of institutional supply/demand zones, disable when focusing solely on FVGs or Liquidity
Show Fair Value Gaps – Default: On, controls FVG zone display including active and mitigated imbalances
Show Liquidity Zones – Default: On, manages liquidity line visibility, disable on lower timeframes to reduce clutter
Show Market Structure – Default: On, toggles BOS/CHoCH label display
Show Smart Money Score – Default: On, controls score dashboard visibility
Order Block Settings
OB Lookback Period – Default: 20, Range: 5-100, controls bars scanned for Order Block patterns, lower values detect recent activity, higher values find older blocks
Min Volume Multiplier – Default: 1.5, Range: 1.0-5.0, sets minimum volume threshold as multiple of 20-period average, higher values (2.0+) filter for strongest institutional candles
Max Order Blocks to Display – Default: 3, Range: 1-10, limits simultaneous Order Blocks shown, lower settings (1-3) maintain focus on most recent zones
Fair Value Gap Settings
Min FVG Size (%) – Default: 0.3, Range: 0.1-2.0, defines minimum gap size as percentage of close price, lower values detect micro-imbalances, higher values focus on significant gaps
Max FVG Age (bars) – Default: 50, Range: 10-200, removes FVGs older than specified bars, lower settings (10-30) for scalping, higher (100-200) for swing trading
Show FVG Mitigation – Default: On, displays filled FVGs in gray providing visual history, disable to show only active untouched imbalances
Liquidity Zone Settings
Liquidity Lookback – Default: 50, Range: 20-200, sets pivot detection period for swing highs/lows, lower values (20-50) mark shorter-term liquidity, higher (100-200) identify major swings
Max Liquidity Age (bars) – Default: 100, Range: 20-500, removes liquidity lines older than specified bars, adjust based on timeframe
Liquidity Sensitivity – Default: 0.5, Range: 0.1-1.0, controls pivot detection sensitivity, lower values mark only major swings, higher values identify minor swings
Max Liquidity Zones to Display – Default: 3, Range: 1-10, limits total liquidity levels shown maintaining chart clarity
Market Structure Settings
Pivot Length – Default: 5, Range: 3-15, defines bars to left/right for pivot validation, lower values (3-5) create sensitive structure breaks, higher (10-15) filter for major shifts
Min Structure Move (%) – Default: 1.0, Range: 0.1-5.0, sets minimum percentage move required between pivots to confirm structure change
Multi-Timeframe Settings
Enable MTF Analysis – Default: On, activates higher timeframe trend analysis incorporation into Smart Money Score
Higher Timeframe Multiplier – Default: 4, Range: 2-10, multiplies current timeframe to determine analysis timeframe (4x on 15min = 1hour)
Visual Settings
Bullish Color – Default: Green (#089981), sets color for bullish Order Blocks, FVGs, and structure elements
Bearish Color – Default: Red (#f23645), defines color for bearish elements
Neutral Color – Default: Gray (#787b86), controls color of mitigated zones and neutral elements
Show Educational Labels – Default: On, displays text labels on zones identifying type (OB, FVG, BOS), disable once familiar with patterns
Order Block Transparency – Default: 92, Range: 80-98, controls Order Block box transparency
FVG Transparency – Default: 92, Range: 80-98, sets Fair Value Gap zone transparency independently from Order Blocks
Alert Settings
Alert on Order Block Formation – Default: On, triggers notification when new volume-validated Order Block detected
Alert on FVG Formation – Default: On, sends alert when Fair Value Gap appears enabling quick response to imbalances
Alert on Break of Structure – Default: On, notifies when BOS or CHoCH confirmed
Alert on High Smart Money Score – Default: On, alerts when Smart Money Score crosses above 70 threshold indicating high-probability setup
✅Best Use Cases
Order Block Retest Entries – After Break of Structure, wait for price retrace into fresh bullish Order Block with Smart Money Score >70, enter long on zone reaction targeting next liquidity level
Fair Value Gap Retracement Trading – When price creates FVG during strong move then retraces, enter as price approaches unfilled gap expecting institutional orders to continue trend
Liquidity Sweep Reversals – Monitor price approaching swing high/low liquidity zones against prevailing Smart Money Score trend, after stop hunt sweep watch for rejection into premium Order Block/FVG
Multi-Timeframe Confluence Setups – Identify alignment when current timeframe Order Block coincides with higher timeframe FVG plus MTF analysis showing matching trend bias
Break of Structure Continuations – After BOS confirms trend direction, trade pullbacks to nearest Order Block or FVG in direction of structure break using Smart Money Score >70 as entry filter
Change of Character Reversal Plays – When CHoCH detected indicating potential reversal, look for Smart Money Score pivot with opposing Order Block formation then enter on structure confirmation
⚠️Limitations
Lagging Pivot Calculations – Pivot-based features (Liquidity Zones, Market Structure) require bars to right of pivot for confirmation, meaning these elements identify levels retrospectively with delay equal to lookback period
Whipsaw in Ranging Markets – During choppy conditions, Order Blocks fail frequently and structure breaks produce false signals as Smart Money Score fluctuates without clear institutional bias, best used in trending markets
Volume Data Dependency – Order Block volume validation requires accurate volume data which may be incomplete on Forex pairs or limited in crypto exchange feeds
Subjectivity in Scoring Weights – Proprietary 25-20-20-20-15 weighting reflects general institutional behavior but may not optimize for specific instruments or market regimes, user cannot adjust factor weights
Visual Complexity on Lower Timeframes – Sub-hour timeframes generate excessive zones creating cluttered charts, requires aggressive display limit reduction and higher minimum thresholds
No Fundamental Integration – Indicator analyzes purely technical price action and volume without incorporating economic events, news catalysts, or fundamental shifts that override technical levels
💡What Makes This Unique
Unified SMC Ecosystem – Unlike indicators displaying Order Blocks OR FVGs OR Liquidity separately, SMFI combines all three institutional concepts plus market structure into single cohesive system
Proprietary Confidence Scoring – Rather than manual setup assessment, automated Smart Money Score quantifies probability by weighting five institutional dimensions into actionable 0-100 rating
Volume-Filtered Quality – Eliminates weak Order Blocks forming without institutional volume confirmation, ensuring displayed zones represent genuine accumulation/distribution
Adaptive Lifecycle Management – Automatically updates mitigation status and removes aged zones preventing trades on dead levels through continuous validity and age monitoring
Educational Integration – Built-in tooltips, labeled zones, and reference panel make indicator functional for both learning Smart Money Concepts and executing strategies
🔬How It Works
Order Block Detection – Scans for patterns where strong directional move follows counter-move creating last down-candle before rally (bullish OB) or last up-candle before sell-off (bearish OB), validates formations only when candle exhibits volume exceeding configurable multiple (default 1.5x) of 20-bar average volume
Fair Value Gap Identification – Compares current candle’s high/low against two-candles-prior low/high to detect price imbalances, calculates gap size as percentage of close and filters micro-gaps below minimum threshold (default 0.3%), monitors whether subsequent price fills 50% triggering mitigation status
Liquidity Zone Mapping – Employs pivot detection using configurable lookback (default 50 bars) to identify swing highs/lows where retail stops cluster, extends horizontal reference lines from pivot creation and applies age-based filtering to remove stale zones
Market Structure Analysis – Tracks pivot progression using structure-specific lookback (default 5 bars) to determine trend, confirms uptrend when new pivot high exceeds previous by minimum move percentage, detects Break of Structure when price breaks recent pivot level, flags Change of Character for potential reversals
Multi-Timeframe Confluence – When enabled, requests security data from higher timeframe (current TF × HTF multiplier, default 4x), compares HTF close against HTF 20-period MA to determine bias, contributes ±50 points to score ensuring alignment with institutional positioning on superior timeframe
Smart Money Score Calculation – Evaluates Order Block component via ATR-normalized distance producing max 100-point contribution weighted at 25%, assesses FVG factor through age penalty and distance at 20% weight, calculates Liquidity proximity at 20%, incorporates structure bias (±50-100 points) at 20%, adds MTF component at 15%, applies 3-period smoothing to reduce volatility
Visual Rendering and Lifecycle – Draws Order Block boxes, Fair Value Gap rectangles with color coding (green/red active, gray mitigated), extends liquidity dashed lines with fade-by-age opacity, plots BOS labels, displays Smart Money Score dashboard, continuously updates checking mitigation conditions and removing elements exceeding age/display limits
💡Note:
The Smart Money Flow Index combines multiple Smart Money Concepts into unified institutional order flow analysis. For optimal results, use the Smart Money Score as confluence filter rather than standalone entry signal – scores above 70 indicate high-probability setups but should be combined with risk management, higher timeframe bias, and market regime understanding.

ZenAlgo - BoxerThis indicator plots multi-period Volume-Weighted Average Price (VWAP) ranges and deviation bands across several timeframes — specifically weekly, monthly, quarterly, semi-annual, and yearly. It is designed to visualize how price evolves relative to statistically weighted value areas within each period, based on both traded price and volume distribution.
Each timeframe layer is drawn independently, using its own cumulative VWAP and standard deviation calculation, and displayed as horizontal ranges aligned precisely with calendar periods. This structure allows the chart to show where price currently trades relative to past value zones and how each higher-timeframe VWAP acts as a dynamic reference for mean reversion or continuation.
Calculation Logic
1. Source and Base Inputs
The indicator uses the average of high, low, and close as its price source.
Stocks reset daily at session open.
2. VWAP and Deviation Computation
For each active timeframe, it accumulates the product of price and volume and divides it by cumulative volume, forming a continuously updated VWAP within that period.
The dispersion of price around VWAP is measured through a volume-weighted variance, converted to standard deviation.
These values form symmetrical bands around the VWAP (±1σ, ±2σ, etc.), describing the statistically typical price spread.
3. Range Drawing and Persistence
When a new period begins (e.g., a new week or month), the script finalizes the previous VWAP and deviation values, fixes them to time coordinates representing the full duration of that completed period, and draws corresponding lines or boxes across the entire range.
The user can control how many historical periods remain visible, ensuring performance and clarity even on high-frequency charts.
Each band can be toggled independently (for example ±1, ±2, ±3 deviations), and colors are adjustable per timeframe.
4. Adaptive Time Anchors
The start of each timeframe is aligned with calendar boundaries.
For stocks, the start time aligns with 9:30 New York time to coincide with market open for NYSE.
Each new anchor triggers a reset of cumulative data and creation of a new VWAP range.
5. Visualization Structure
The weekly layer is drawn first and can optionally display live VWAP bands extending backward for a user-defined number of weeks.
Monthly, quarterly, semi-annual, and yearly layers use the same computation principle but with independent accumulation windows.
The central VWAP line is dashed, while outer deviation levels are drawn as dotted or solid lines depending on their multiplier.
Boxes are rendered for key deviation intervals (e.g., ±2σ) to highlight broader value zones.
Interpretation
The VWAP represents the mean price weighted by traded volume for the given period.
Deviation bands describe statistically typical distance from that mean; outer bands mark less frequent extremes.
When price remains within ±1σ or ±2σ, it suggests balance around fair value.
Repeated touches or breaks beyond outer deviations indicate expansion or compression of volatility relative to prior periods.
Overlaps of VWAPs from multiple timeframes reveal multi-period confluence zones, useful for observing where long-term and short-term value agree or diverge.
Recommended Timeframes by Range Type
Weekly Range
Recommended timeframe: 30m to 12h
Suggested options: 30m, 1h, 2h, 3h, 4h, 6h, 8h, 12h
Using lower timeframes (like 5m) is technically possible, but higher ones provide smoother visualization and better readability.
Monthly Range
Recommended timeframe: 1h to 1D
Suggested options: 1h, 2h, 3h, 4h, 6h, 8h, 12h, 1D
Lower timeframes such as 30m may not display the full monthly range due to TradingView’s bar limits, so use higher TFs for complete coverage.
Quarterly Range
Recommended timeframe: 4h to 1W
Suggested options: 4h, 6h, 8h, 12h, 1D, 1W
Quarterly ranges benefit from higher timeframes to ensure that enough historical data is visible without exceeding chart limits.
Semi-Annual Range
Recommended timeframe: 12h to 1M
Suggested options: 12h, 1D, 1W, 1M
Lower timeframes would require too many bars to load a full six-month range; higher TFs offer a clearer overview.
Yearly Range
Recommended timeframe: 1D to 1M or higher
Suggested options: 1D, 1W, 1M
Yearly ranges often cannot display correctly on low timeframes (e.g. 1h) because of TradingView’s maximum bar limits — for instance, five years of 1h data exceeds 40,000 bars. Use higher TFs for accurate rendering.
Added Value Compared to Common Free VWAP Indicators
Incorporates five independent timeframes simultaneously (week, month, quarter, half-year, year) with exact calendar anchoring and timezone handling.
Calculates volume-weighted deviation for each layer, maintaining consistent statistical scale across assets.
Provides historical box persistence , allowing comparison of completed VWAP structures instead of only current running lines.
Enables selective visibility, bandwidth control, and precise visual differentiation through adjustable colors and line weights.
Limitations and Notes
The indicator does not generate trading signals. It is purely analytical and descriptive.
On very low timeframes or illiquid assets, deviation values may fluctuate if volume data is inconsistent.
Historical boxes are approximate in length for months with fewer than 31 days; this simplification has negligible effect on interpretation.
High visual density may occur when enabling many deviations or timeframes at once; users should limit visible history for performance.
Best Usage Practices
Apply on intraday charts (5–240 min) to study how price interacts with weekly or higher-timeframe VWAP zones.
Observe convergence of VWAPs from multiple periods to locate significant equilibrium levels.
Use outer deviations to frame potential exhaustion or re-entry zones rather than directional predictions.
Combine with independent volume- or structure-based analysis for context.
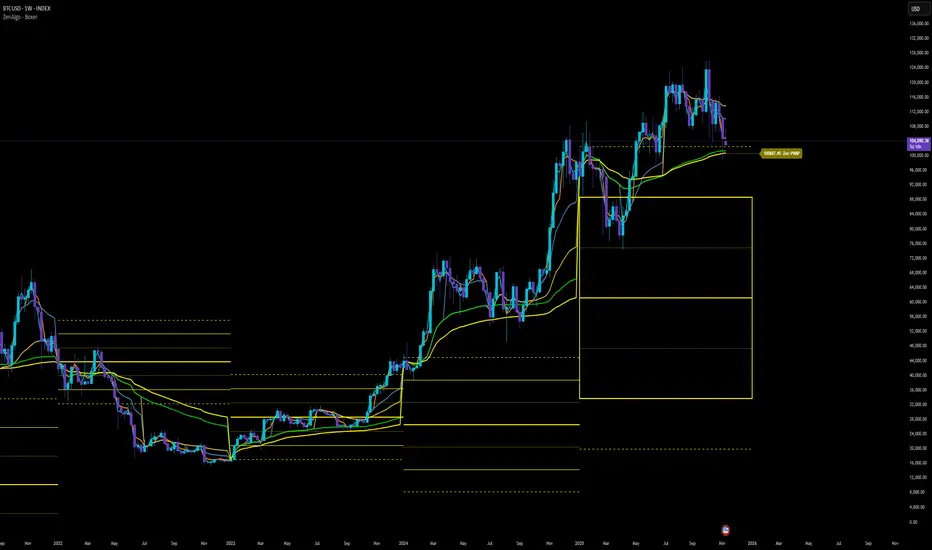
Multi-Period MTF RSI MomentumThis indicator gives multi-period and multi-timeframe RSI momentum.
There are three RSI indicators. Current, Lower and Higher timeframes.
The relative position of different time frame RSIs provide relative momentum indication. Lower timeframe RIS above Higher time frame indicate improving momentum.
If the RSI is above 55 then stay bullish, below 45 bearish and 45-55 is ranging.
There are many strategies you can trade. one is if the high of candle where RSI cross 55 is crossed then buy, or low of the RSI crossng below 45 is broken ten sell etc.

MTF Liquidity Levels Pro (D/W/M) [SmartFoxy]✅ SCRIPT DESCRIPTION (Premium MTF High-Low Levels)
Overview
This indicator automatically plots key High/Low levels across three major timeframes:
Daily (D) , Weekly (W) , and Monthly (M) .
It includes:
• Current period highs/lows (DH/DL, WH/WL, MH/ML);
• Previous period highs/lows (PDH/PDL, PWH/PWL, PMH/PML);
• Open levels (Day Open, Day True Open, Week Open, Month Open);
• Visual elements such as separators, period boxes, labels, and price markers;
• A fully customizable breakout alert system .
The indicator is designed for precise market structure analysis with a focus on liquidity, MTF mechanics, and clean price action.
________________________________________
How It Works
The script tracks historical High/Low levels on each timeframe and displays:
✅ Current High/Low Levels :
Daily;
Weekly;
Monthly.
✅ Previous High/Low levels from the previous day, week, and month:
PDH / PDL;
PWH / PWL;
PMH / PML.
You can select how many previous levels to display (1, 2, 3…).
✅ Open Levels:
Day Open;
Week Open;
Month Open.
Includes optional True Day Open with time offset.
✅ Visual Period Boxes highlighting each session (Day Box, Week Box, Month Box) to help identify intraday and intraperiod structure.
✅ Vertical Separators for the start of each day, week, and month.
✅ Customizable Labels & Price Markers with positions, sizes, and optional price display.
________________________________________
Alerts
A flexible alert module is built in:
✅ Breakout of Any Previous Level (D/W/M) •➤ Triggers when price breaks any previous High/Low:
PDH/PDL;
PWH/PWL;
PMH/PML.
✅ Breakout of Previous Level 1 (D/W/M) •➤ Triggers only for the closest previous levels:
PDH1/PDL1;
PWH1/PWL1;
PMH1/PML1.
✅ Custom Breakout •➤ Choose a specific level:
PDH / PDL;
PWH / PWL;
PMH / PML.
and select which level number (1, 2, 3…) the alert should track.
________________________________________
How to Use
Select which timeframes (D/W/M) to display.
Choose how many previous levels to plot.
Enable Open, Boxes, Separators, or Labels as needed.
Enable True Day Open with offset if required.
Activate Alerts and choose the breakout logic:
• All previous levels;
• Only the nearest level;
• Custom level selection.
Create an alert in TradingView using “Any alert() function call”.
________________________________________
Why This Indicator Is Useful
✅ Instantly reveals key High/Low liquidity zones across multiple timeframes
✅ Helps synchronize market structure across D/W/M levels
✅ Useful for identifying impulses, breakouts, reversals, and liquidity runs
✅ Highlights levels price frequently revisits
✅ Eliminates the need for additional MTF tools
✅ Alerts automate breakout detection for both intraday and swing traders
Suitable for all markets : Forex, Crypto, Indices, Stocks, Futures.

Fixed High Timeframe Moving AveragesFixed High Timeframe Moving Averages (W/D/4H)
Summary
This indicator plots essential, high-timeframe (HTF) Moving Averages onto your chart, **no matter which timeframe you are currently viewing**.
It is designed for traders who need multi-timeframe context at a glance. Stop switching charts to see where the 200-Week or 50-Day MA is—now you can see all critical HTF levels directly on your 5-minute (or any other) chart.
---
Who it’s for
Traders who rely on moving averages but like to work on lower chart timeframes while keeping higher timeframe context in sight. If you scalp on 1–15m yet want Weekly/Daily/4H MAs always visible, this is for you.
---
What it shows
Pinned (“fixed”) moving averages from higher timeframes—Weekly (20/100/200) , Daily (50/100/200/365) and 4H (200) —rendered on any chart timeframe. Your favorite HTF MAs stay on screen no matter what TF you’re currently analyzing.
---
Features
* **MA types:** SMA, EMA, VWMA, Hull.
* **Fully configurable:** toggle each line, set periods, colors, and thickness.
* **Two alert modes (see below):** intrabar vs confirmed HTF close.
* **Works on any symbol & chart TF** using `request.security` to fetch HTF data.
---
Alerts & Modes
This indicator solves the biggest problem with MTF alerts: false signals. You can choose one of two modes:
1. **Intrabar mode** — compares current chart price to the HTF MA. Triggers as soon as price crosses the HTF line; great for early signals but may update until the HTF bar closes.
2. **Confirmed mode** — checks HTF close vs HTF MA. Signals only on the higher-TF bar close; fewer false starts, no intrabar repainting on that TF.
Per-line *Cross Above / Cross Below* conditions are provided for all enabled MAs (e.g., “20W — Cross Above”, “365D — Cross Below”, etc.).
**How to use alerts:** add the script → “Create Alert” → pick any condition from the script’s list.
---
Why this helps
* Keeps Weekly/Daily structure visible while you execute on LTF.
* Classic anchors (e.g., 200D, 20W/100W/200W) are popular for trend bias, dynamic support/resistance, and pullback context.
* Lets you standardize MA references across all your lower-TF playbooks.
---
Notes on confirmation & repainting
* Intrabar signals can change until the higher-TF bar closes (that’s expected with multi-TF data).
* Confirmed mode waits for the HTF close—cleaner, but later. Choose what fits your workflow.
---
Quick setup
1. Pick `MA Type` (SMA/EMA/VWMA/Hull).
2. Enable the HTF lines you want (Weekly 20/100/200; Daily 50/100/200/365; 4H 200).
3. Choose `Alert Mode` (Intrabar vs Confirmed).
4. Style colors/widths to taste and set alerts on the lines you care about.
---
Good practice
* Combine HTF MAs with price action (swings, structure, liquidity grabs) rather than using them in isolation.
* Always validate signals in your execution TF and use a risk plan tailored to volatility.
* Protect your capital: position sizing, stops, and disciplined risk management matter more than any single line on the chart.
---
Disclaimer
For educational/informational purposes only; not financial advice. Trading involves risk—manage it responsibly.

Previous D/W/M HLOCHey traders,
Here's a simple Multi-Timeframe indicator that essentially turns time and price into a box. It'll take the previous high, low, opening price, or closing price from one of the three timeframes of your choice (day, week, or month). For whatever reason I can't get the opening price to function consistently so if you find improvements feel free to let me know, this will help traders who prefer to use opening price over closing price.
Naturally this form of charting is classical and nature and some key figures you could use to study its usage are
- Richard W. Schabacker (1930s)
- Edwards & Magee (1948)
- Peter Brandt
- Stacey Burke (more on the intraday side - typically our preference)
It's usage put plainly:
- Quantifying Accumulation or Distribution
- Revealing Energy Build-Up (Compression)
- Framing Breakouts and False Breakouts
- Structuring Time
- Identifying opportunities to trade a daily, weekly, or monthly range.
