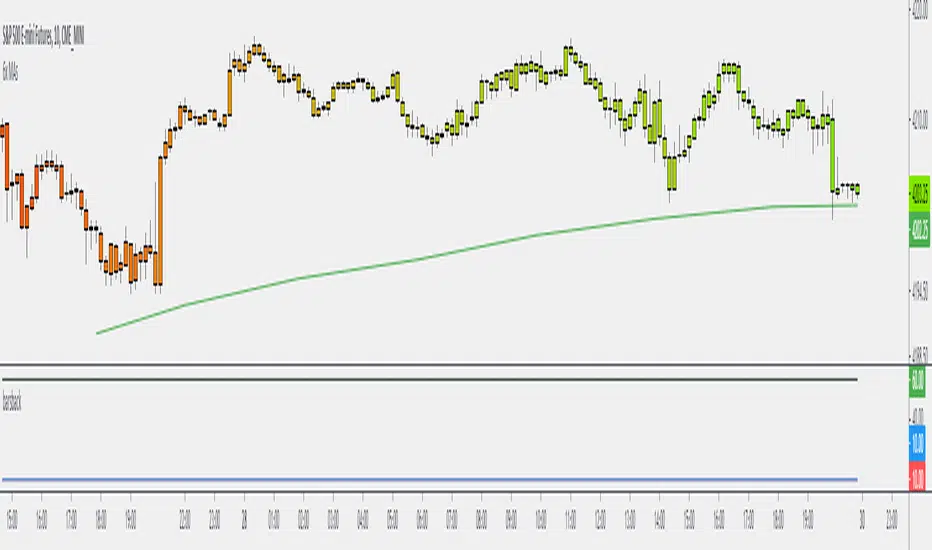
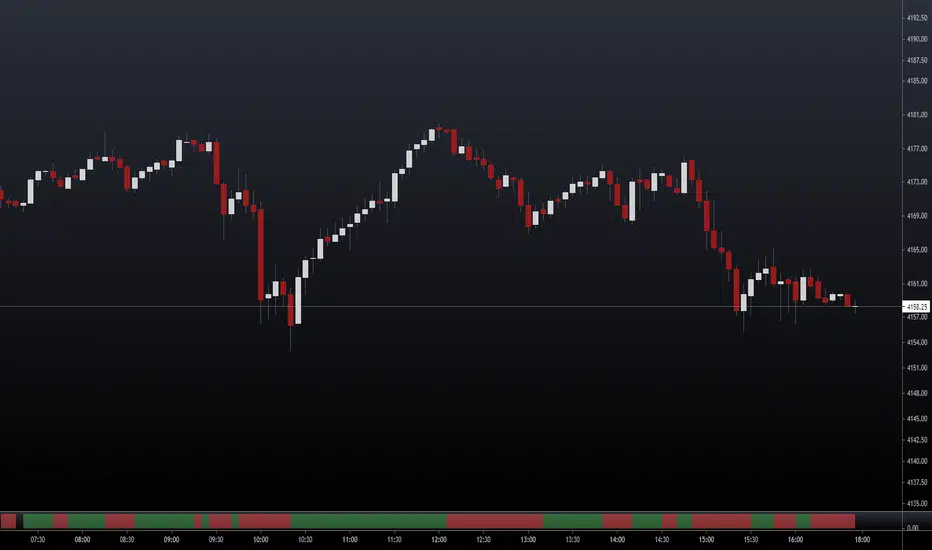
MTF Bars Back FunctionDesigning higher timeframe tools is challenging. Particularly when you want to apply the higher timeframe lookback to the viewing timeframe.
Here are the problems you run into when you want to use a higher timeframe input:
The output is a string.
On the daily, weekly, or monthly timeframes, the output of the input.resolution variable is "1D", "1W", and "1M".
The 1 minute, 1 day, 1 week, and 1 month timeframes all have an output of 1. Same for the 2m, 2d, 2w, 2m and so on.
I designed this function to automatically calculate the number of candles back that you would need to go back on the timeframe you're viewing to cover the lookback distance on the higher.
It checks if there's a letter on the end of the string and cuts it off, leaving just the number, then converts it from a string to a number.
From there it converts the viewing timeframe and higher timeframe into minutes, divides the two to determine their relationship to one another, then it multiplies the lookback distance of the higher timeframe with the factor and the output is the higher timeframe lookback distance converted into the equivalent bar count on the lower timeframe.
I tried to write it in a way that would make what the function does clear to coders and non-coders so it can be modified to suit your purpose. My initial use case was to us this as way of determining a lower timeframe offset for lines that were cast based on previous high timeframe bars. You could use it for any kind of MTF indicator where you want to know how many bars back you need on the low timeframe to achieve the higher timeframe equivalent. For example, if you wanted to create a multi-timeframe moving average, you would use the output as the length of the moving average.
I used a tuple output for the purpose of demonstration, but this can be reduced to a single relevant output.
Hope you find it useful. It's nice when you don't have to fight against multiple resolutions.
Let me know what you think. Is there a better way to go about it?
Trade well.
Multi
MultiAlert LITEAllows one to set 5 price level alerts on one symbol (1 Stop Loss 4 Targets)
Alerts work by prices crosses under the stop loss or over the targets, enabling short reverses this.
Unlike regular MultiAlert, this actually draws a true horizontal price at your price.
This is a lighter version of MultiAlert, supporting only one symbol. Your price levels will appear on all charts unless you hide the indicator.
Make the alert with targets and stop loss set, every time you make a change you MUST REMAKE THE ALERT.
Please comment any problems .

MultiPrice AlertThis is an alert script using Pinescript version 4. This enables one to set 5 alerts (1 StopLoss, 4 Targets), on 3 different symbols, at using a single alert in the UI.
Every visible line will only appear on the symbols that are selected. After setting targets when making an alert, select this indicator as a condition. Change the name to whatever you want, usually the names of the set of tickers.
The Alert message is dyanmic showing which Symbol with each type of alert, at whatever price.
Ability to disable the targets + symbols.
Alerts work by Stop Loss crossing under price and Targets Cross Over. Enabling the "Short" Targets reverses this.
The line that is being displayed is actually the price of the asset being moved over x number of bars. I have not found a way to plot a traditional horizontal line, as the code for it uses a fixed price.
As it being a user input, it is a variable. Any help with this would be appreicated.
Alerts are set to once per bar.
Known bug that sometimes if the prices that you set are inside the current candle stick, then your alert will immeaditally fire, either change the timeframe or let it fire and wait fo
After a target is hit, I reccomend setting the alert to 0 and REMAKING the alert. You MUST REMAKE THE ALERT AFTER ANY CHANGES. This script WILL NOT CHANGE ALERTS AS YOU CHANGE SETTINGS.
TradingView Alerts are not this smart , at least I haven't found a way to do this yet.

Multiple Timeframe RSI with 2 MA by GodtrixHi guys, how ya doing!
I know sometimes you'll need multiple timeframe RSI to study your chart, so do I, therefore I'll share my multi RSI tool for you.
There are total 3 RSI for you to use, you can turn each ON or OFF
I've added more colored value lines for your better view
Also provided a choice for smooth line or step line where there's no gap for higher timeframe RSI on a smaller timeframe chart
MA (SMA) is provided for smoother, less noise lines
Indicator Tips:
Bullish - When it is above 50, this is where you might want to decide whether to close your short order or new short order at top
Bearish - When it is below 50, this is where you might want to decide whether to close your long order or new long order at low

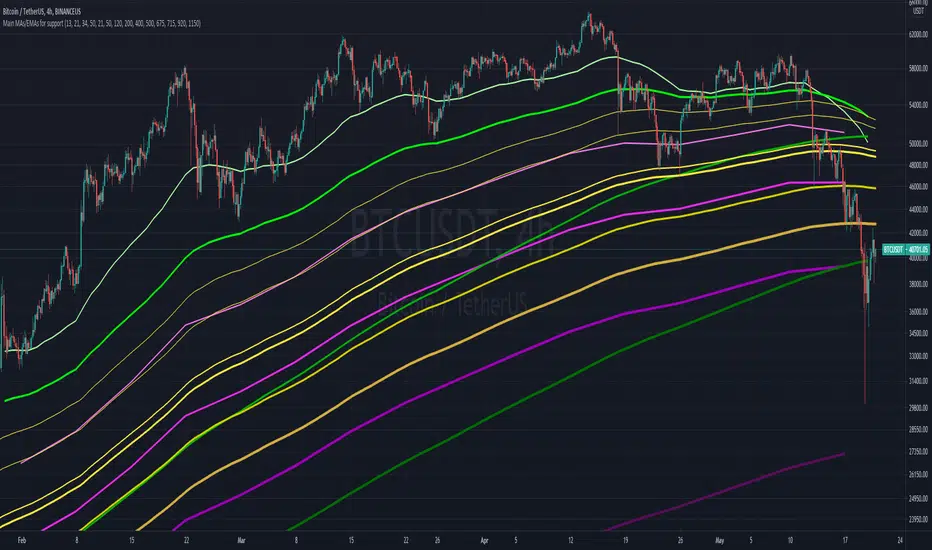
Main MAs and EMAs multi-timeframe for supportObjective is to map out different multi-timeframe support/resistance , all at once. Includes weekly, daily and 4H EMAs and MAs, as per the follow (allowing customization)
WEEKLY (in pink/purple variations):
- 13 EMA
- 21 EMA
- 34 EMA
- 50 M.A
DAILY (in green variations):
- 21 EMA
- 50 EMA
- 120 M.A.
- 200 M.A.
4H (in yellow/golden colors):
- 400 EMA
- 500 EMA
- 675 EMA
- 715 EMA
- 920 EMA
- 1150 EMA
Notes:
- Quite useful to all types of assets; crypto, commodities , stocks, etc...
- Ideally not to be visible all the time, as it can "pollute" the charts. But very helpful in moments of great volatility
Blink RSI - SwingSwiss SuiteYOU ASKED FOR IT, WE MADE IT!
Blink RSI is life-saving. Literally.
Many of us use the RSI indicator daily.
Since I started trading, RSI has always been on my charts, but it is so frustrating not being able to see instantly what is happening on the other timeframes.
Blink RSI is here to solve this problem!
Choose up to 5 timeframes you want to monitor, and you are good to go. You will never have to switch from one timeframe to another to see how the RSI is behaving ever again.
The default configuration has a length of 14 and works on the usual 30-70 gap. Meaning that if a small square appears green, the RSI < 30 and it's a bullish sign while if the RSI > 70 it becomes red and might be bearish.
Very simple but super efficient!
Disclaimer:
Trading and investing in the financial markets involves substantial risk of loss and is not suitable for every investor.
All trading strategies are used at your own risk.
Trend Analyzer is part of the SwingSwiss Suite, contact me for more info

Squeeze Momentum Indicator MTF with alerts [lazy bear]MTF version of the popular squeeze momentum indicator, created and shared by Lazy Bear

NSDT Heiken-Ashi Direction Bar MTFA simple script that places a bar at the bottom of the chart to indicate the direction of Heiken-Ashi candles - while still using traditional candles on the main chart. Try setting the bar on a higher timeframe to see the overall direction of the trend, while using traditional candles for entries/exits.
MA-SS ( EMA SSL ) Indicator StudyThe MA-SS Indicator is a simple yet effective indicator using a combination of EMAs and SSL channel, utilising higher time frame data to help confirm trend/ price direction.
How does it work?
The Indicator consists of;
- 3 x EMAs – The 3rd EMA being a filter EMA
- Multi Time Frame EMA (This is an additional filter EMA which can be switched on and off)
- Multi Time Frame SSL Channel (This acts as a filter and can also be switched on and off)
The concept initially began as a simple EMA crossing indicator, but adding an MTF EMA plus a MTF SSL channel for additional filtering, helped to give a better indication of trend and ultimately filter out several bad trades.
- EXAMPLE: If price is …
o below the MTF EMA filter
o The MTF SSL Channel is red
o White and blue EMAs cross below the yellow (filter) EMA in the red SSL channel
> …a short is fired!
- (Opposite scenario for longs)
- Your stop loss would ideally be the top/ bottom of the SSL channel (either the MTF SSL channel or a standard SSL channel added manually to the chart), or, go for a clear pivot point or support/ resistance level.
- Take profit is yours to decide but I opt for a 1:1.5 risk/reward ratio. You could also use the MTF SSL channel to gauge when you should exit your trade (i.e. if you're in a long, wait for the SSL channel to flip red).
I will also have a strategy script available for this indicator.
Any questions please fire away in the comments.

Multi Resolution RSIThis is a Multi resolution or multi Time frame RSI.
This indicator is made to see 3 different time frames RSI in a single Band.
User can input all 3 timeframes on input section.
The Highest time RSI is denoted in BLACK color.
The Medium time RSI is denoted in BLUE color.
The Smaller time RSI is denoted in GREEN color.
The overbought and oversold region is 70 and 30.
The best way to trade using this indicator is when Higher and medium RSI is above 60 and lower is below 40.

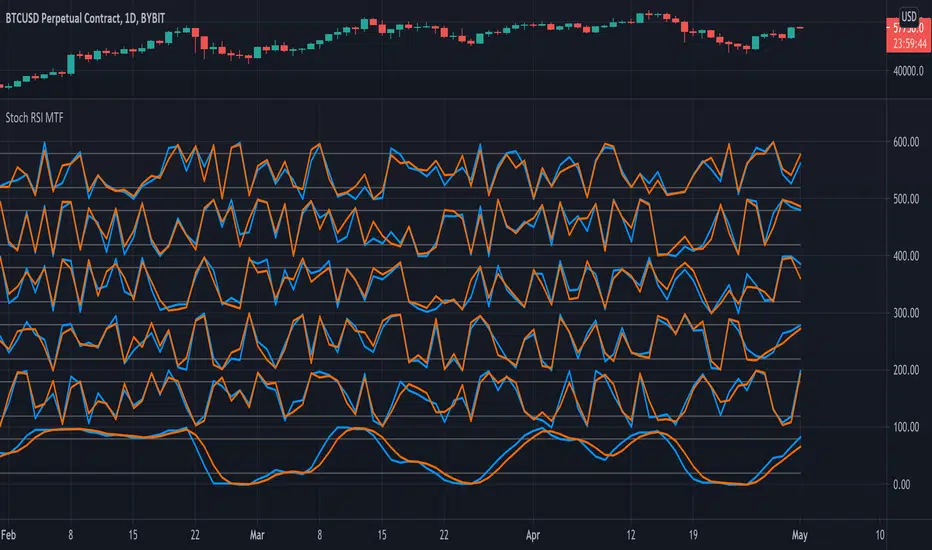
Stochastic RSI MTF - 6 TimeframesDisplays Stochastic RSI from 6 different timeframes.
Default timeframe settings: 5min, 15min, 30min, 1hr, 4hr, 1day.
RK's 15 ∴ Timeframed Multiple MA Types RibbonI developed this indicator focusing on the KISS (Keep It Simple, Stupid) to help me in a more direct and visual way when enteringand exiting my market position.
The idea is to configure the indicator with your favorite Moving Averages and Lengths and Enter Long when the price is above and Short when the price is below.
I put the setup that I am testing now in the tooltips to give an example.
NSDT MTF Moving AverageThis script allows you to choose a movingaverage type and length, and then choose two different chart time frames. It will plot a movingaverage line for each time frame you select (total of 2). Choose between EMA, SMA, and WMA.
For example:
You can be looking at a 5-min chart, but have an EMA for a 1-min timeframe and a 10-min timeframe be displayed.

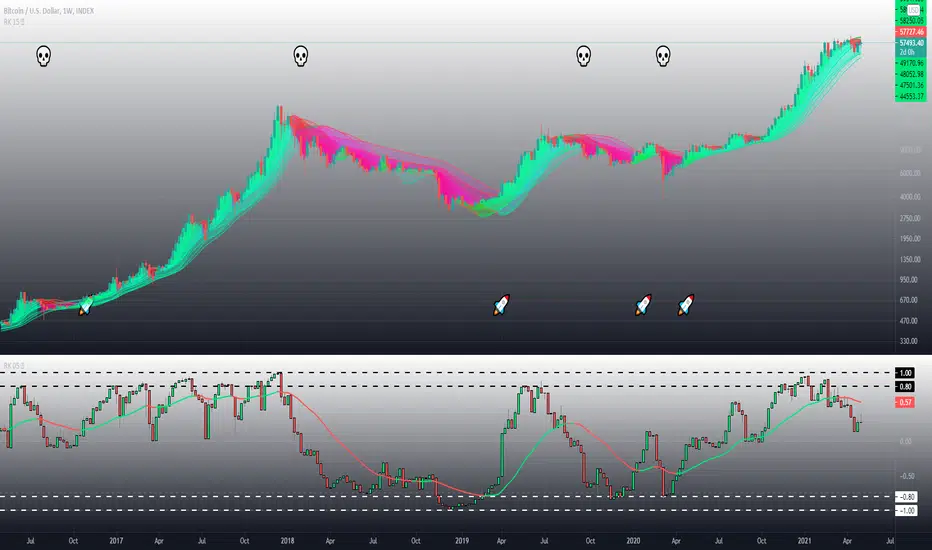
The Trend Oracle - The Ultimate Position ToolThe Trend Oracle is a superadaptive multi-timeframe Indicator
Ideal timeframes are 4H, and 1D
It is based on a combination of several other indicators including:
- The Superstrength Index - An adaptive indicator using volume weighted average of the traditional RSI, MFI and OBV
- The Superfast MACD - An adaptive zero lag MACD
- ADX Trend - A tweaked version of the ADX
- Chop Zones - A combination of 2 Chop indexes to identify trending and non trending conditions.
- The Adaptive Supertrend - An adaptive version of the Supertrend, (switching multipliers based on the market trend)
- Breakout & Breakdown - An algorithm computing volume compression and expansion to indicate breakout & breakdown signals.
- [bBullish and Bearish Divergences - Confirmed Bull and Bear divs shown as green and red dots at the top and bottom of the indicator.
Areas highlighted in Aqua are bullish, red are bearish.
Use this indicator as a tool to position yourself over longer timeframes.
Enjoy!
MM :)

ELIA MULTI INDICATORS STRATEGYExperimental multi indicators strategy, to catch right entry and avoid noise.
Each indicator included in the strategy, assume a value based on its status and because is a trend-follow strategy, some indicator value are higher then the other
Backtested on ETHUSDTPERP
BINANCE:ETHUSDTPERP

(IK) Stoch-60-15This strategy uses 60 minute and 15 minute stochastic data to determine entry and exit; it only executes long trades. I've only used this on BTC/USD, but I imagine the concepts employed should hold for any ticker
The script builds a simple Stochastic indicator for the current timeframe, and it also plots a single stochastic line for a higher resolution time frame. I've found good results trading on 15 minutes with a 60 minute higher resolution.
We enter a trade if the higher resolution stochastic is in an uptrend, if the current resolution stochastic is in an uptrend, and if the current stochastic value is less than 50.
We exit a trade when the current stochastic value crosses below 80 or the trailing stop loss is hit.
Stop loss is calculated with the input value, Stop Loss Percent. This value represents the percent of capital you're willing to lose before exiting a trade. A stop loss percent of 0.050 means your trade will exit if it falls 5% from the highest high since entering a trade. You will have at least 95% of your original capital left. There is no option to change a trailing stop loss to a set stop loss (in order to keep the code as simple as possible), however, you can turn it off by setting Stop Loss Percent to 1.
I tried to keep the script itself lightweight and very easy to understand, so it's not very customizable in regards to input options. You can change stochastic data, as well as the trailing stop percentage. The script can be adjusted to other timeframes, however this requires a small change in the code (details in script comments). Changing just the "Higher Resolution" input will not produce expected results
My hope is that by keeping it lightweight and simple, it will be easier for you to adjust to your specific needs, or work into a larger strategy.

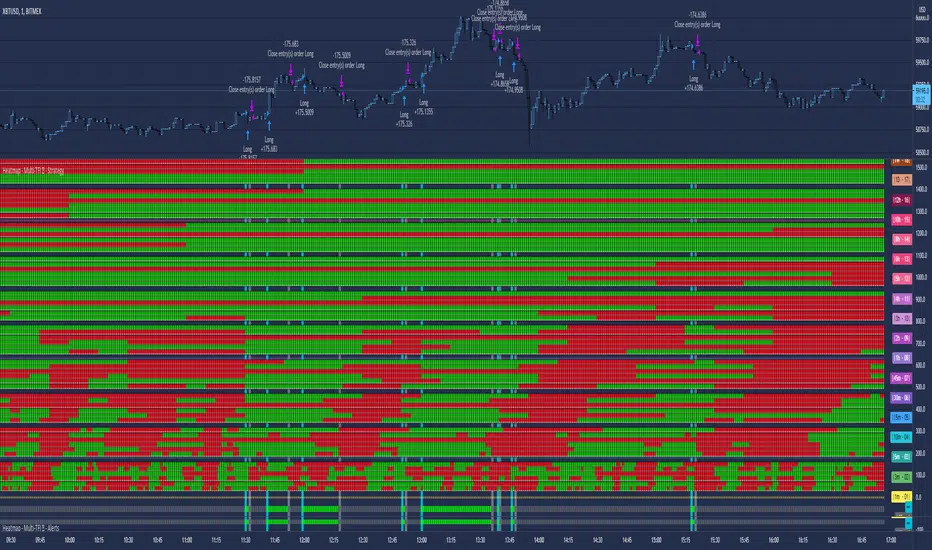
Heatmap - Multi-Timeframe Indicators - StrategyHeatmap - Multi-Timeframe Indicators - Strategy
▪ Main features :
- 19 Timeframes: 1m, 3m, 5m, 10m, 15m, 30m, 45m, 1h, 2h, 3h, 4h, 5h, 6h, 8h, 10h, 12h, 1D, 1W, 1M
- 6 indicators per timeframe
- choose specific timeframes for indicators (example - 1 hour)
- or choose specific timeframe ranges (example - 1 hour to 1 month)
The general idea is that the higher timeframe signals are stronger than the lower timeframe ones.
When a trend is starting, it is first visible on the lower timeframes.
The more time passes, the more the trend propagates through higher timeframes.
The default settings are meant to show all the available features. You may fine-tune it to your specific needs.
How to choose the timeframe for the chart : use the lowest of the choosen timeframes for indicators.
If the heatmap doesn't display correctly on your device, you may check the Heatmap Theme 🎨 setting.
It doesn't repaint.
"Repaint" version available though - good to check the past history, but very bad for real-time analysis.
▪ Indicators used for trend detection
1. MACD Cross
2. Stochastic Cross
3. Stochastic Cross and Overbought or Oversold
4. Moving Average
5. Parabolic SAR
6. Heikin Ashi
▪ Find the best Heatmap settings with the Strategy Tester version.
The signals generated by the Heatmap are considered to be valid at the bar open .
The Strategy Tester, however, uses the bar close in its calculations.
Therefore, the results may seem to be worse than they can be.
The Profitability, Profit Factor and other stats should be taken into consideration relatively to other configurations of the same Heatmap.
▪ Using a score system to consider a change in trend valid.
Example: consider the signal valid if 65% or more of all indicators (max 6) among all timeframes (max 19) hint at a change in trend.
The % percent value can be inserted in settings.
When using the default settings or when all timeframes and indicators are activated,
the ratio of 100% downtrend or 100% uptrend may be less occuring. Adjust accordingly.
The signals across timeframes and indicators are aggregated to show simple entry and exit signals.
▪ Combined Alerts, to be set to fire once per bar open :
0 - 📈 Long! - Heatmap - Multi-TFI
0 - 📈 Short! - Heatmap - Multi-TFI
0 - 📈 Long Exit! - Heatmap - Multi-TFI
0 - 📈 Short Exit! - Heatmap - Multi-TFI
1 *** BUY or SELL (single alert) ***
1 *** Entries or Exits (single alert) ***
▪ Note : The initial load may be slow. If something doesn't seem to work, you can try the following:
- wait more time for it to load
- hide & show or remove & add back to chart
- don't add the indicator to chart multiple times in a short amount of time, as you may be rate limited
▪ Related Studies :
- Heatmap - Multi-Timeframe Indicators - Alerts
- Risk Management System (Stop Loss, Take Profit, Trailing Stop Loss, Trailing Take Profit) - it can be connected to Heatmap - Multi-Timeframe Indicators - Alerts
▪ Layout example:

Heatmap - Multi-Timeframe Indicators - AlertsHeatmap - Multi-Timeframe Indicators - Alerts
▪ Main features :
- 19 Timeframes: 1m, 3m, 5m, 10m, 15m, 30m, 45m, 1h, 2h, 3h, 4h, 5h, 6h, 8h, 10h, 12h, 1D, 1W, 1M
- 6 indicators per timeframe
- choose specific timeframes for indicators (example - 1 hour)
- or choose specific timeframe ranges (example - 1 hour to 1 month)
The general idea is that the higher timeframe signals are stronger than the lower timeframe ones.
When a trend is starting, it is first visible on the lower timeframes.
The more time passes, the more the trend propagates through higher timeframes.
The default settings are meant to show all the available features. You may fine-tune it to your specific needs.
How to choose the timeframe for the chart : use the lowest of the choosen timeframes for indicators.
If the heatmap doesn't display correctly on your device, you may check the Heatmap Theme 🎨 setting.
It doesn't repaint.
"Repaint" version available though - good to check the past history, but very bad for real-time analysis.
▪ Indicators used for trend detection
1. MACD Cross
2. Stochastic Cross
3. Stochastic Cross and Overbought or Oversold
4. Moving Average
5. Parabolic SAR
6. Heikin Ashi
▪ Find the best Heatmap settings with the Strategy Tester version.
The signals generated by the Heatmap are considered to be valid at the bar open .
The Strategy Tester, however, uses the bar close in its calculations.
Therefore, the results may seem to be worse than they can be.
The Profitability, Profit Factor and other stats should be taken into consideration relatively to other configurations of the same Heatmap.
▪ Using a score system to consider a change in trend valid.
Example: consider the signal valid if 65% or more of all indicators (max 6) among all timeframes (max 19) hint at a change in trend.
The % percent value can be inserted in settings.
When using the default settings or when all timeframes and indicators are activated,
the ratio of 100% downtrend or 100% uptrend may be less occuring. Adjust accordingly.
The signals across timeframes and indicators are aggregated to show simple entry and exit signals.
▪ Combined Alerts, to be set to fire once per bar open :
0 - 📈 Long! - Heatmap - Multi-TFI
0 - 📈 Short! - Heatmap - Multi-TFI
0 - 📈 Long Exit! - Heatmap - Multi-TFI
0 - 📈 Short Exit! - Heatmap - Multi-TFI
1 *** BUY or SELL (single alert) ***
1 *** Entries or Exits (single alert) ***
▪ Note : The initial load may be slow. If something doesn't seem to work, you can try the following:
- wait more time for it to load
- hide & show or remove & add back to chart
- don't add the indicator to chart multiple times in a short amount of time, as you may be rate limited
▪ Related Studies :
- Heatmap - Multi-Timeframe Indicators - Strategy Tester
- Risk Management System (Stop Loss, Take Profit, Trailing Stop Loss, Trailing Take Profit) - it can be connected to Heatmap - Multi-Timeframe Indicators - Alerts
▪ Layout example:
MTF SwingSwiss - Premium@panthair9, a SwingSwiss user, asked me to develop this script based on the two SwingSwiss crosses.
The indicator shows in real-time how the other timeframes are trading the asset.
It's pretty useful to know that the higher timeframes are also trading your way as it limits your risk (because you are trading the right trend)
You can choose up to five timeframes and style the lines and colored blocks 😃
There is one line per timeframe and whenever the green cross appears on the timeframe, it will get updated into the line as well !! I love the thing, thanks again @panthair9 ❤️
PS:
Dear SwingSwiss community, I am really trying to build the best indicator out there!
If you feel like I could improve the indicator in any way, just ask!
I'll do my best to make your dream indicator come true 🙌
Have A Great Day
Dan

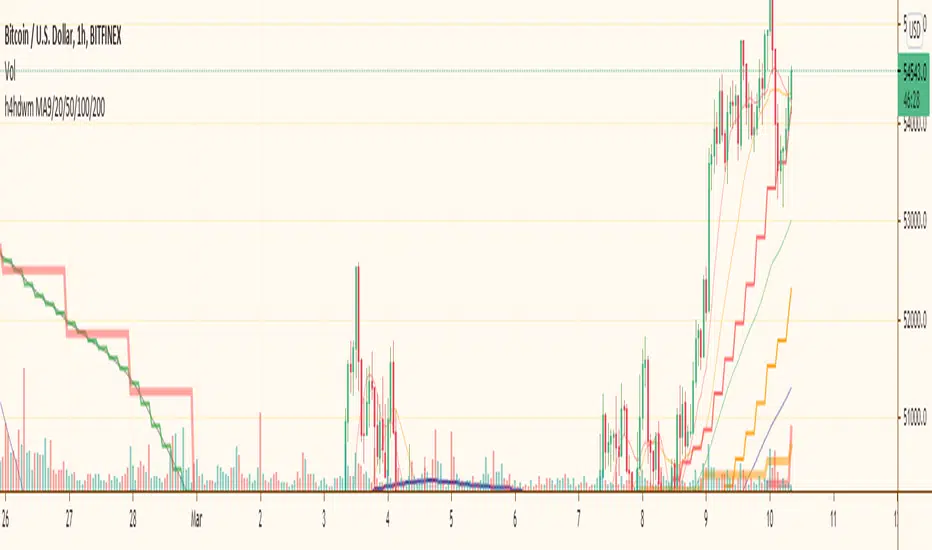
h4hdwm (updated)I put most importand moving avarages for most importand time frames together. When you whatching a graph you are sometimes missing another time frime very importand moving avarage and there is a reaction on price. with this multi time frame multi ma indicator you can see all of them at once. it makes a little mass if you let all of them together. so you might close some of them.
Bigger time frames Moving Avarages has ticker lines and bigger steps.
[L] MTF SSL ChannelThis indicator plots SSL Channel, ideally from an higher time frame. I couldn't find any SSL Channel script with this feature so I made one, hope that helps others.
Features:
No Repainting
The script does not repaint and follows Pinescripters' guidelines.
Other Time Frame
It is possible to select another (higher) time frame. If a lower one is selected the script warns to change it, since calling a lower time frame leads to unreliable data.
Alerts
It is possible to create alerts for trend changes (cross Up or Down).
It also shows simple labels to see trend status at glance.

MTF Ichimoku Signal [Takazudo]A multi timeframe Ichimoku Signal indicator. This indicator shows the status of each Ichimoku Signals.
1. TK-Cross
Tenkan-Sen & Kijun-Sen cross status
2. Future Kumo
The newest Kumo color
3. Kumo & Current Relation
The relation between current price & Kumo.
4. Kumo & Chikou-Span Relation
The relation between Kumo & Chikou-Span.
5. Chikou-Span & Candle Cross
Chikou-Span & Candle cross status

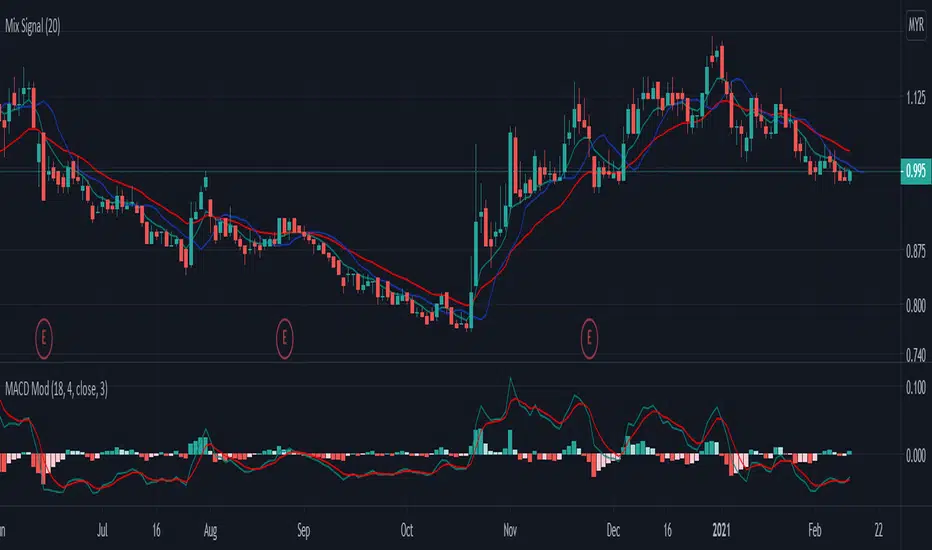
Mix signal-rileksdevMix Signal Indicator by rileksdev
Indikator ini mengandungi
-3 line bewarna hjau,merah,biru
-1 indikator MACD yang sudah diubahsuai supaya boleh mengesan pergerakan awal harga akan turun atau naik.
-Support & Resistance sudah tersedia pada chart,jadi tidak perlu susah payah cari sendiri
-Buy signal & Sell signal yang keluar apabila harga akan membuat kenaikan atau penurunan
Cara guna:
Line biru: digunakan untuk intraday timetrame 5minit.
Line hijau & merah digunakan untuk Intraday pada timeframe 15minit timeframe 30minit untuk swing short term atau midterm.
MACD MOD untuk mengesan pergerakan awal harga akan turun atau naik.
Garis bintik hijau(Support) & Garis bintik merah (Resistance) yang sudah tersedia pada Chart
Buy signal apabila harga akan membuat kenaikan
Sell signal apabila harga akan membuat penurunan