Reversal Probability Meter PRO [optimized for Xau/Usd m5]🎯 Reversal Probability Meter PRO
A powerful multi-factor reversal probability detector that calculates the likelihood of bullish or bearish reversals using RSI, EMA bias, ATR spikes, candle patterns, volume spikes, and higher timeframe (HTF) trend alignment.
🧩 MAIN FEATURES
1. Reversal Probability (Bullish & Bearish)
Displays two key metrics:
Bull % — probability of bullish reversal
Bear % — probability of bearish reversal
These are computed using RSI, EMAs, ATR, demand/supply zones, candle confirmations, and volume spikes.
📊 Interpretation:
Bull % > 70% → Buying pressure building up
Bull % > 85% → Strong bullish reversal confirmed
Bear % > 70% → Selling pressure building up
Bear % > 85% → Strong bearish reversal confirmed
2. Alert Probability Threshold
Adjustable via alertThreshold (default = 85%).
Alerts trigger only when probability ≥ threshold, and confirmed by zone + volume spike + candle pattern.
🔔 Alerts Available:
✅ Bullish Smart Reversal
🔻 Bearish Smart Reversal
To activate: Right-click chart → “Add alert” → choose the alert condition from the indicator.
3. Demand / Supply Zone Detection
The script determines the price position within the last zoneLook (default 30) bars:
🟢 DEMAND → Lower 35% of range (potential bounce zone)
🔴 SUPPLY → Upper 35% of range (potential rejection zone)
⚪ MID → Neutral area
📘 Purpose: Validates reversals based on context:
Bullish only valid in Demand zones
Bearish only valid in Supply zones
4. Higher Timeframe (HTF) Trend Alignment
Reads EMA bias from a higher timeframe (default = 15m) for trend confirmation.
Reversals against HTF trend are automatically weighted down prevents false countertrend signals.
📈 Example:
M5 chart under M15 downtrend → Bullish probability is reduced.
5. Candle Confirmation Patterns
Two key price action confirmations:
Bullish: Engulfing or Pin Bar
Bearish: Engulfing or Pin Bar
A valid reversal requires both a candle confirmation and a volume spike.
6. Volume & ATR Spike Filters
Volume Spike: volume > SMA(20) × 1.3
ATR Spike: ATR > SMA(ATR, 50) × volMult
🎯 Ensures that only strong market moves with real energy are considered valid reversals.
7. Reversal Momentum Histogram
A color-gradient oscillator showing the momentum difference:
Green = bullish dominance
Red = bearish dominance
Flat near 0 = neutral
Controlled by showOscillator toggle.
8. Smart Info Panel
A compact dashboard displayed on the top-right with 4 rows:
Row Info Description
1 Bull % Bullish reversal probability
2 Bear % Bearish reversal probability
3 Zone Market context (DEMAND / SUPPLY / MID)
4 Signal Strength Current signal intensity (probability %)
Dynamic Colors:
90% → Bright (strong signal)
75–90% → Yellow/Orange (medium)
<75% → Gray (weak)
9. Sensitivity Mode
Fine-tunes indicator reactivity:
🟥 Aggressive: Detects reversals early (more signals, less accurate)
🟨 Normal: Balanced, default mode
🟩 Conservative: Filters only strongest reversals (fewer but more reliable)
10. Custom Color Options
Customize bullish and bearish colors via bullBaseColor and bearBaseColor inputs for your preferred chart theme.
⚙️ HOW TO USE
Add to Chart
→ Paste the script into Pine Editor → “Add to chart”.
Select Timeframe
→ Best for M5–M30 (scalping/intraday).
→ H1–H4 for swing trading.
Monitor the Info Panel:
Bull % ≥ 85% + Zone = Demand → Strong bullish reversal signal
Bear % ≥ 85% + Zone = Supply → Strong bearish reversal signal
Watch the Histogram:
Rising green bars = bullish momentum gaining
Deep red bars = bearish momentum gaining
Enable Alerts:
Right-click chart → “Add alert”
Choose Bullish Smart Reversal or Bearish Smart Reversal
🧠 TRADING TIPS
Use Conservative mode for noisy lower timeframes (M5–M15).
Use Aggressive mode for higher timeframes (H1–H4).
Combine with manual support/resistance or zone boxes for precision entries. Personally i use Order Block.
Best reversal setups occur when all align:
Bull % > 85%
Zone = DEMAND
Volume spike present
Candle = Bullish engulfing
HTF trend supportive
Multitimeframe

ICT Essentials [LDT]ICT Essentials
Overview
ICT Essentials is an all-in-one trading utility built to create a natural and efficient workflow for ICT-based traders.
Every component has been designed to integrate seamlessly and update dynamically across timeframes.
The indicator focuses on clarity, performance and customization, allowing traders to tailor every part of their trading experience.
Equal Highs & Lows
This feature automatically detects and marks Equal Highs (EQH) and Equal Lows (EQL) with full control over visuals and behavior.
Users can customize line colors, widths, and styles, label size, color, background transparency and text offset.
The logic uses an optimized scanning and caching system that maintains smooth performance even on higher timeframes.
It provides a precise and adaptive way to identify structural liquidity points whilst keeping the chart clean and readable.
Killzones & Session Pivots
Plots the main trading sessions such as Asia, London and New York (AM, Lunch, PM) with full flexibility and styling options.
Each session can be enabled or disabled individually, with its own color, transparency and label preferences.
Session highs and lows are automatically tracked and plotted as pivots with extension modes like Until Mitigated or Past Mitigation.
This system gives traders the ability to organize market sessions exactly how they prefer whilst keeping the chart consistent and efficient.
Daily Pivots and Tier System
Alongside session pivots, the script tracks daily highs and lows to provide a broader structural view of price. These pivots are stored and displayed on the chart with their appearance updating automatically when price interacts with them.
The system includes a unique tier-based visibility filter that maintains a clean chart by preventing duplicate or overlapping pivots. Recent daily pivots are cached and compared to session pivots and when two levels fall within a defined proximity, the redundant one is automatically hidden. This creates a clear hierarchy of daily and session levels, keeping the most relevant structure visible whilst removing noise.
All aspects of the daily pivot system are fully customizable, including the number of tracked pivots, color, style settings and how mitigated levels are handled. The caching and filtering logic ensures smooth performance and a visually organized workspace even as the data updates in real time.
Key Times
Allows up to five custom key time markers such as the Midnight Open, 6:00 AM or 10:00 AM.
Each marker can be fully customized with its own text, color, line style and thickness.
This makes it simple to visualize key reaction points that align with each traders timing model.
Higher Timeframe Candles
Displays higher timeframe candles such as 1H, 4H or Daily directly on the active chart to provide context without switching views.
Users can customize body, wick and border colors, along with adding optional trace lines for the open, close, high and low and can also show the countdown timers for remaining candle time.
Adjustable spacing, positioning and label visibility makes the display blend naturally with any trading setup.
This module helps traders connect multiple timeframes visually in a clean and intuitive way.
Watermark
Adds a customizable watermark with title, subtitle and symbol or timeframe information.
Every element can be adjusted for color, size, transparency, alignment and position.
The result is a polished, professional chart layout that adapts to the user's personal style.
Optimization and Design
ICT Essentials is built for performance, using cached arrays and lightweight calculations to maintain responsiveness on all timeframes.
Each feature can be toggled individually to suit the traders focus or system performance.
The script delivers a fluid, customizable and highly optimized trading experience designed to feel natural and effortless in day-to-day use.
Credits
This script takes reference and inspiration from several open-source indicators:
Equal Highs and Lows by jzstur
ICT HTF Candles (fadi) by fadizeidan
ICT Killzones + Pivots EP by tradeforopp
AG FX - Watermark by AGFXTRADING
All components have been refactored, optimized and unified into a single framework for a smoother and more efficient workflow.

Multi Brownian Forecast📊 Multi Brownian Forecast (Time-Adaptive, Probabilistic)
This indicator uses a sophisticated Geometric Brownian Motion (GBM) Monte Carlo simulation to project future price paths. It adapts to any chart timeframe and provides quantitative, multi-period probability signals.
---
🧠 Core Mathematical Methodology
The model relies on GBM, which is a continuous-time stochastic process that models asset prices.
1. Historical Analysis (Drift & Volatility):
* The script first calculates Logarithmic Returns over a user-defined Historical Lookback (Hours) .
* Drift ($\mu$): Computed as the average of the log returns.
* Volatility ($\sigma$): Computed as the standard deviation of the log returns.
* These values are then time-adapted to an hourly step, compensating for the chart's current timeframe (e.g., 5-minute, 1-hour).
2. Monte Carlo Simulation:
* It runs a specified Number of Simulations (e.g., 1000).
* For each simulation, the price is stepped forward hourly using the GBM formula, which incorporates the calculated drift and a random shock drawn from a normal distribution (generated via the Box-Muller transform ).
---
✨ Key Features
Probabilistic Quartile Forecast: Plots a dynamic "cone" of probability on the chart. It shows key price percentiles (Q1, Q2/Median, Q3, and Q4/Outer Bound) at the forecast's expiration, visualizing the expected range of price outcomes based on the simulations.
Multi-Period Probability Signals: This is the core signal feature. Users can define multiple, independent forecast periods (e.g., 4h, 16h, 48h) in a comma-separated list.
* For each period, a Probability Up and Probability Down is calculated based on hitting a custom Target Price Change (%) (e.g., 2%) at a certain confidence level given a simulation over the historical backlook.
* The probabilities are displayed in a chart table. The cell text turns white if the calculated probability exceeds the user-defined Signal Confidence (%) .
Conditional Fibonacci Retracement: Optionally displays a Fibonacci Retracement on the chart. This feature is only activated when one of the multi-period signals reaches its minimum confidence threshold, providing a contextual technical level when a probabilistic edge is found.

Session Gap Fill [LuxAlgo]The Session Gap Fill tool detects and highlights filled and unfilled price gaps between regular sessions. It features a dashboard with key statistics about the detected gaps.
The tool is highly customizable, allowing users to filter by different types of gaps and customize how they are displayed on the chart.
🔶 USAGE
By default, the tool detects all price gaps between sessions. A price gap is defined as a difference between the opening price of one session and the closing price of the previous session. In this case, the tool uses the opening price of the first bar of the session against the closing price of the previous bar.
A bullish gap is detected when the session open price is higher than the last close, and a bearish gap is detected when the session open price is lower than the last close.
Gaps represent a change in market sentiment, a difference in what market participants think between the close of one trading session and the open of the next.
What is useful to traders is not the gap itself, but how the market reacts to it.
Unfilled gaps occur when prices do not return to the previous session's closing price.
Filled gaps occur when prices come back to the previous session's close price.
By analyzing how markets react to gaps, traders can understand market sentiment, whether different prices are accepted or rejected, and take advantage of this information to position themselves in favor of bullish or bearish market sentiment.
Next, we will cover the Gap Type Filter and Statistics Dashboard.
🔹 Gap Type Filter
Traders can choose from three options: display all gaps, display only overlapping gaps, or display only non-overlapping gaps. All gaps are displayed by default.
An overlapping gap is defined when the first bar of the session has any price in common with the previous bar. No overlapping gap is defined when the two bars do not share any price levels.
As we will see in the next section, there are clear differences in market behavior around these types of gaps.
🔹 Statistics Dashboard
The Statistics Dashboard displays key metrics that help traders understand market behavior around each type of gap.
Gaps: The percentage of bullish and bearish gaps.
Filled: The percentage of filled bullish and bearish gaps.
Reversed: The percentage of filled gaps that move in favor of the gap
Bars Avg.: The average number of bars for a gap to be filled.
Now, let's analyze the chart on the left of the image to understand those stats. These are the stats for all gaps, both overlapping and non-overlapping.
Of the total, bullish gaps represent 55%, and bearish ones represent 44%. The gap bias is pretty balanced in this market.
The second statistic, Filled, shows that 63% of gaps are filled, both bullish and bearish. Therefore, there is a higher probability that a gap will be filled than not.
The third statistic is reversed. This is the percentage of filled gaps where prices move in favor of the gap. This applies to filled bullish gaps when the close of the session is above the open, and to filled bearish gaps when the close of the session is below the open. In other words, first there is a gap, then it fills, and finally it reverses. As we can see in the chart, this only happens 35% of the time for bullish gaps and 29% of the time for bearish gaps.
The last statistic is Bars Avg., which is the average number of bars for a gap to be filled. On average, it takes between one and two bars for both bullish and bearish gaps. On average, gaps fill quickly.
As we can see on the chart, selecting different types of gaps yields different statistics and market behavior. For example, overlapping gaps have a greater than 90% chance of being filled, whereas non-overlapping gaps have a less than 40% chance.
🔶 SETTINGS
Gap Type: Select the type of gap to display.
🔹 Dashboard
Dashboard: Enable or disable the dashboard.
Position: Select the location of the dashboard.
Size: Select the dashboard size.
🔹 Style
Filled Bullish Gap: Enable or disable this gap and choose the color.
Filled Bearish Gap: Enable or disable this gap and choose the color.
Unfilled Gap: Enable or disable this gap and choose the color.
Max Deviation Level: Enable or disable this level and choose the color.
Open Price Level: Enable or disable this level and choose the color.

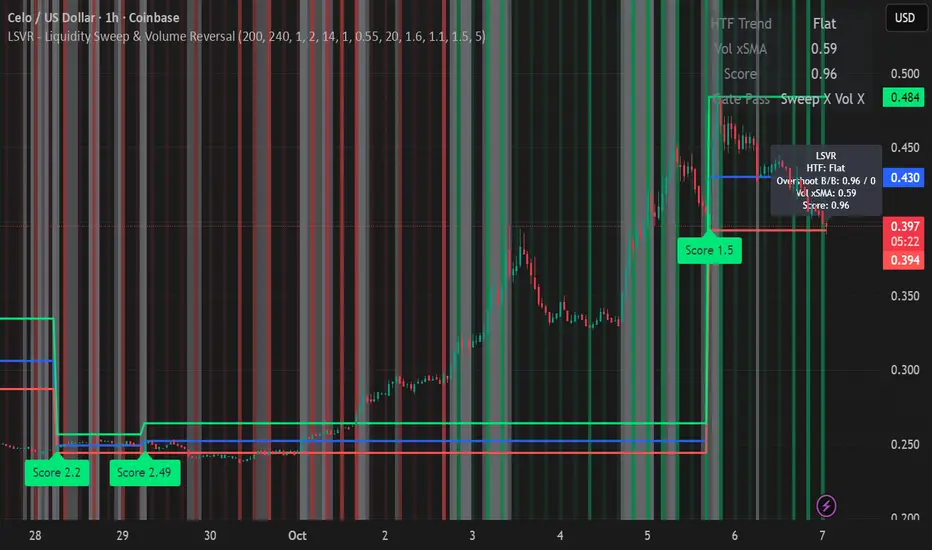
LSVR - Liquidity Sweep & Volume ReversalLSVR condenses a pro workflow into one visual overlay: Higher-Timeframe (HTF) Trend → Liquidity Sweep & Reclaim → Volume Confirmation. A signal only prints when all three gates align at bar close, and the chart shows everything you need—trend context, the sweep “trap” candle, and a projected Entry/SL/TP based on your chosen R multiple.
How it works
HTF Trend Filter: Projects a smoothed KAMA/EMA from a higher timeframe to the chart using a safe, lookahead-off request. Long signals are considered only above the HTF line; shorts only below.
Liquidity Sweep & Reclaim: Finds confirmed swing highs/lows, then detects an ATR-scaled overshoot through that swing followed by a reclaim (close back inside a configurable % of the bar range).
Volume Confirmation: Requires either a volume spike over Volume SMA × multiplier or optional OBV divergence. No participation = no signal.
Score: Each setup is scored: trend (0/1) + overshoot strength (0..1.5) + conviction (0/1). Signals fire only when the score ≥ Min Signal Score.
What you see
HTF Ribbon (subtle green/red backdrop) for bias.
Sweep Box on the signal candle (green = long, red = short).
Signal markers (“L” / “S”) with a small score label.
Projected lines that persist until the next signal: Entry (close), Stop (beyond swept swing), Target (R multiple).
Heatmap that intensifies when the score crosses your threshold.
Dashboard (top-right): HTF direction, Volume×SMA, current Score, gate pass status.
Tooltip on the last bar with quick stats.
Quick start
Apply to any liquid symbol and set HTF to ~3–6× your chart timeframe (e.g., 15m chart → 1H–4H).
Trade with the HTF trend: take L signals above the HTF line and S signals below it.
Entry = signal bar close, SL = beyond the swept swing, TP = your Projected Take-Profit (R).
Tighten or loosen selectivity with Min Signal Score, Reclaim %, Overshoot (ATR×), and Cooldown.
Recommended presets
Choppy/crypto 15m: minScore 1.25, reclaimPct 0.60–0.65, overshootATR 1.0–1.2, useOBVDiv=false, cooldown 8.
FX 5m / session trend: minScore 1.0–1.1, reclaimPct 0.50–0.55, overshootATR 0.8–1.0, useOBVDiv=true, cooldown 5.
Indices 1m (RTH): minScore 1.2, reclaimPct 0.55–0.60, useOBVDiv=false, cooldown 10.
Non-repainting by design
HTF values use lookahead_off with realtime offset.
Swings are confirmed pivots (no “forming” pivots).
Signals print at bar close only.
Notes
OBV divergence can add sensitivity on liquid markets; keep it off for stricter filtering.
Use Cooldown to avoid clustered sweeps.
This is an overlay/analysis tool, not financial advice. Test settings in Replay/Paper Trading before using live.
FVG Scanner ProFVG Scanner Pro — Smart Fair Value Gap Detector (with HTF context & proximity alerts)
What it does
FVG Scanner Pro automatically finds Fair Value Gaps (FVGs) on your current chart and (optionally) on a higher timeframe (HTF), draws them as color-coded zones, and notifies you when price comes close to a gap boundary using an ADR-based proximity trigger and (optional) volume confirmation. It’s designed for ICT-style gap trading, confluence building, and clean visual execution.
How it works:
FVG definition
* Bullish FVG (gap up): low > high (the current candle’s low is above the high 2 bars ago).
* Bearish FVG (gap down): high < low (the current candle’s high is below the low 2 bars ago).
* Gaps smaller than your Min FVG Size (%) are ignored. (Gap size = (top-bottom)/bottom * 100.)
Higher-timeframe logic (auto-selected)
The script auto picks a sensible HTF:
1–5m → 15m, 15m → 1H, 1H → 4H, 4H → 1D, 1D → 1W, 1W → 1M, small 1M → 3M, big ≥3M → 12M.
You can display HTF FVGs and even filter so current-TF FVGs only show when they overlap an HTF gap.
Proximity alerts (ADR-based)
The script computes ADR on the current chart timeframe over a user-set lookback (default 20 bars).
An alert fires when price moves toward the closest actionable boundary and comes within ADR × Multiplier:
Bullish: price moving down, within distance of the bottom of a bullish FVG.
Bearish: price moving up, within distance of the top of a bearish FVG.
Yellow ▲/▼ markers show where a proximity alert triggered.
Volume filter (optional)
Require volume to be greater than SMA(20) × multiplier to accept a newly formed FVG.
Lifecycle
Each gap remains active for Extend FVG Box (Bars) bars.
You can delete the box after fill, or keep filled gaps visible as gray zones, or hide them.
Color legend
Current-TF Bullish: Pink/Magenta box
Current-TF Bearish: Cyan/Turquoise box
HTF Bullish: Gold box
HTF Bearish: Orange box
Filled (if shown): Gray box
Alert markers: Yellow ▲ (bullish), Yellow ▼ (bearish)
Inputs (what to tweak)
Show FVGs: Bullish / Bearish / Both
Max Bars Back to Find FVG: collection window & cleanup guard
Extend FVG Box (Bars): how long a zone stays tradable/active
Min FVG Size (%): ignore micro gaps
Delete Box After Fill & Show Filled FVGs: choose how you want completed gaps handled
Show Alert Markers: show/hide the yellow proximity arrows
Show Higher Timeframe FVG: overlay HTF gaps (auto TF)
HTF Filter: only display current-TF gaps that overlap an HTF gap
ADR Lookback & Proximity Multiplier: tune alert sensitivity to your market & timeframe
Volume Filter & Volume > MA Multiple: require above-average volume for new gaps
Built-in alerts (ready to use)
Create alerts in TradingView (⚠️ “Once per bar” or “Once per bar close”, your choice) and select from:
🟢 Bullish FVG Proximity — price approaching a bullish gap bottom
🔴 Bearish FVG Proximity — price approaching a bearish gap top
✅ New Bullish FVG Formed
⚠️ New Bearish FVG Formed
The alert messages include the symbol and price; proximity markers are also plotted on chart.
Tips & best practices
Use FVGs with market structure (break of structure, swing points), order blocks, or liquidity pools for confluence.
On very low timeframes, raise Min FVG Size and/or lower Max Bars Back to reduce noise and keep things fast.
Extend FVG Box controls how long a zone is considered valid; align it with your holding horizon (scalp vs swing).
Information panel (top-right)
Shows your mode, current HTF, number of gaps in memory, active bull/bear counts, and current-TF ADR.

Key-Levels - D/W/M High-Low + Fib + MA🧭 Key-Levels – D/W/M High-Low + Fibonacci + Moving Averages
A complete multi-timeframe analysis toolkit that combines Daily, Weekly, and Monthly high/low levels, Fibonacci retracements, and customizable moving averages — all in one clean, efficient display.
Ideal for traders who want to identify key reaction zones, retracement levels, and trend alignment across multiple timeframes.
🔹 Features
1. Prior High/Low Levels
Plots Daily (PDH/PDL), Weekly (PWH/PWL), and Monthly (PMH/PML) key levels
Adjustable colors, styles (Solid / Dashed / Dotted), and line widths
Optional midline display for each timeframe
Displays live labels with price values and % difference from current close
Extend lines rightward to project future price interactions
2. Fibonacci Retracement
Auto-detects swing highs/lows using configurable pivot lengths
Smart pivot logic prioritizes major swings based on % span
Auto-orients retracements depending on trend direction
Customizable visibility and color for each Fibonacci level
Supports 0.236 → 1.618 levels, with optional auto-extension in uptrend scenarios
Displays ratio + price for each level label
3. Pivot Labels
Optionally show pivot high/low labels with customizable text and background colors
Independent control of left/right length and label style
4. Moving Averages
Up to three customizable MAs (default: 8 EMA, 21 EMA, 50 SMA)
Choose between EMA or SMA for each
Toggle individual or all moving averages
Adjustable lengths, colors, and line widths
5. Alerts
Built-in alert condition for price crossing a user-defined level
Clean alert message format with ticker symbol and live price
⚙️ Customization
Flexible style controls for lines, labels, and colors
Adjustable right-extension length for projecting levels
Font size and visibility toggles for all elements
Smart grouping for intuitive settings management
📈 Ideal For
Identifying key reversal or breakout zones
Spotting Fibonacci confluence between retracements and prior highs/lows
Tracking trend structure via multi-timeframe MAs
Swing traders, intraday traders, and technical analysts
💡 Summary
Key-Levels – D/W/M High-Low + Fib + MA is a professional-grade indicator designed to simplify complex multi-timeframe analysis.
It helps you see the bigger picture, find actionable zones, and trade with confidence.
🧩 Compatible with any market and timeframe.

TLM HTF CandlesTLM HTF Candles
Higher timeframe candles displayed on your current chart, optimized for The Lab Model (TLM) trading methodology.
What It Does
Plots up to 6 HTF candles side-by-side on the right of your chart with automatic swing detection, expansion bias coloring, and a quick-reference info table. Watch multiple timeframes at once without switching charts.
Swing Detection - Solid lines for confirmed swings, dashed for potential swings. Detects when HTF levels get swept and rejected.
Expansion Bias - Candles colored green (bullish), red (bearish), or orange (conflicted) based on 3-candle patterns showing expected price expansion.
HTF Info Table - Compact dashboard showing time to close, active swings, and expansion direction for all timeframes. Toggle dark/light mode.
Equilibrium Lines - 50% midpoint from previous candle to current, great for mean reversion targets.
Based on "ICT HTF Candles" by @fadizeidan -
Heavily customized with swing analysis, expansion patterns, and info table for TLM trading concepts.

MACD-V+ (ATR Normalized MACD)MACD-V+ is an ATR-normalized MACD tool that focuses on true turning points inside Overbought/Oversold zones. It marks a signal only when the MACD’s slope changes direction and shows real progress back toward the zero line, with an optional dwell (depth & time) filter so you don’t get faked out by shallow pokes into a zone. Clean visuals, “first-in-zone” gating, and configurable labeling make it practical for discretionary and systematic traders alike.
For best results, adjust Overbought and Oversold levels based on stock volatility. The default settings of 150 and -150 are for highly volatile tickers. Reduce for less volatile tickers.
Please help me improve the code for everyone.

High Time Frame (HTF) Swing PointsIdentify and display swing highs and lows across multiple higher timeframes on a chart, overlaying horizontal lines and customizable labels at these swing points.
Timeframes
Five user-defined higher timeframes (default settings: 5-minute, 15-minute, 1-hour, 4-hour, and daily)
Manually show/hide individual timeframes
When chart’s timeframe is set higher than one of the five configured, the indicator will automatically hide it. This helps to prevent clutter when navigating between timeframes on the chart
Swing Levels
Configure the line color, opacity, width and weather it’s solid/dotted/dashed
Once swing levels are identified, the indicator will look for the chart candle where the line starts
When price crosses the swing level, the line will be terminated
Tags
Customize the tag text for each individual timeframe, using blank if a tag is not desired for that timeframe
A tag text color can be set for all tags or base it on the line color
Set tag text size based on: Auto, Tiny, Small, Normal, Large
Choose how far to the right of the line the tag text should appear, as an integer representing the size of a candle
Choose to clear the tag or leave it in place after price crosses a swing level
Use Cases
Visualize key swing points from higher timeframes to identify potential reversal or breakout zones
Identify possible low resistance liquidity run (LRLR) areas
Use swing points for stop placement or as targets or draws on liquidity

Multi-Timeframe MACD with Color Mix (Nikko)Multi-Timeframe MACD with Color Mix (Nikko) Indicator
This documentation explains the benefits of the "Multi-Timeframe MACD with Color Mix (Nikko)" indicator for traders and provides easy-to-follow steps on how to use it. Written as of 05:06 AM +07 on Saturday, October 04, 2025, this guide focuses on helping you, as a trader, get the most out of this tool with clear, practical advice before diving into the technical details.
Benefits for Traders
1. Multi-Timeframe Insight
This indicator lets you see momentum trends across 15-minute, 1-hour, 1-day, and 1-week timeframes all on one chart. This big-picture view helps you catch both quick market moves and long-term trends without flipping between charts, saving you time and giving you a fuller understanding of the market.
2. Visual Momentum Representation
The background changes from red to green based on short-term (15m) momentum, giving you a quick, easy-to-see signal—red means bearish (prices might drop), and green means bullish (prices might rise). The histogram uses a mix of red, green, and blue colors to show the combined strength of the 1-hour, 1-day, and 1-week timeframes, helping you spot strong trends at a glance (e.g., a bright mix for strong momentum, darker for weaker).
3. Enhanced Decision-Making
The background and histogram colors work together to confirm trends across different timeframes, making it less likely you’ll act on a false signal. This helps you feel more confident when deciding when to buy, sell, or hold.
4. Proactive Alert System
You can set alerts to notify you when the percentage of bullish timeframes hits your chosen levels (e.g., below 10% for bearish, above 90% for bullish). This keeps you in the loop on big momentum shifts without needing to watch the chart all day—perfect for when you’re busy.
5. Flexibility and Efficiency
You can turn timeframes on or off, adjust settings like speed of the moving averages, and tweak transparency to fit your trading style—whether you’re a fast scalper or a patient swing trader. Everything is shown on one chart, saving you effort, and the colors make it simple to read, even if you’re new to trading.
How to Use It
Getting Started
Add the Indicator: Load the "Multi-Timeframe MACD with Color Mix (Nikko)" onto your TradingView chart using the Pine Script editor or indicator library.
Pick Your Timeframes: Turn on the timeframes that match your trading—use 15m and 1h for quick trades, or 1d and 1w for longer holds—using the enable_15m, enable_1h, enable_1d, enable_1w, and enable_background options.
Reading the Colors
Background Gradient: Watch for red to signal bearish 15m momentum and green for bullish momentum. Adjust the Background_transparency (default 75%, or 25% opacity) if the chart feels too busy—try lowering it to 50 for clearer candlesticks in fast markets.
Histogram and EMA Colors:
The histogram and its Exponential Moving Average (EMA) line show a mix of red (1-week), green (1-day), and blue (1-hour) based on how strong the momentum is in each timeframe.
Brighter colors mean stronger momentum—white (all bright) shows all timeframes are pushing up hard, while darker shades (like gray or black) mean weaker or mixed momentum.
Turn off a timeframe (e.g., enable_1h = false) to see how it changes the color mix and focus on what matters to you.
Setting Alerts
Set Your Levels: Choose a threshold_low (default 10%) and threshold_high (default 90%) based on your comfort zone or past market patterns to catch big turns.
Get Notifications: Use TradingView alerts to get pings when the market hits your set levels, so you can act without staring at the screen.
Practical Tips
Pair with Other Tools: Use it with support/resistance lines or the RSI to double-check your moves and build a solid plan.
Tweak Settings: Adjust fast_length, slow_length, and signal_smoothing to match your asset’s speed, and bump up the lookback (default 50) for steadier trends in wild markets.
Practice First: Test different timeframe combos on a demo account to find what works best for you.
Understanding the Colors (Simple Explanation)
How Colors Work
The histogram and its EMA line use a color mix based on a simple idea from color theory, like mixing paints with red, green, and blue (RGB):
Red comes from the 1-week timeframe, green from 1-day, and blue from 1-hour.
When all three timeframes show strong upward momentum, they blend into bright white—the brightest color, like a super-bright light telling you the market’s roaring up.
If some timeframes are weak or pulling down, the mix gets darker (like gray or black), warning you the momentum might not be solid.
Brighter is Better
Bright Colors = Strong Opportunity: The brighter the histogram and EMA (closer to white), the more all your chosen timeframes are in agreement that prices are rising. This is your signal to think about buying or holding, as it points to a powerful trend you can ride.
Dark Colors = Caution: A darker mix (toward black) means some timeframes are lagging or bearish, suggesting you might wait or consider selling. It’s like a dim light saying, “Hold on, check again.”
Benefit in Practice: Watching the brightness helps you jump on the best trades fast. For example, a bright white histogram on a green background is like a green traffic light—go for it! A dark gray on red is like a red light—pause and rethink. This quick color check can save you from bad moves and boost your profits when the trend is strong.
Why It Helps
These colors are your fast friend in trading. A bright histogram means all your timeframes are cheering for an uptrend, giving you the confidence to act. A dull one tells you to be careful, helping you avoid traps. It’s like having a color-coded guide to pick the hottest market moments!
Technical Details
Input Parameters
Fast Length (default: 12): Short-term moving average speed.
Slow Length (default: 26): Long-term moving average speed.
Source (default: close): Price data used.
Signal Smoothing (default: 9): Smooths the signal line.
MA Type (default: EMA): Choose EMA or SMA.
Timeframe and Scaling
Timeframes: 15m, 1h, 1d, 1w, with on/off switches.
Lookback Period (default: 50): Sets the data window for trends.
Background Transparency (default: 75%): Controls background see-through level.
MACD Calculation
Per Timeframe: Uses request.security():
MACD Line: ta.ema(src, fast_length) - ta.ema(src, slow_length).
Signal Line: ta.ema(MACD, signal_length).
Histogram: (macd - signal) / 3.0.
Background Gradient
15m Normalization: norm_value = (hist_15m - hist_15m_min) / max(hist_15m_range, 1e-10), limited to 0-1.
RGB Mix: Red drops from 255 to 0, green rises from 0 to 255, blue stays 0.
Apply: color.new(color.rgb(r_val, g_val, b_val), Background_transparency).
Histogram and EMA Colors
Color Assignment:
1h: Blue (#0000FF) if hist_1h >= 0, else black.
1d: Green (#00FF00) if hist_1d >= 0, else black.
1w: Red (#FF0000) if hist_1w >= 0, else black.
Final Color: final_color = color.rgb(min(r, 255), min(g, 255), min(b, 255)).
Plotting: Histogram and EMA use final_color; MACD (#2962FF), signal (#FF6D00).
Alerts
Bullish Percentage: bullish_pct = (bullish_count / bullish_total) * 100, counting hist >= 0.
Triggers: Below threshold_low or above threshold_high.
--------------------------------------------------------------------
Conclusion
The "Multi-Timeframe MACD with Color Mix (Nikko)" is your all-in-one tool to spot trends, confirm moves, and trade smarter with its bright, easy-to-read colors. By using it wisely, you can sharpen your market edge and trade with more confidence.
This README is tailored for traders and reflects the indicator's practical value as of 05:06 AM +07 on October 04, 2025.

Intraday Key OpensIntraday Key Opens plots the key session and cycle opening prices: 90-minute cycles opens, New York open, Asia open, and 9:30 US market open. Each line is labeled, color-coded, and can be toggled on/off independently. Designed for intraday traders to quickly identify important price levels and session pivots.

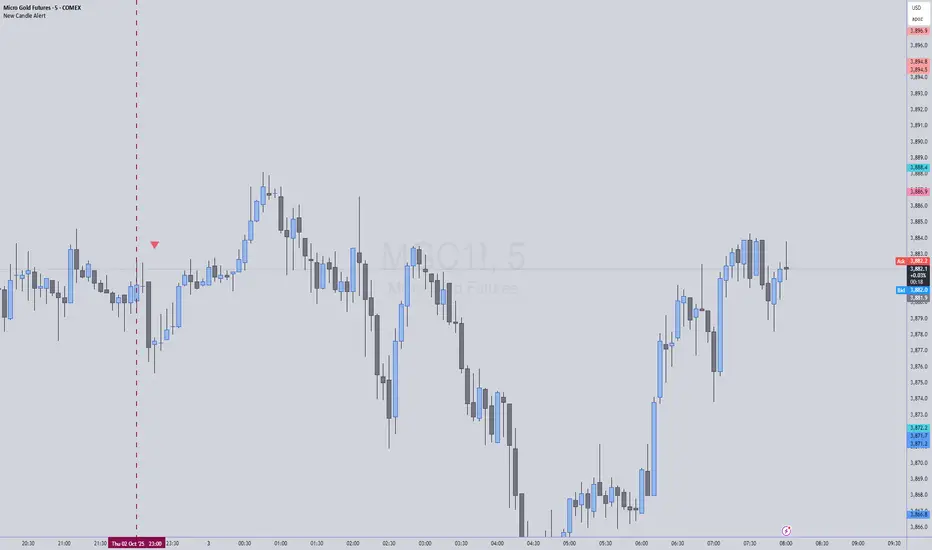
New Candle Alert with Time WindowJust needed a way to specify a time window on a timeframe and get alerts for each new candle
MFx Radar (Money Flow x-Radar)Description:
MFx Radar is a precision-built multi-timeframe analysis tool designed to identify high-probability trend shifts and accumulation/distribution events using a combination of WaveTrend dynamics, normalized money flow, RSI, BBWP, and OBV-based trend biasing.
Multi-Timeframe Trend Scanner
Analyze trend direction across 5 customizable timeframes using WaveTrend logic to produce a clear trend consensus.
Smart Money Flow Detection
Adaptive hybrid money flow combines CMF and MFI, normalized across lookback periods, to pinpoint shifts in accumulation or distribution with high sensitivity.
Event-Based Labels & Alerts
Minimalist "Accum" and "Distr" text labels appear at key inflection points, based on hybrid flow flips — designed to highlight smart money moves without clutter.
Trigger & Pattern Recognition
Built-in logic detects anchor points, trigger confirmations, and rare "Snake Eye" formations directly on WaveTrend, enhancing trade timing accuracy.
Visual Dashboard Table
A real-time table provides score-based insight into signal quality, trend direction, and volume behavior, giving you a full picture at a glance.
MFx Radar helps streamline discretionary and system-based trading decisions by surfacing key confluences across price, volume, and momentum all while staying out of your way visually.
How to Use MFx Radar
MFx Radar is a multi-timeframe market intelligence tool designed to help you spot trend direction, momentum shifts, volume strength, and high-probability trade setups using confluence across price, flow, and timeframes.
Where to find settings To see the full visual setup:
After adding the script, open the Settings gear. Go to the Inputs tab and enable:
Show Trigger Diamonds
Show WT Cross Circles
Show Anchor/Trigger/Snake Eye Labels
Show Table
Show OBV Divergence
Show Multi-TF Confluence
Show Signal Score
Then, go to the Style tab to adjust colors and fills for the wave plots and hybrid money flow. (Use published chart as a reference.)
What the Waves and Colors Mean
Blue WaveTrend (WT1 / WT2). These are the main momentum waves.
WT1 > WT2 = bullish momentum
WT1 < WT2 = bearish momentum
Above zero = bullish bias
Below zero = bearish bias
When WT1 crosses above WT2, it often marks the beginning of a move — these are shown as green trigger diamonds.
VWAP-MACD Line
The yellow fill helps spot volume-based momentum.
Rising = trend acceleration
Use together with BBWP (bollinger band width percentile) and hybrid money flow for confirmation.
Hybrid Money Flow
Combines CMF and MFI, normalized and smoothed.
Green = accumulation
Red = distribution
Transitions are key — especially when price moves up, but money flow stays red (a divergence warning).
This is useful for spotting fakeouts or confirming smart money shifts.
Orange Vertical Highlights
Shows when price is rising, but money flow is still red.
Often a sign of hidden distribution or "exit pump" behavior.
Table Dashboard (Bottom-Right)
BBWP (Volatility Pulse)
When BBWP is low (<20), it signals consolidation — a breakout is likely to follow.
Use this with ADX and WaveTrend position to anticipate directional breakouts.
Trend by ADX
Shows whether the market is trending and in which direction.
Combined with money flow and RSI, this gives strong confirmation on breakouts.
OBV HTF Bias
Gives higher timeframe pressure (bullish/bearish/neutral).
Helps avoid taking counter-trend trades.
Pattern Labels (WT-Based)
A = Anchor Wave — WT hitting oversold
T = Trigger Wave — WT turning back up after anchor
👀 = Snake Eyes — Rare pattern, usually signaling strong reversal potential
These help in timing entries, especially when they align with other signals like BBWP breakouts, confluence, or smart money flow flips.
Multi-Timeframe (MTF) Consensus
The system checks WaveTrend on 5 different timeframes and gives:
Color-coded signals on each TF
A final score: “Mostly Up,” “Mostly Down,” or “Mixed”
When MTFs align with wave crosses, BBWP expansion, and hybrid money flow shifts, the probability of sustained move is higher.
Divergence Spotting (Advanced Tip)
Watch for:Price rising while money flow is red → Possible trap / early exit
Price dropping while money flow is green → Early accumulation
Combine this with anchor-trigger patterns and MTF trend support for spotting bottoms or tops early.
Final Tips
Use WT trigger crosses as initial signal. Confirm with money flow direction + color flip
Look at BBWP for breakout timing. Use table as your decision dashboard
Favor trades that align with MTF consensus

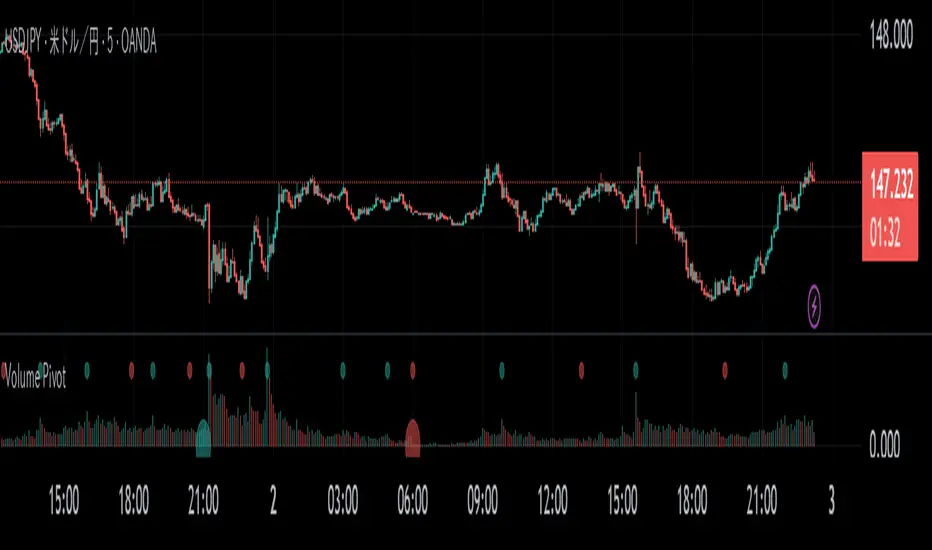
Volume PivotOVERVIEW
Volume Pivot is a technical analysis tool for TradingView designed to identify key turning points in the market by focusing on volume rather than price. It detects peaks and troughs (pivots) in trading volume to pinpoint moments of maximum market interest or exhaustion.
This indicator performs its analysis on both the Current Timeframe (CTF) and a user-defined Higher Timeframe (HTF). This dual-perspective approach allows traders to simultaneously grasp short-term market reactions and long-term structural shifts, leading to more informed and high-conviction trading decisions.
FEATURES
Automatic Pivot Detection
Automatically identifies and plots Volume Pivot Highs (peaks) and Pivot Lows (troughs) based on a user-defined Lookback Length.
Dual Timeframe Display
- CTF Signals : Plotted as tiny circles directly above the corresponding volume bars for immediate, short-term context.
- HTF Signals : Plotted as slightly larger circles at the bottom of the indicator pane, making them easy to distinguish as signals of higher significance.
Flexible HTF Configuration
Customize which higher timeframe to use for analysis based on your current chart timeframe. For example, you can set the indicator to reference the 1-hour chart as the HTF when you are on the 5-minute chart, and the Daily chart as the HTF when you are on the 1-hour chart.
Intuitive Volume Bars
The volume bars are color-coded to show whether volume is increasing (bullish color) or decreasing (bearish color) compared to the previous bar, offering a quick visual gauge of market momentum.
Full Customization
Easily toggle the visibility of CTF and HTF signals and customize the colors for bullish and bearish pivots to match your charting preferences.
MK_OSFT-Momentum Confluence DetectorMOMENTUM CONFLUENCE DETECTOR - Trading Indicator Overview
What This Indicator Does
The Momentum Confluence Detector is a comprehensive Pine Script indicator designed to identify high-probability trading opportunities by detecting momentum bars that align with multiple confluence factors. It combines traditional technical analysis with advanced Smart Money Concepts to filter out noise and highlight the most significant price movements.
CORE FUNCTIONALITY
📊 Momentum Bar Detection Identifies unusual volume and bar size expansion using customizable multipliers
Detects bullish, bearish, and neutral momentum bars based on OHLC relationships
Uses moving averages to establish baseline volume and bar size thresholds
🔄 Multi-Filter Confluence System
The indicator employs up to 5 different filter types to validate momentum signals:
Level Concept Filter - Choose between:
- Support/Resistance Levels : Traditional pivot-based S/R zones with touch counting and break tracking
- Smart Money Concepts : Institutional order flow analysis including Order Blocks, Fair Value Gaps (FVGs), and market structure breaks
Trend Filter : EMA/SMA-based trend direction confirmation with alignment requirements
Breakout Filter : Detects price breakouts beyond recent highs/lows with percentage thresholds
Volatility Filter : ATR expansion confirmation to ensure signals occur during active market conditions
Market Session Filter : Filters signals to specific trading sessions (Tokyo, London, New York)
ADVANCED FEATURES
🎯 Smart Money Concepts Integration
Order Blocks : Identifies institutional supply/demand zones from major and minor structure breaks
Fair Value Gaps (FVGs) : Detects price imbalances and tracks their evolution through partial fills and inversions
Market Structure : Recognizes Break of Structure (BOS) and Change of Character (CHoCH) patterns
Retracement Patterns : Tracks HLH (Higher-Low-Higher) and LHL (Lower-High-Lower) institutional patterns
📈 Support/Resistance System
Multi-timeframe pivot detection (3, 5, 7-bar spans)
Volume-weighted strength calculation for level importance
Dynamic level merging and break tracking
Automatic level type classification (Support/Resistance/Flip zones)
⚙️ Intelligent Filtering Logic
ALL Mode : Requires all enabled filters to pass (high precision)
ANY Mode : Requires at least one filter to pass (higher frequency)
Real-time filter status tracking and visualization
Visual Features
Signal Markers : Clear triangular markers for qualified momentum bars
Unfiltered Signals : Optional display of raw momentum bars for comparison
Level Visualization : Dynamic S/R level boxes and lines with strength indicators
Structure Lines : BOS/CHoCH break visualization with major/minor classification
Fair Value Gaps : Color-coded boxes showing bullish/bearish FVGs with partial fill tracking and IFVG conversion
Order Blocks : Institutional supply/demand zones displayed as colored boxes with major/minor classification
Information Table : Real-time display of signal details and filter status
Session Boxes : Visual representation of active trading sessions
Practical Applications
✅ Swing Trading : Identify high-probability reversal and continuation setups
✅ Day Trading : Spot intraday momentum shifts with institutional backing
✅ Multi-Timeframe Analysis : Combine major and minor structure analysis
✅ Risk Management : Filter out low-quality setups using confluence requirements
✅ Educational : Understand market structure and institutional order flow
Customization Options
Adjustable momentum thresholds for different market conditions
Comprehensive filter settings with individual enable/disable controls
Visual customization for colors, sizes, and display preferences
Alert system with detailed signal information
Performance optimization settings for different chart timeframes
Who Should Use This Indicator
This indicator is suitable for traders who:
Want to combine multiple technical analysis approaches
Seek to understand institutional market behavior
Prefer confluence-based trading setups
Need customizable filtering for different market conditions
Value comprehensive signal validation over high-frequency alerts
The Momentum Confluence Detector transforms complex market analysis into clear, actionable signals by requiring multiple forms of confirmation before highlighting trading opportunities.

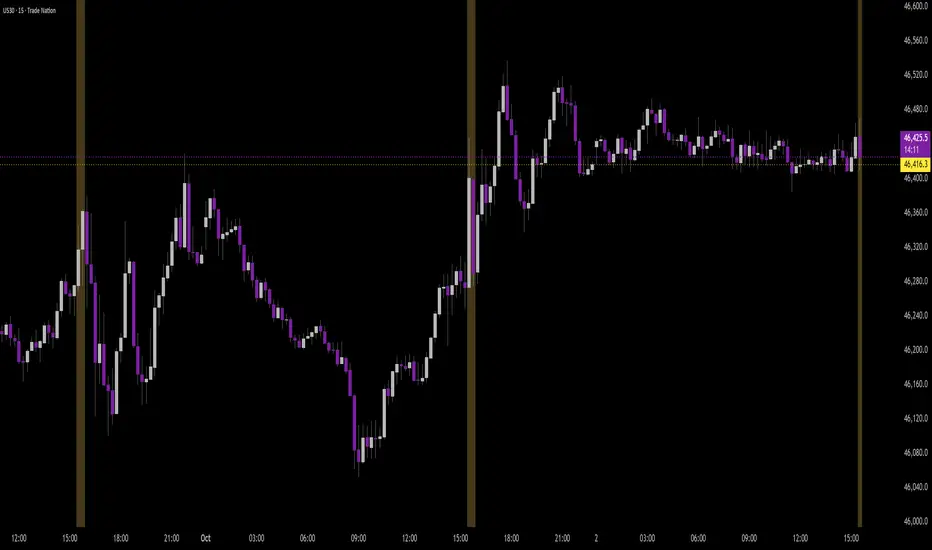
Time Range by exp3rtsTime Window highlights a custom time range directly on your chart, helping you focus on specific market sessions or trading hours.
Key Features:
Highlights a custom time range with a shaded background
Fully adjustable start and end time (hour & minute)
Supports multiple time zones (e.g., GMT, UTC, Europe/Berlin)
Optional market color shading inside the window (bull/bear neutral tone)
Use Cases:
Mark London Open, New York Session, or any session overlap
Focus on high-probability trading hours
Visualize your backtesting timeframe or algo activity window
Track premarket or after-hours activity for futures or indices
Customization:
Set the beginning and end time in your local or exchange time zone
Choose your timezone string (e.g., "GMT", "Etc/UTC", "America/New_York")
Automatically colors candles in the time window for easy visibility
Stoch + RSI DashboardIndicator Description
MTF Stochastic + RSI Dashboard FLEX with STRONG Alerts
A compact, multi-timeframe dashboard that shows Stochastic %K/%D, RSI and signal states across user-defined timeframes. Columns can be toggled on/off to keep the panel as small as you need. Signal texts and colors are fully customizable. The table can be placed in any chart corner, and the background color & opacity are adjustable for perfect readability.
What it shows
• For each selected timeframe: %K, %D, a signal cell (Bullish/Bearish/Strong), RSI value, and RSI state (Overbought/Oversold/Neutral).
• Timeframes are displayed as friendly labels (e.g., 60 → 1h, W → 1w, 3D → 3d).
Signals & logic
• Bullish/Bearish when %K and %D show a sufficient gap (or an optional confirmed cross).
• Strong Bullish when both %K and %D are below the “Strong Bullish max” threshold.
• Strong Bearish when both %K and %D are above the “Strong Bearish min” threshold.
• Optional confirmation: RSI < 30 for Strong Bullish, RSI > 70 for Strong Bearish.
Alerts
• Global alerts for any selected timeframes when a STRONG BULLISH or STRONG BEARISH event occurs.
Key options
• Column visibility toggles (TF, %K, %D, Signal, RSI, RSI Status).
• Custom signal texts & colors.
• Dashboard position: top-left / top-right / bottom-left / bottom-right.
• Table background color + opacity (0 = opaque, 100 = fully transparent).
• Sensitivity (minimum %K–%D gap) and optional “cross-only” mode.
• Customizable timeframes for display and for alerts.
Default settings
• Stochastic: K=5, D=3, SmoothK=3
• RSI length: 14
• Decimals: 1
• Strong Bullish max: 20
• Strong Bearish min: 80
• Default TFs & alerts: 3m, 15m, 1h, 3h, 6h, 12h, 1d, 3d, 1w

RD-DynamicTSMADescription of the RD-DynamicTSMA Pine Script Indicator:
This single indicator dynamically adjusts the three SMAs to key periods used by professional traders across timeframes:
Daily: 10, 21, 50 periods (standard for swing trading trends).
Weekly+: 10, 21, 30 periods (optimized for positional & longer-term views).
Lengths auto-update on timeframe switches.

Market Structure DashboardThis indicator displays a **multi-timeframe dashboard** that helps traders track market structure across several horizons: Monthly, Weekly, Daily, H4, H1, M15, and M5.
It identifies the current trend (Bullish, Bearish, or Neutral) based on the progression of **swing highs and lows** (HH/HL, LH/LL).
For each timeframe, the dashboard shows:
* The **current structure** (Bullish, Bearish, Neutral) with a clear color code (green, red, gray).
* **Pivot information**:
* either the latest swing high/low values,
* or the exact date and time of their occurrence (user-selectable in the settings).
An integrated **alert system** notifies you whenever the market structure changes (e.g., "Daily: Neutral → Bullish").
### Key Features:
* Clear overview of multi-timeframe market structures.
* Customizable pivot info display (values or timestamps).
* Built-in alerts on trend changes.
* Compact and readable dashboard, displayed in the top-right corner of the chart.
This tool is ideal for traders who want to quickly assess the **overall market structure** across multiple timeframes and be instantly alerted to potential reversals.

Swing Dashboard - Pro Trader Metrics with MTF & Enhanced VolumeDESCRIPTION:
A comprehensive real-time dashboard designed for swing traders and active investors trading US equities. Displays all critical metrics in one customizable panel overlay - no need to clutter your chart with multiple indicators.
KEY FEATURES:
📊 Relative Strength Analysis:
Stock vs Market (SPY/QQQ/IWM/DIA)
Stock vs Sector (automatic sector ETF detection)
Sector vs Market comparison
Customizable lookback period (5-60 days)
📈 Price & Range Metrics:
Daily range, change, and gap percentages
Distance from SMA20, SMA50, VWAP
52-week position percentage
ATR% and ADR% for volatility assessment
Range/ADR ratio for breakout detection
💪 Advanced Volume Analysis:
RVOL (full day volume vs 20-day average)
Volume Strength (bar-by-bar analysis)
Volume Trend (5-day vs 20-day momentum)
Customizable RVOL alert thresholds
Non-repainting volume calculations
⚙️ Multi-Timeframe (MTF) Mode:
View daily charts with 5-min or 15-min metric updates
Perfect for monitoring positions without switching timeframes
All calculations remain accurate across timeframes
🎨 Fully Customizable:
Choose which metrics to display
9 position options for the dashboard
Adjustable text size and colors
Toggle individual metrics on/off
Sector-specific ETF mapping for accurate RS calculations
TECHNICAL SPECIFICATIONS:
✅ Non-repainting - all calculations use confirmed bar data
✅ No lookahead bias or future data
✅ Optimized for US stocks with proper sector mapping
✅ Works on any timeframe (best on 5m-Daily)
✅ Pine Script v6 with best practices
✅ Handles edge cases and missing data gracefully
IDEAL FOR:
Swing traders monitoring multiple positions
Day traders needing quick metric overview
Investors tracking relative strength and momentum
Anyone who wants institutional-grade metrics in one place
SECTOR ETF MAPPING:
Automatically maps to correct sector ETFs: XLK, XLF, XLV, XLY, XLP, XLE, XLB, XLI, XLRE, XLC, XLU
HOW TO USE:
Green = Positive/Strong | Red = Negative/Weak | White = Neutral
RS > 0 = Outperforming benchmark/sector
RVOL > 1.5x = High volume day
VWAP% negative = Price below VWAP (mean reversion opportunity)
R/ADR > 100% = Extended range (potential exhaustion)
Perfect for traders who need professional-grade analysis without chart clutter.
TAGS:
dashboard, swing, relativestrengrh, sectoranalysis, volume, rvol, multitimeframe, mtf, tradingdashboard, metrics, daytrading, swingtrading, momentum, vwap, atr, volatility, volumeanalysis

Predicted Funding RatesOverview
The Predicted Funding Rates indicator calculates real-time funding rate estimates for perpetual futures contracts on Binance. It uses triangular weighting algorithms on multiple different timeframes to ensure an accurate prediction.
Funding rates are periodic payments between long and short position holders in perpetual futures markets
If positive, longs pay shorts (usually bullish)
If negative, shorts pay longs (usually bearish)
This is a prediction. Actual funding rates depend on the instantaneous premium index, derived from bid/ask impacts of futures. So whilst it may imitate it similarly, it won't be completely accurate.
This only applies currently to Binance funding rates, as HyperLiquid premium data isn't available. Other Exchanges may be added if their premium data is uploaded.
Methods
Method 1: Collects premium 1-minunute data using triangular weighing over 8 hours. This granular method fills in predicted funding for 4h and less recent data
Method 2: Multi-time frame approach. Daily uses 1 hour data in the calculation, 4h + timeframes use 15M data. This dynamic method fills in higher timeframes and parts where there's unavailable premium data on the 1min.
How it works
1) Premium data is collected across multiple timeframes (depending on the timeframe)
2) Triangular weighing is applied to emphasize recent data points linearly
Tri_Weighing = (data *1 + data *2 + data *3 + data *4) / (1+2+3+4)
3) Finally, the funding rate is calculated
FundingRate = Premium + clamp(interest rate - Premium, -0.05, 0.05)
where the interest rate is 0.01% as per Binance
Triangular weighting is calculated on collected premium data, where recent data receives progressively higher weight (1, 2, 3, 4...). This linear weighting scheme provides responsiveness to recent market conditions while maintaining stability, similar to an exponential moving average but with predictable, linear characteristics
A visual representation:
Data points: ──────────────>
Weights: 1 2 3 4 5
Importance: ▂ ▃ ▅ ▆ █
How to use it
For futures traders:
If funding is trending up, the market can be interpreted as being in a bull market
If trending down, the market can be interpreted as being in a bear market
Even used simply, it allows you to gauge roughly how well the market is performing per funding. It can basically be gauged as a sentiment indicator too
For funding rate traders:
If funding is up, it can indicate a long on implied APR values
If funding is down, it can indicate a short on implied APR values
It also includes an underlying APR, which is the annualized funding rate. For Binance, it is current funding * (24/8) * 365
For Position Traders: Monitor predicted funding rates before entering large positions. Extremely high positive rates (>0.05% for 8-hour periods) suggest overleveraged longs and potential reversal risk. Conversely, extreme negative rates indicate shorts dominance
Table:
Funding rate: Gives the predicted funding rate as a percentage
Current premium: Displays the current premium (difference between perpetual futures price and the underlying spot) as a percentage
Funding period: You can choose between 1 hour funding (HyperLiquid usually) and 8 hour funding (Binance)
APR: Underlying annualized funding rate
What makes it original
Whilst some predicted funding scripts exist, some aren't as accurate or have gaps in data. And seeing as funding values are generally missing from TV tickers, this gives traders accessibility to the script when they would have to use other platforms
Notes
Currently only compatible with symbols that have Binance USDT premium indices
Optimal accuracy is found on timeframes that are 4H or less. On higher timeframes, the accuracy drops off
Actual funding rates may differ
Inputs
Funding Period: Choose between "8 Hour" (standard Binance cycle) or "1 Hour" (divides the 8-hour rate by 8 for granular comparison)
Plot Type: Display as "Funding Rate" (percentage per interval) or "APR" (annualized rate calculated as 8-hour rate × 3 × 365)
Table: Toggle the information table showing current funding rate, premium, funding period, and APR in the top-right corner
Positive Colour: Sets the colour for positive funding rates where longs pay shorts (default: #00ffbb turquoise)
Negative Colour: Sets the colour for negative funding rates where shorts pay longs (default: red)
Table Background: Controls the background colour and transparency of the information table (default: transparent dark blue)
Table Text Colour: Sets the colour for all text labels in the information table (default: white)
Table Text Size: Controls font size with options from Tiny to Huge, with Small as the default balance of readability and space

HTF Candle Highs and Lows with Labels + High Probability Signals█ OVERVIEW
This indicator overlays Weekly, Daily, and H4 High/Low levels directly onto your chart, allowing traders to visualize key support and resistance zones from higher timeframes. It also includes high probability breakout signals that appear one candle after a confirmed breakout above or below these levels, filtered by volume and candle strength.
Use this tool to identify breakout opportunities with greater confidence and clarity.
█ FEATURES
• Plots Weekly, Daily, and H4 High and Low levels using request.security. • Customizable line colors, widths, and label sizes. • Toggle visibility for each timeframe independently. • Signals appear one candle after a confirmed breakout: • Bullish: Close above HTF High, strong candle, high volume. • Bearish: Close below HTF Low, strong candle, high volume. • Signal shapes match the color of the broken level for visual clarity.
█ HOW TO USE
1 — Enable the timeframes you want to track using the input toggles. 2 — Watch for triangle-shaped signals: • Upward triangle = Bullish breakout. • Downward triangle = Bearish breakout. 3 — Confirm the breakout: • Candle closes beyond the HTF level by at least 0.1%. • Candle body shows momentum (close > open for bullish, close < open for bearish). • Volume exceeds 20-period average. 4 — Enter trade on the candle after the signal. 5 — Use the HTF level as a reference for stop-loss placement. 6 — Combine with other indicators (e.g., RSI, EMA) for confluence.
█ LIMITATIONS
• Signals may lag by one candle due to confirmation logic. • Not optimized for low-volume assets or illiquid markets. • Best used in trending environments; avoid during consolidation. • Does not include automatic alerts (can be added manually).
█ BEST PRACTICES
• Use on H1 or higher timeframes for cleaner signals. • Avoid trading during news events or low volatility. • Backtest thoroughly before live trading. • Adjust breakout percentage and volume filter based on asset volatility. • Maintain a trading journal to track performance.
