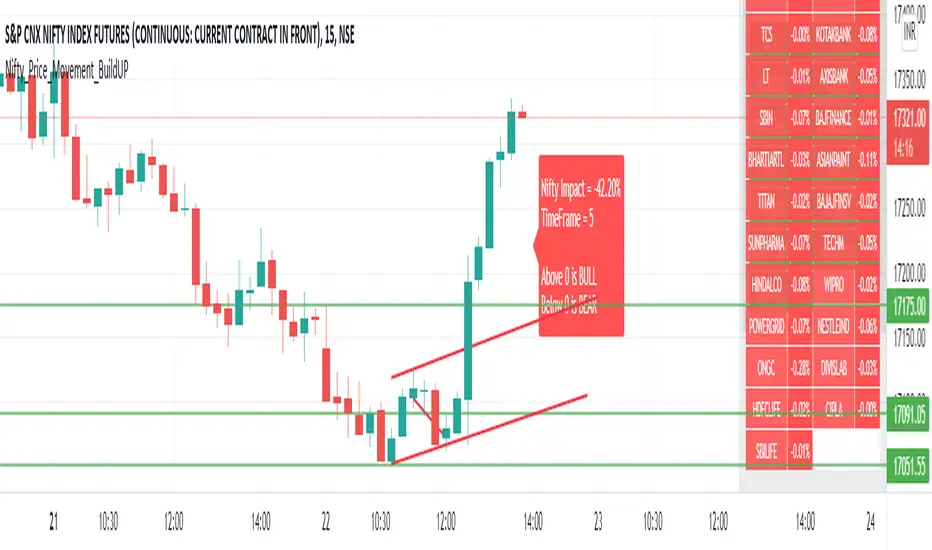
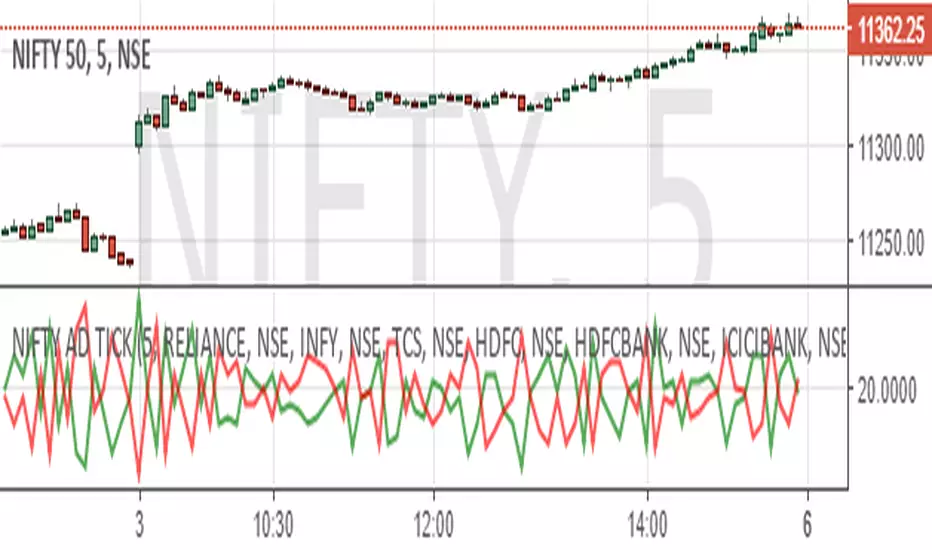
Nifty_Price_Movement_BuildUPDashboard to see Price Momentum Build-Up at Nifty.
It cumulates all prices and their respective weightage.
During initial of a candle, we are not aware of volume is High or Not, we only get it in later buildup. But Price buildup will display it at the same instant that what is going with the price of all stocks.
The logic used here is that
1) If a stock close > open at a particular instant it will add that stock multiplied with its weightage in Nifty to the list of stocks that are positive.
2) If a stock close < open at a particular instant it will add that stock multiplied with its weightage in Nifty to the list of stocks that are negative.
3) Above two will give you data that how many of them are positive and are negative at a particular instant and how they are going to affect Nifty.
In one of the many possible ways, it is superior than that of Volume buildup is that, to determine volume is higher than previous volume, we have to wait for first few seconds/minutes/hours (depending on timeframe you are in) to see volume buildup. The Volume buildup function based indicator is kind of lagging, though volume itself being instant.
Nse
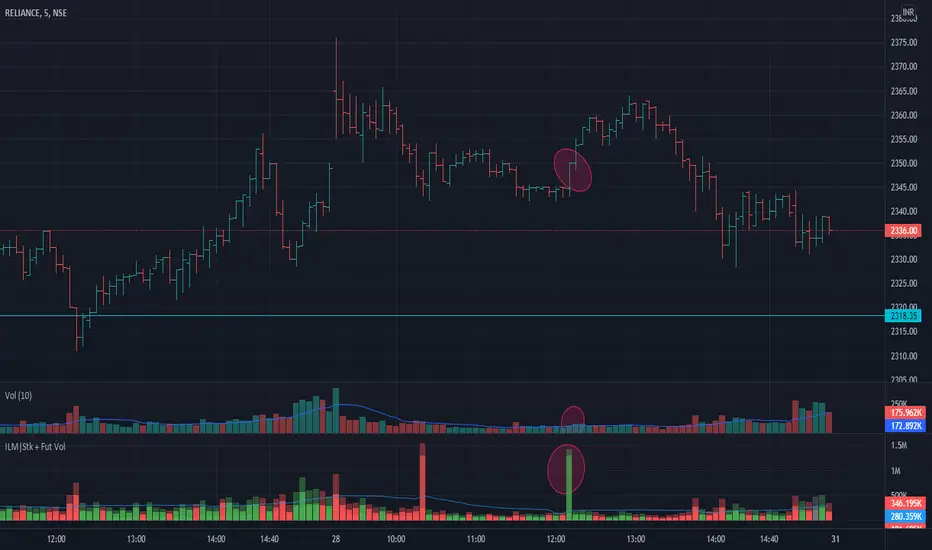
Volume Indicator NSE + BSE + Future Current & Next MonthThis indicator combines all the volumes from both the NSE & BSE exchanges as well as Future volumes ( Current Month & Next Month) if the symbol is available in FnO
Indicator shows 3 volumes
Total Volume = NSE + BSE + Current Month + Next Month
Stock Volume = NSE + BSE
Future volume = Current Month + Next Month
Benefits
As shown in the chart above, price shot up as the volume appeared in BSE but not NSE. These conditions can be caught easily and right decisions can be made
Since Future volumes are also combined, it gives an accurate picture of volumes on any given instrument during last of week of monthly expiries when contract rollovers happen
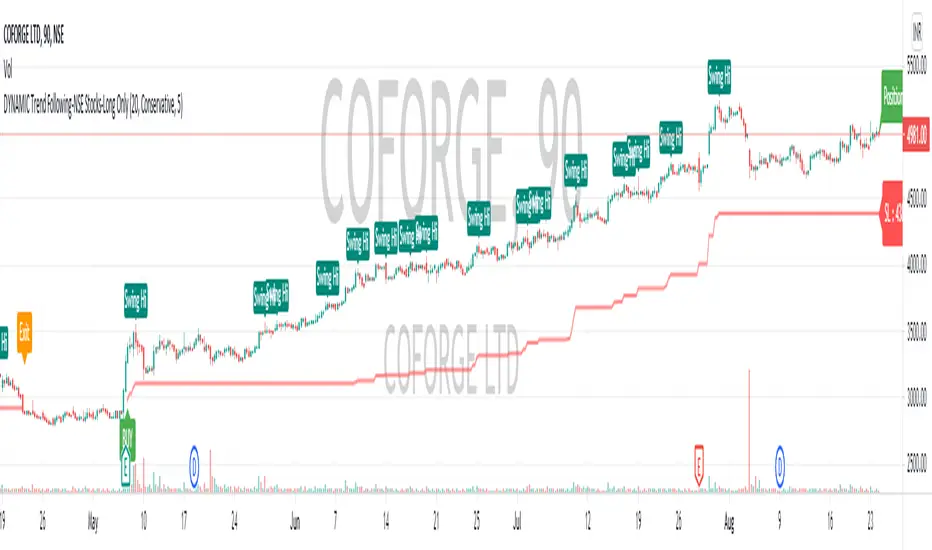
DYNAMIC Trend Following-NSE Stocks-Long OnlyMotivation
The momentum feature is well known and researched in the market. Momentum trades/signals often result in out sized positive returns when trades go well in their favor. At the same time, almost all momentum methods/signals suffer from frequent, small and multiple losses.
Dynamic indicator/system is a proprietary systematic method designed to capture momentum on Indian Indices of NIFTY and BANKNIFTY . It aims to identify bullish / bearish patterns in a systematic manner and uses volatility adjusted entry levels and trailing points. The method employs a proprietary method to filter out market noise from an underlying trend to ensure whipsaws arising from a trend-following method are removed. These patterns can be found in several well known books such as those of LA Little and Market Wizards series. We have combined well known existing patterns into a proprietary pattern that improves the performance. It is similar to combining Moving Average and RSI to get confirmations into a single system.
The current indicator is a Long-Only investment strategy for NSE(INDIA) Stocks.
Trade Usage
The indicator can be used either as a standalone indicator/method or can be used as an additional confirmation to your stock analysis. If you have a knack of picking stocks or if you deploy any other system to pick stocks, this can add systematic entry and exits to your Stock Analysis.
Time Frame
This indicator can work best if you use a bit of Multi-Time Frame analysis. Depending on your expected holding period, here are a few suggestions:
Investing - Holding period of a few Weeks to Months - Use Daily Charts and 2-Hr Charts
Swing Trading - Holding period of a few Days to Weeks - Use 90-Minute Charts and 30-Minute Charts
You can use any other time frame combinations that may suit your style.
Elements of the indicator
BUY - They depict the BUY Signal at the open of that bar.
Scale-In (Optional) - If your risk appetite permits, you can potentially scale-in at these times. These are signals which come only when a prior Buy signal is on.
Stop Loss - Anytime the system generates a Buy Signal, it will also generate an initial SL level. This SL level is updated at close of each bar and adapts to volatility and trend in the market.
Customizable Parameters
Here are a few things that can be customized:
Input Parameters:
Volatility Lookback - The lookback period that affects the trailing SL and entry exit signals. Default value is 20 Bars, but you may want to edit on the basis of your time frame.
Risk Mode - This comes with three options - Conservative, Moderate, Aggressive. It is a good idea to Enter Positions on Conservative Mode and then trail it on Moderate. Aggressive should rarely be used.
Colors - All labels and plots on the chart can be customized for colors. Look under 'Style' settings.
How to obtain access?
Please PM the publisher of script to request access or refer to details in signature below.
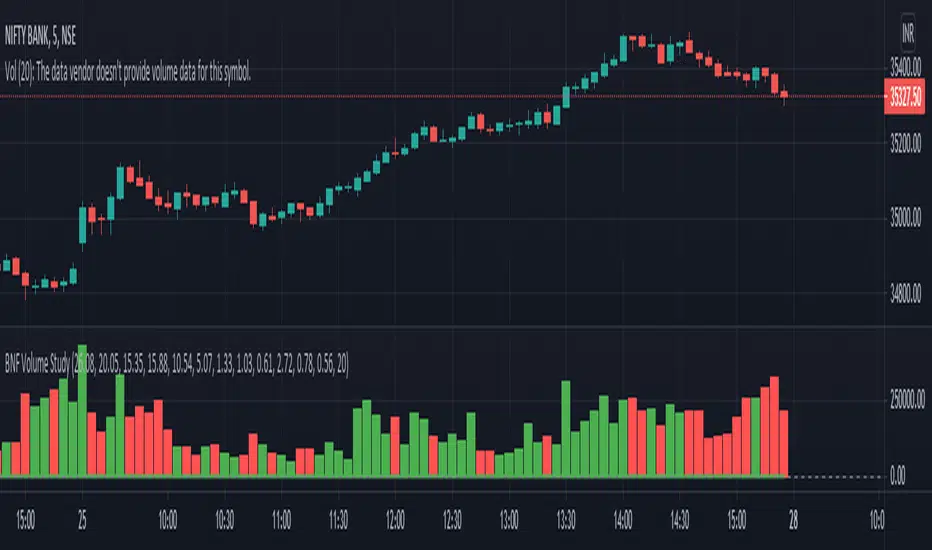
Trade Vertex - Bank Nifty Volume IndicatorNSE:BANKNIFTY
We all know that the value of an Bank Nifty is derived from top banking sector underlying stocks.
The value of Bank Nifty is calculated from free float market capitalization.
Using the same formula, I made an indicator on the bases of weighted volume of each stock.
This indicator will help you to plot Volume on Bank Nifty.
Screener: Alpha & Beta IndexThis is a Index Screener which can short list the major Sectors contributing to NIFTY movement that day.
This helps in sector based trading, in which we can trade in the stocks which falls under that particular sector.
No need to roam around all the stocks in the whole watchlist.
It is recommended to create sector wise watchlist of all sectors. It will be easier to concentrate in only one sector.
For example in IT sector index there are certain stocks which contribute to the movement of IT sector.
This will be available in NSE (or exchange website).
For detailed description check out the descriptions in my previous 2 Alpha and Beta indicators.
Combine and use this screener with my previous Alpha & Beta indicator.

Alpha & BetaHow to use Alpha(α)?
If Alpha is positive the stock outperforms, if the value is negative means the stock underperforms.
α < 0: The investment has earned too little for its risk (or, was too risky for the return)
α = 0: The investment has earned a return adequate for the risk taken
α > 0: The investment has a return in excess of the reward for the assumed risk
How to use Beta(β)?
β = 1: Exactly as volatile as the index
β > 1: More volatile than the index
β < 1 > 0: Less volatile than the index
β = 0: Uncorrelated to the index
β < 0: Negatively correlated to the index
β > 2: Trending stock
Higher the β higher risk/reward
Example: If the beta is 1.1, the share price is like to move by 10% more than the index
Trading Tip
Choose a stock with Alpha greater than 0 and Beta greater than 1.9 for intraday in 5min timeframe for long positions
Remember that such stocks will have high risk and high reward
Shortlist stocks with Beta greater than 1.9 for next day in 5min timeframe

IPB_AOPM_BOThis is an intraday trading strategy.
Concept :
Underlying concept is that Amateurs open the market and Professionals close the market. Hence this system tries to capture the breakout in the afternoon session. After One PM Breakout (AOPM breakout). This essentially means that one has to go long once the high of the market till 1 pm is broken out and similarly go short once the low of the market till 1 pm is broken down.
Position sizing:
This strategy assumes taking 10 lots of Indian Market Index which approximately requires a margin of around INR 25,00,000. Hence capital is chosen as INR 25,00,000. Currency is assumed to be INR , however the system shows USD as currency as there is no INR option available. Commissions assumed to be at INR 50 per order as against the INR 20 per charged by retail brokers in India in real world market.
Disclaimer:
Past performance is not representative of future performance. Hence the author is not responsible for any trading loss arising out of implementing this strategy. Hence please implement at your own risk. Trading can result in loss of entire capital.

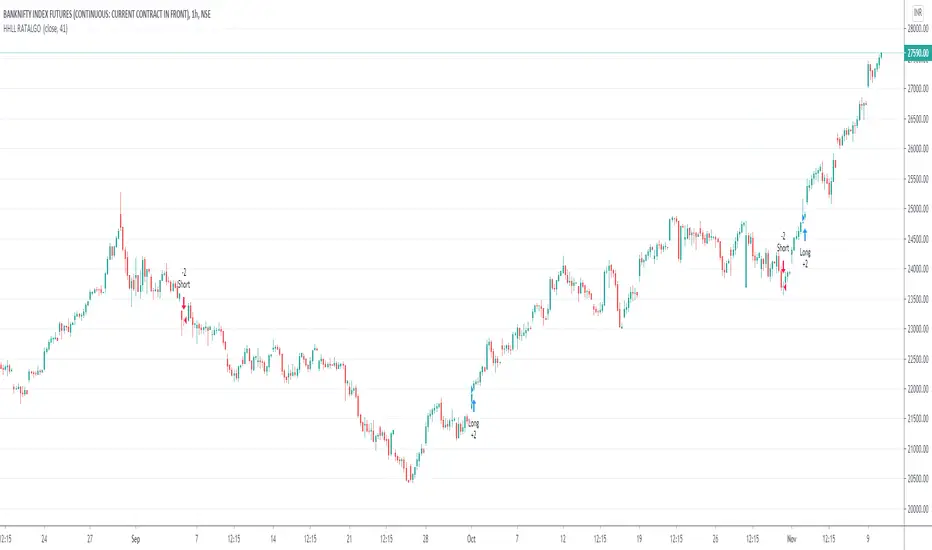
HigherHigh LowerLow RATALGOHi Traders,
This is Trend following strategy.
This strategy calculates the higher high or lower low of a look back period. If the previous high or low is breached, a signal to enter market is given.
This strategy works well with regular candles and line charts if you find the right settings and chart time frame.
Give it a try with your settings & post your feedback and suggestion if any for improvement.
I had automate this strategy with broker using Trading view Alert feature to get some live results on NSE:Banknifty1!
BANKNIFTY - Anchored VWAP
An attempt to make Anchored VWAP for NSE:BANKNIFTY from Volume of underlying securities.
Notes :
- To cross check one may verify by changing Symbol to any stock and use in-built VWAP indicator
- Works only with BANKNIFTY and stocks. Does not work with other NSE Indices

Aditya Banknifty-2 IndicatorThis indicator is designed for Banknifty which is traded on NSE(India). It works best in 1-M and 5-M time-frame. You can always experiment with any other time-frame with various combinations of settings.
Green Line- Buy Trigger Line
Red Line- Sell Trigger Line
Period: No. bars for look-back period.
Trade Trigger Type:
1. ATR Based – Trade will be initiated based on ATR values.
For 1M time-frame: Trigger ATR Bars=7
ATR Multiplier = 3.1
For 5M time-frame: Trigger ATR Bars=7
ATR Multiplier = 0.5
2. Fixed - – Trade will be initiated based on particular fixed value.
3. % of Close - Trade will be initiated based on % of Close of script.
Take Partial Profit: Whether to book partial or not.
Partial Profit Points: It always better to book partial profit after getting into the trade. We can book 1 quantity after our partial profit target is hit by making Order Size=2 and let the remaining quantity in the trade until the reversal of trend.
Disclaimer: This script/strategy is for educational purpose and individual use only. The author of this script/strategy will not accept any liability for loss or damage as a result of reliance on the information contained in the charts. Please be fully informed regarding the risks and costs associated with trading the financial markets.
This is a premium indicator so send me a private message for access.
Use the link below to obtain access to this indicator.

Trend Following Algo by Technicaltrader615 for BankniftyThis is an Intraday Trend Following System developed for Trading the Bank nifty Index. It couples traditional trend following with Momentum and Price action. The trades are Entered and Exited the Same day. If Old buy signal is continuing, system wont take trade, System will wait for new signals. For continuation or re entry there is a separate program which is under development.
This can be applied to Futures segment and Options Also. Options you have to understand parameters like Expiry, Strike Price, IV etc; Future trading is recommended compared to option as the system is tested with futures.
For more Details you can contact thru trading view chat window. You can also scroll down for my signature. There will not be any trail period.

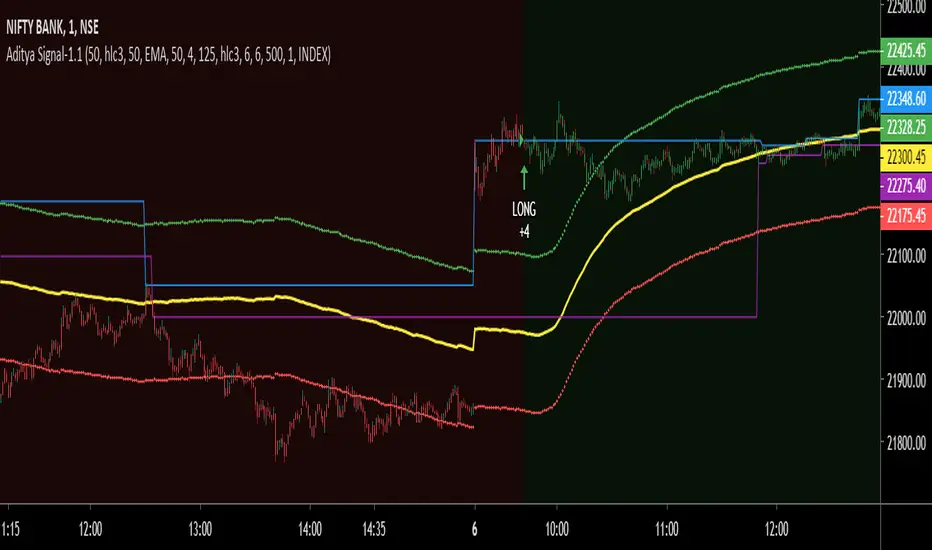
Aditya Signal 1.1 BankNifty Intra-Day Trading IndicatorThis is non-repainting indicator which can be used for Index, Stocks, Commodities and Bitcoin or any other securities depending upon the various parameter setting of the indicator. This particular strategy is for intra-day Bank Nifty Index which is traded on NSE(India). The same strategy can used for Nifty, Stocks and other indices also by adjusting the inputs.
The detailed description about the indicator is as follows:
Long Period: Period for calculating Primary Signal Line (Yellow).
Long Period Input Source: Input for calculating Primary Signal Line.
Short Period: Period for smoothing the Primary Signal Line.
Short Period MA: Method for smoothing the Primary Signal Line.
No. of ATR Bars: No. of ATR bars for calculating Primary Signal Line.
ATR Multiplier: ATR multiplier for ATR calculation.
Trade Trigger: Value above or below of Primary Signal Line for Long or Short signal. The dotted lines in Green and Red color represents the same.
Bar Crossover Input Source: Current bar input for additional signal confirmation above or below Primary Signal Line.
Bars Above Signal High: No. of bars closing above Secondary Signal Line (Blue)
Bars Below Signal Low: No. of bars closing above Secondary Signal Line (Purple)
No. of bars crossover method uses certain no. of bars for closing above High or Low of the crossover of closing price and the Primary Signal Line in combination with Trade Trigger. The idea behind this design is to avoid fake signal due sudden spike in price. Also, this ensures that price consolidates above High in case of Long signal confirmation and vice-versa. By increasing no. of such bars, we can anticipate, how much time it takes for short-term and long-term trend reversal.
Depending upon the time-frame, just by observing the High and Low of previous crossover of closing price and Primary Signal Line, we will have better understanding of undercurrent of market.
By using different combination of Trade Tigger value and no. of bars above and below, we can anticipate better trend confirmation.
The various combinations of price source of Long Period Input Source and Bar Crossover Input Source, the Short Period MA method shows promising results. Kindly PM me for these optimum settings for other financial instruments.
It always better to book partial profit after getting into the trade which increases the odds. The default trade quantity is 2. We book 1 quantity after our partial profit target is reached and let the remaining quantity be in the trade until the reversal of trend. By enabling or disabling the same we can determine the profit or loss from historical trade from when the trade quantity is 1. Just remember to change the default quantity to 1 in Order Size from properties when you disable the Take Partial Profit option.
Take Partial Profit: Whether to book partial or not as explained above.
Partial Profit Points: It always better to book partial profit after trend getting into the trade. The default trade quantity is 2. We book 1 quantity after our partial profit target is hit and let the remaining quantity in the trade until the reversal of trend.
Instrument Type: We can select the which instrument for analysis. By adjusting the Take Partial Profit value by selecting Other Option, you can analyze instrument of your choice other than mentioned in the list for Partial Profit depending upon stock tick value and lot quantity or you can PM me. I have adjusted value for Crude Oil and Silver for MCX(India) future contract values.
This is a premium indicator so send me a private message for 15 days free trial.
"Use the link below to obtain access to this indicator."
Disclaimer: This script/strategy is for educational purpose and individual use only. The author of this script/strategy will not accept any liability for loss or damage as a result of reliance on the information contained in the charts. Please be fully informed regarding the risks and costs associated with trading the financial markets.
Aditya Signal-1.1 for Nifty and Bank NiftyThis is non-repainting indicator which can be used for Index, Stocks, Commodities and Bitcoin or any other securities depending upon the various parameter setting of the indicator. This particular strategy is for Nifty-50 Index which is traded on NSE(India).
The detailed description about the indicator is as follows:
Long Period: Period for calculating Primary Signal Line (Yellow).
Long Period Input Source: Input for calculating Primary Signal Line.
Short Period: Period for smoothing the Primary Signal Line.
Short Period MA: Method for smoothing the Primary Signal Line.
No. of ATR Bars: No. of ATR bars for calculating Primary Signal Line.
ATR Multiplier: ATR multiplier for ATR calculation.
Trade Trigger: Value above or below of Primary Signal Line for Long or Short signal. The dotted lines in Green and Red color represents the same.
Bar Crossover Input Source: Current bar input for additional signal confirmation above Primary Signal Line.
Bars Above Signal High: No. of bars closing above Secondary Signal Line (Blue)
Bars Below Signal Low: No. of bars closing above Secondary Signal Line (Purple)
No. of bars crossover method uses certain no. of bars for closing above High or Low of the crossover of closing price and the Primary Signal Line in combination with Trade Trigger. The idea behind this design is to avoid fake signal due sudden spike in price. Also, this ensures that price consolidates above High in case of Long signal confirmation and vice-versa. By increasing no. of such bars, we can anticipate, how much time it takes for short-term and long-term trend reversal.
Depending upon the time-frame, just by observing the High and Low of previous crossover of closing price and Primary Signal Line, we will have better understanding of undercurrent of market.
By using different combination of Trade Tigger value and no. of bars above and below, we can anticipate better trend confirmation.
The various combinations of price source of Long Period Input Source and Bar Crossover Input Source, the Short Period MA method shows promising results. Kindly PM me for these optimum settings for other financial instruments.
It always better to book partial profit after getting into the trade which increases the odds. The default trade quantity is 2. We book 1 quantity after our partial profit target is reached and let the remaining quantity be in the trade until the reversal of trend. By enabling or disabling the same we can determine the profit or loss from historical trade from when the trade quantity is 1. Just remember to change the default quantity to 1 in Order Size from properties when you disable the Take Partial Profit option.
Take Partial Profit: Whether to book partial or not as explained above.
Partial Profit Points: It always better to book partial profit after trend getting into the trade. The default trade quantity is 2. We book 1 quantity after our partial profit target is hit and let the remaining quantity in the trade until the reversal of trend.
Instrument Type: We can select the which instrument for analysis. By adjusting the Take Partial Profit value by selecting Other Option, you can analyze instrument of your choice other than mentioned in the list for Partial Profit depending upon stock tick value and lot quantity or you can PM me. I have adjusted value for Crude Oil and Silver for MCX(India) future contract values.
This is a premium indicator so send me a private message for 15 days free trial.
"Use the link below to obtain access to this indicator."
Disclaimer: This script/strategy is for educational purpose and individual use only. The author of this script/strategy will not accept any liability for loss or damage as a result of reliance on the information contained in the charts. Please be fully informed regarding the risks and costs associated with trading the financial markets.

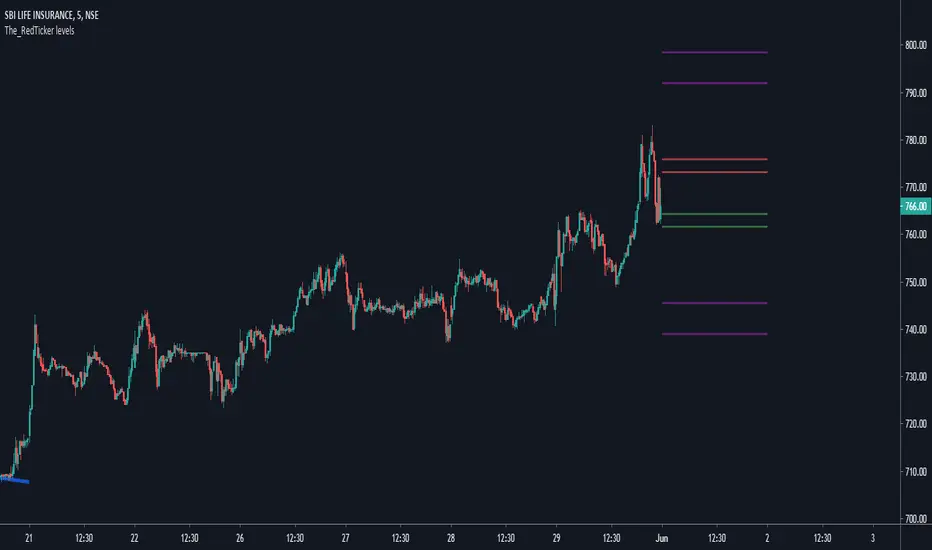
The_Redticker's Intraday IndicatorThis is a simplistic indicator capable of predicting Intraday Reversal regions for almost any chart on NSE/BSE (Indian Stock Exchanges)
Notes for Usage:
Best works when used on both indexes NIFTY and NIFTYBANK simultaneously in correlation. Its easy to understand that correlation, any one using it should spot it in a few days
Also, should only be used on 3 or 5 mins timeframe.
ENTRY:
The Inner regions marked by Red and Green lines are to be used for entries. Can look for both long and short reversal on either zones, can be teamed with other oscillators for better understanding.
Basically, when the CMP enters either Red or Green Zone, look for a long or short entry at the close outside the zone on 3 or 5 mins timeframe with the other side of the zone as stoploss trigger price.
While the Purple line on either side indicates the target zones.
P.s. If entering Short reversal at the Red Zone, then Green zone can also serve as first target and Purple zone as the final target depending on Market momentum. Vice-versa for entry at Long reversal at Green zone too.
Note: This indicator is most of the time absolutely correct, but needs to corrected every few months for VIX change. If and when that is done next will update it to show a NOTE on chart regarding that.
Look at any Index ideas on my profile to see live examples.
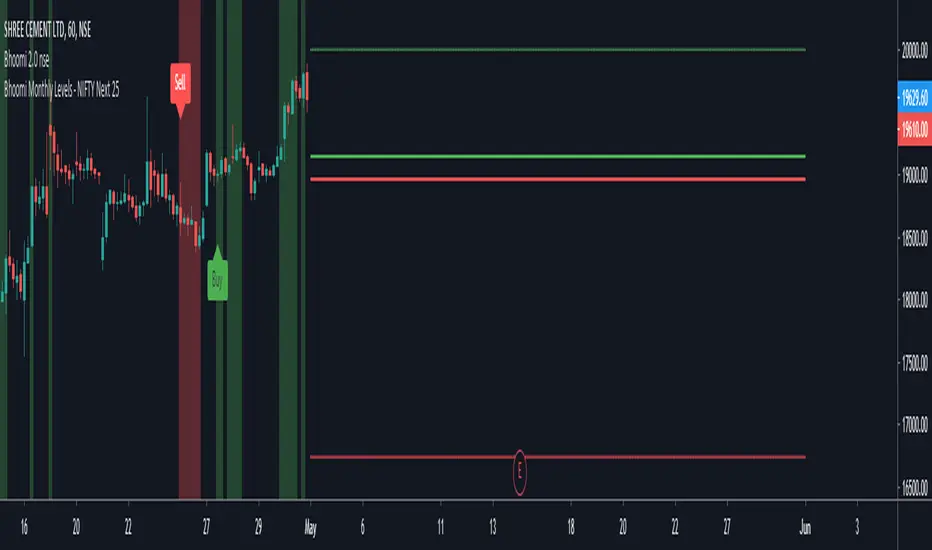
Bhoomi Monthly Levels - NIFTY Next 25This is a custom indicator which assists with monthly levels of Next25 stocks of NIFTY 50.
TCS Trading Strategy -1This Trading Strategy is for TATA Consultancy Services (TCS) which is traded on National Stock Exchange (India).
The strategy works best on 5 min timeframe. The results may very different depending upon time-frame and date range of your choice.
The default trading quantity is 2. I have added functionality for part profit booking which increase profit and always keeps you in trade.
It is non-repainting indicator and uses @version=4.
For free trial, send me a private message in order to access this script as this Invite Only script.
Thanks © allanster for Date Range functionality script.
Disclaimer: This script/strategy is for educational and information purpose only. The author of this script/strategy will not accept any liability for loss or damage as a result of reliance on the information contained in the charts and buy/sell signals. Please be fully informed regarding the risks and costs associated with trading the financial markets.

IndusInd Bank Trading Tool-1Thanks for the tremendous response I got for the Nifty-50 trading tool.
It is non-repainting indicator and uses @version=4.
This is trading tool for IndusInd Bank which is traded on National Stock Exchange (India).
The results will be very different depending upon time-frame and date range of your choice.
The strategy works best on 10 minutes timeframe. The default trading quantity is 2. I have added functionality for part profit booking.
The aim of this indicator is not to predict the market, but ride the market with its ebbs and flows. Because predicting the market is always futile. This indicator maximizes the probability of trades depending on historical prices. i.e. all the technical indicator does the same.
This is a premium indicator so send me a private message in order to access this script.
Thanks © allanster for script "How To Set Backtest Range" for Date Range functionality and ©TheYangGuizi.
Disclaimer: This script/strategy is for educational and information purpose only. The author of this script/strategy will not accept any liability for loss or damage as a result of reliance on the information contained in the charts and buy/sell signals. Please be fully informed regarding the risks and costs associated with trading the financial markets.

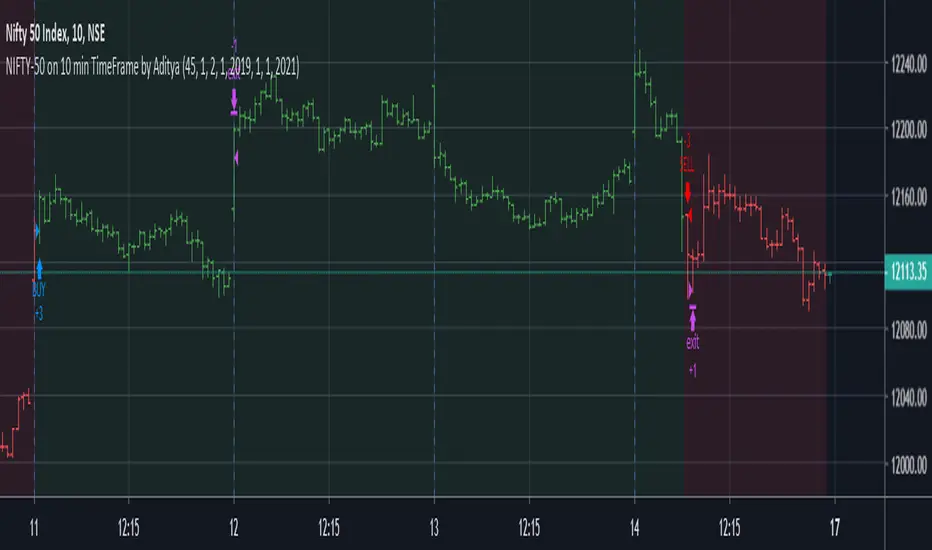
NIFTY-50 on 10 min TimeFrame by Aditya
I have developed this strategy for NIFTY-50 Index on which is traded National Stock of Exchange(India). It is non-repainting indicator and uses @version=4
This script uses hourly and daily price data.
The results will be very different depending on the chart and time-frame of your choice and date range of your choice.
The default contract quantity is set to 2 .You can adjust as per your risk management.
I have found that taking partial profit (1 contract) and continuing the with remaining (1 contract) keeps you in trade until next trend reversal.
It has following usage setting:
1. Enable/Disable take partial profit.
2. Partial profit points.(45 points gives better results)
3. No. of contracts for partial profit booking.
4. Date Range (From and To) to check for different date range.
4. Enable/Disable Bar Color.
5. Enable/Disable Background Color.
Thanks © allanster for script"How To Set Backtest Range" for Date Range functionality .
I have tested this indicator on 10 minutes time-frame on National Stock of Exchange(India) which gives good results and the time period is almost 1 year
from 21/01/2019 to 14/02/2020.
Points=5632.
No. of trades=202
Profit Factor=1.9
Sharpe Ratio=0.626
The NIFTY-50 contract size is 75.
This strategy gives better results on Index as this is optimized for Indexes. You can always try on other instruments or you can private message me.
Use proper risk management.
This is a premium indicator so send me a private message in order to access this script. This script is for information and educational purpose.
VWAP_OSC_MANOJVWAP OSCILLATOR is the difference between VWAPs of two time frames plotted as an histogram. It is relatively less lagging than other conventional oscillators like MACD, etc. In fact in some cases it moves alongwith the price and hence decision making is more effective.


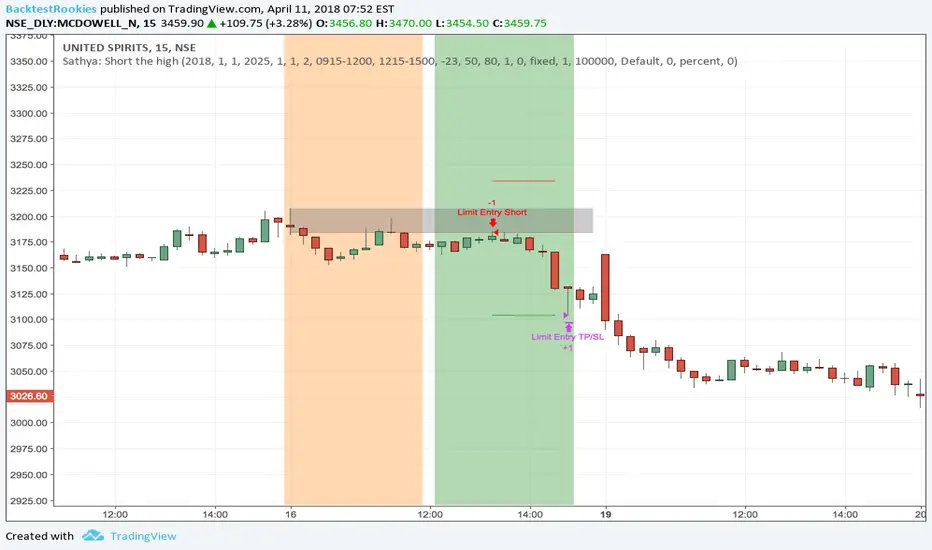
Sathya: Short the highShort the High
This script has been developed as a professional service and is published only for customer verification/acceptance.
If you are interested in development services, either PM me or visit the Backtest-Rookies website (.com)
Summary
This strategy will attempt to take a short position within a time window only after X consecutive up days. Once X consecutive up days have been detected, two windows will open up. The first window tracks the high of the day. The second window will attempt to short the high of the day if price retests it.
Features
Tracking of consecutive up days using intra-day data
Opening a trade window when consecutive up days are detected
Tracking the high of a sub-session (user definable)
Shorting the high during a second sub-session (user definable)
Stop losses and take profits
End of sub-session close out option.
Buffer range from high of the day. So price does not need to retouch the high but can come with x rupees.
Background coloring of sub-sessions so it is easy to track trades