NYSE Open Close Session Map by o0psiNYSE Open Close Session Map by o0psi
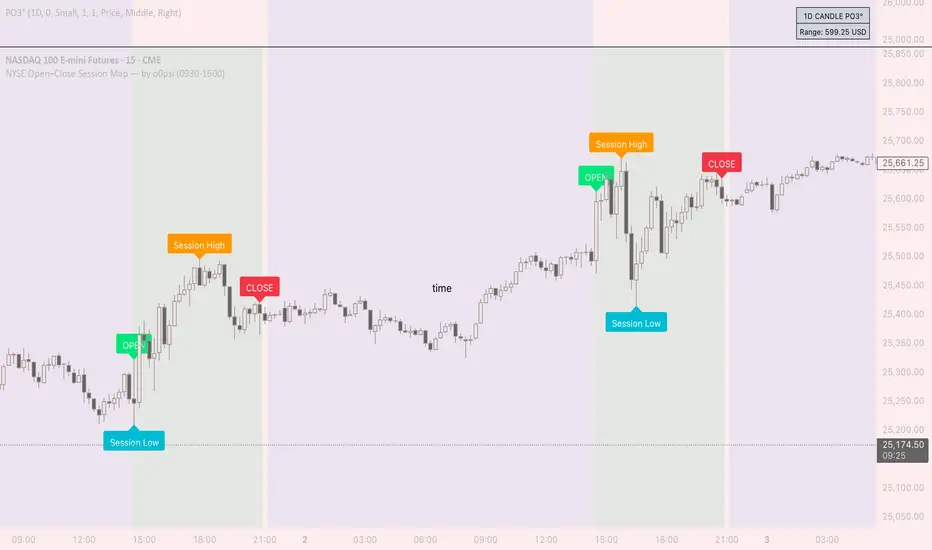
This indicator highlights the regular US cash session window (default 09:30–16:00 New York time) and makes the key session bars obvious on the chart.
What it shows
A marker on the session OPEN bar
A marker on the session CLOSE bar (last in-session candle)
Optional background highlight for the full session window
Optional labels for the session high and session low bars (based on intraday price during the session)
How it works
The script detects bars inside the selected session window (New York timezone). It anchors OPEN on the first in-session bar, updates the session high/low while the session is active, then anchors CLOSE on the final in-session bar and labels the high/low bars where they occurred.
Notes
Session range precision depends on chart timeframe (lower timeframes capture extremes more precisely).
This is a charting/visualization tool and does not provide trading advice.
Nyse
Market Sentiment Index US Top 40 [Pt]▮Overview
Market Sentiment Index US Top 40 [Pt} shows how the largest US stocks behave together. You pick one simple measure—High Low breakouts, Above Below moving average, or RSI overbought/oversold—and see how many of your chosen top 10/20/30/40 NYSE or NASDAQ names are bullish, neutral, or bearish.
This tool gives you a quick view of broad-market strength or weakness so you can time trades, confirm trends, and spot hidden shifts in market sentiment.
▮Key Features
► Three Simple Modes
High Low Index: counts stocks making new highs or lows over your lookback period
Above Below MA: flags stocks trading above or below their moving average
RSI Sentiment: marks overbought or oversold stocks and plots a small histogram
► Universe Selection
Top 10, 20, 30, or 40 symbols from NYSE or NASDAQ
Option to weight by market cap or treat all symbols equally
► Timeframe Choice
Use your chart’s timeframe or any intraday, daily, weekly, or monthly resolution
► Histogram Smoothing
Two optional moving averages on the sentiment bars
Markers show when the faster average crosses above or below the slower one
► Ticker Table
Optional on-chart table showing each ticker’s state in color
Grid or single-row layout with adjustable text size and color settings
▮Inputs
► Mode and Lookback
Pick High Low, Above Below MA, or RSI Sentiment
Set lookback length (for example 10 bars)
If using Above Below MA, choose the moving average type (EMA, SMA, etc.)
► Universe Setup
Market: NYSE or NASDAQ
Number of symbols: 10, 20, 30, or 40
Weights: on or off
Timeframe: blank to match chart or pick any other
► Moving Averages on Histogram
Enable fast and slow averages
Set their lengths and types
Choose colors for averages and markers
► Table Options
Show or hide the symbol table
Select text size: tiny, small, or normal
Choose layout: grid or one-row
Pick colors for bullish, neutral, and bearish cells
Show or hide exchange prefixes
▮How to Read It
► Sentiment Bars
Green means bullish
Red means bearish
Near zero means neutral
► Zero Line
Separates bullish from bearish readings
► High Low Line (High Low mode only)
Smooth ratio of highs versus lows over your lookback
► MA Crosses
Fast MA above slow MA hints rising breadth
Fast MA below slow MA hints falling breadth
► Ticker Table
Each cell colored green, gray, or red for bull, neutral, or bear
▮Use Cases
► Confirm Market Trends
Early warning when price makes highs but breadth is weak
Catch rallies when breadth turns strong while price is flat
► Spot Sector Rotation
Switch between NYSE and NASDAQ to see which group leads
Watch tech versus industrial breadth to track money flow
► Filter Trade Signals
Enter longs only when breadth is bullish
Consider shorts when breadth turns negative
► Combine with Other Indicators
Use RSI Sentiment with trend tools to spot overextended moves
Add volume indicators in High Low mode for breakout confirmation
► Timeframe Analysis
Daily for big-picture bias
Intraday (15-min) for precise entries and exits

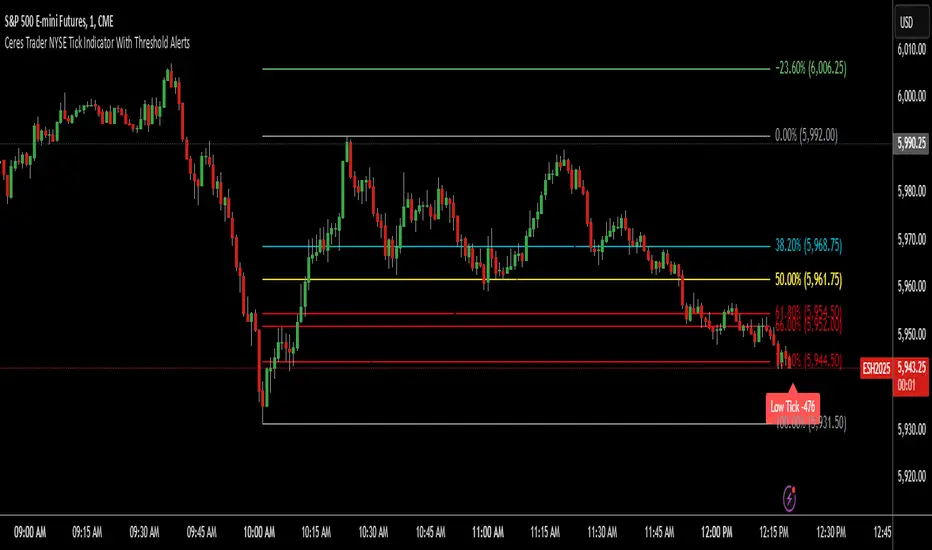
Ceres Trader NYSE Tick Indicator With Threshold AlertsThe Ceres Trader NYSE Tick Indicator provides real-time alerts for significant shifts in the NYSE Tick, empowering traders to identify potential overbought and oversold market conditions. It displays labels directly on the chart when the Tick reaches predefined thresholds, offering a clear and immediate visual representation of market sentiment.
Key Features:
Threshold-Based Alerts:
Highlights "High Tick" and "Low Tick" conditions when the Tick exceeds user-defined thresholds (default: 400 and -400).
Identifies "Extreme High Tick" and "Extreme Low Tick" conditions for more significant shifts (adjusted default: 800 and -800).
Visual Labels:
Displays colored labels directly on the price chart, indicating the type of Tick event and its value.
Green labels signal potential overbought conditions, while red labels indicate potential oversold conditions.
Low tick labels are placed below the price bar, and high tick labels are placed above the price bar for improved visibility.
Real-Time Data:
Utilizes the NYSE Tick symbol ("TICK") to provide up-to-the-minute market data.
User-Friendly Design:
Simple and intuitive design, suitable for traders of all experience levels.
How to Use:
Add the "Ceres Trader NYSE Tick Indicator with Threshold Alerts" to your TradingView chart.
Observe the colored labels that appear when the Tick reaches the specified thresholds.
Use these alerts to identify potential trading opportunities based on overbought or oversold market conditions.
Consider adjusting the threshold values within the indicator settings to align with your specific trading strategy.
NYSE, Euronext, and Shanghai Stock Exchange Hours IndicatorNYSE, Euronext, and Shanghai Stock Exchange Hours Indicator
This script is designed to enhance your trading experience by visually marking the opening and closing hours of major global stock exchanges: the New York Stock Exchange (NYSE), Euronext, and Shanghai Stock Exchange. By adding vertical lines and background fills during trading sessions, it helps traders quickly identify these critical periods, potentially informing better trading decisions.
Features of This Indicator:
NYSE, Euronext, and Shanghai Stock Exchange Hours: Displays vertical lines at market open and close times for these three exchanges. You can easily switch between showing or hiding the different exchanges to customize the indicator for your needs.
Background Fill: Highlights the trading hours of these exchanges using faint background colors, making it easy to spot when markets are in session. This feature is crucial for timing trades around overlapping trading hours and volume peaks.
Customizable Visuals: Adjust the color, line style (solid, dotted, dashed), and line width to match your preferences, making the indicator both functional and visually aligned with your chart's aesthetics.
How to Use the Indicator:
Add the Indicator to Your Chart: Add the script to your chart from the TradingView script library. Once added, the indicator will automatically plot vertical lines at the opening and closing times of the NYSE, Euronext, and Shanghai Stock Exchange.
Customize Display Settings: Choose which exchanges to display by enabling or disabling the NYSE, Euronext, or Shanghai sessions in the indicator settings. This allows you to focus only on the exchanges that are relevant to your trading strategy.
Adjust Visual Properties: Customize the appearance of the vertical lines and background fill through the settings. Modify the color of each exchange, adjust the line style (solid, dotted, dashed), and control the line thickness to suit your chart preferences. The background fill can also be customized to clearly highlight active trading sessions.
Identify Key Market Hours: Use the vertical lines and background fills to identify the market open and close times. This is particularly useful for understanding how price action changes during specific trading hours or for finding high liquidity periods when multiple markets are open simultaneously.
Adapt Trading Strategies: By knowing when major stock exchanges are open, you can adapt your trading strategy to take advantage of potential price movements, increased volatility, or volume. This can help you avoid low-liquidity times and capitalize on more active trading periods.
This indicator is especially valuable for traders focusing on cross-market dynamics or those interested in understanding how different sessions influence market liquidity and price action. With this tool, you can gain insight into market conditions and adapt your trading strategies accordingly. The clean visual separation of session times helps you maintain context, whether you're trading Forex, stocks, or cryptocurrencies.
Disclaimer: This script is intended for informational and educational purposes only. It does not constitute financial advice or a recommendation to buy or sell any financial instrument. Always conduct your own research and consult with a licensed financial advisor before making any trading decisions. Trading involves risk, and past performance is not indicative of future results.

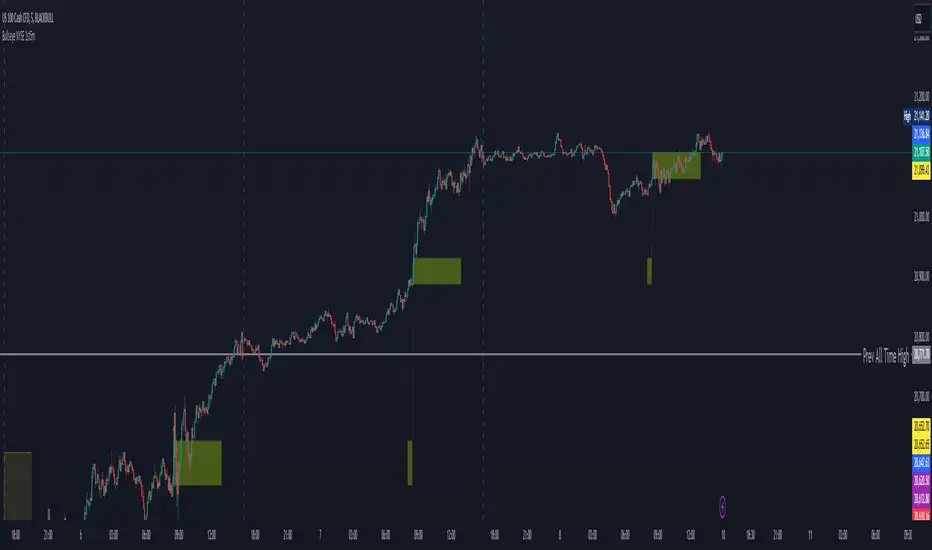
Bullseye NYSE 1st5mThis script, "BullseyeNYSE1st5m," is a TradingView indicator designed to highlight the high and low price levels during the first 5 minutes of the NYSE trading session. It works as follows:
1. **Identify NYSE Trading Hours**: The script identifies bars that fall within NYSE trading hours, specifically focusing on the first five minutes after the market opens.
2. **Calculate First 5-Minute High and Low**: During the first five minutes of the trading day, the script captures and updates the high and low prices, storing these values for the remainder of the session.
3. **Plot High and Low Levels**: The high and low values from the first five minutes are plotted as lines on the chart in yellow. This helps traders quickly identify the initial range set by the market.
4. **Fill the Area Between High and Low**: The area between the high and low levels is filled with a translucent yellow color to visually emphasize the first five-minute range.
5. **Alerts for Breakouts**: Alerts are set to notify the user when the price closes above or below the first five-minute range. This helps traders stay informed of potential breakout opportunities beyond this key opening range.
This indicator is useful for day traders looking to leverage the first few minutes of NYSE trading to identify early support and resistance levels and to spot breakout opportunities.
Breadth Indicators NYSE Percent Above Moving AverageBreadth Indicators NYSE - transmits the processed data from the Barchart provider
NYSE - Breadth Indicators
S&P 500 - Breadth Indicators
DOW - Breadth Indicators
RUSSEL 1000 - Breadth Indicators
RUSSEL 2000 - Breadth Indicators
RUSSEL 3000 - Breadth Indicators
Moving Average - 5, 20, 50, 100, 150, 200
The "Percentage above 50-day SMA" indicator measures the percentage of stocks in the index trading above their 50-day moving average. It is a useful tool for assessing the general state of the market and identifying overbought and oversold conditions.
One way to use the "Percentage above 50-day SMA" indicator in a trading strategy is to combine it with a long-term moving average to determine whether the trend is bullish or bearish. Another way to use it is to combine it with a short-term moving average to identify pullbacks and rebounds within the overall trend.
The purpose of using the "Percentage above 50-day SMA" indicator is to participate in a larger trend with a better risk-reward ratio. By using this indicator to identify pullbacks and bounces, you can reduce the risk of entering trades at the wrong time.
Bull Signal Recap:
150-day EMA of $SPXA50R crosses above 52.5 and remains above 47.50 to set the bullish tone.
5-day EMA of $SPXA50R moves below 40 to signal a pullback
5-day EMA of $SPXA50R moves above 50 to signal an upturn
Bear Signal Recap:
150-day EMA of $SPXA50R crosses below 47.50 and remains below 52.50 to set the bearish tone.
5-day EMA of $SPXA50R moves above 60 to signal a bounce
5-day EMA of $SPXA50R moves below 50 to signal a downturn
Tweaking
There are numerous ways to tweak a trading system, but chartists should avoid over-optimizing the indicator settings. In other words, don't attempt to find the perfect moving average period or crossover level. Perfection is unattainable when developing a system or trading the markets. It is important to keep the system logical and focus tweaks on other aspects, such as the actual price chart of the underlying security.
What do levels above and below 50% signify in the long-term moving average?
A move above 52.5% is deemed bullish, and below 47.5% is deemed bearish. These levels help to reduce whipsaws by using buffers for bullish and bearish thresholds.
How does the short-term moving average work to identify pullbacks or bounces?
When using a 5-day EMA, a move below 40 signals a pullback, and a move above 60 signals a bounce.
How is the reversal of pullback or bounce identified?
A move back above 50 after a pullback or below 50 after a bounce signals that the respective trend may be resuming.
How can you ensure that the uptrend has resumed?
It’s important to wait for the surge above 50 to ensure the uptrend has resumed, signaling improved breadth.
Can the system be tweaked to optimize indicator settings?
While there are various ways to tweak the system, seeking perfection through over-optimizing settings is advised against. It's crucial to keep the system logical and focus tweaks on the price chart of the underlying security.
RUSSIAN \ Русская версия.
Индикатор "Процент выше 50-дневной скользящей средней" измеряет процент акций, торгующихся в индексе выше их 50-дневной скользящей средней. Это полезный инструмент для оценки общего состояния рынка и выявления условий перекупленности и перепроданности.
Один из способов использования индикатора "Процент выше 50-дневной скользящей средней" в торговой стратегии - это объединить его с долгосрочной скользящей средней, чтобы определить, является ли тренд бычьим или медвежьим. Другой способ использовать его - объединить с краткосрочной скользящей средней, чтобы выявить откаты и отскоки в рамках общего тренда.
Цель использования индикатора "Процент выше 50-дневной скользящей средней" - участвовать в более широком тренде с лучшим соотношением риска и прибыли. Используя этот индикатор для выявления откатов и отскоков, вы можете снизить риск входа в сделки в неподходящее время.
Краткое описание бычьего сигнала:
150-дневная ЕМА на уровне $SPXA50R пересекает отметку 52,5 и остается выше 47,50, что задает бычий настрой.
5-дневная ЕМА на уровне $SPXA50R опускается ниже 40, сигнализируя об откате
5-дневная ЕМА на уровне $SPXA50R поднимается выше 50, сигнализируя о росте
Обзор медвежьих сигналов:
150-дневная ЕМА на уровне $SPXA50R пересекает уровень ниже 47,50 и остается ниже 52,50, что указывает на медвежий настрой.
5-дневная ЕМА на уровне $SPXA50R поднимается выше 60, сигнализируя о отскоке
5-дневная ЕМА на уровне $SPXA50 опускается ниже 50, что сигнализирует о спаде
Корректировка
Существует множество способов настроить торговую систему, но графологам следует избегать чрезмерной оптимизации настроек индикатора. Другими словами, не пытайтесь найти идеальный период скользящей средней или уровень пересечения. Совершенство недостижимо при разработке системы или торговле на рынках. Важно поддерживать логику системы и уделять особое внимание другим аспектам, таким как график фактической цены базовой ценной бумаги.
Что означают уровни выше и ниже 50% в долгосрочной скользящей средней?
Движение выше 52,5% считается бычьим, а ниже 47,5% - медвежьим. Эти уровни помогают снизить риски, используя буферы для бычьих и медвежьих порогов.
Как краткосрочная скользящая средняя помогает идентифицировать откаты или отскоки?
При использовании 5-дневной ЕМА движение ниже 40 указывает на откат, а движение выше 60 указывает на отскок.
Как определяется разворот отката или отскока?
Движение выше 50 после отката или ниже 50 после отскока сигнализирует о возможном возобновлении соответствующего тренда.
Как вы можете гарантировать, что восходящий тренд возобновился?
Важно дождаться скачка выше 50, чтобы убедиться в возобновлении восходящего тренда, сигнализирующего о расширении диапазона.
Можно ли настроить систему для оптимизации настроек индикатора?
Хотя существуют различные способы настройки системы, не рекомендуется стремиться к совершенству с помощью чрезмерной оптимизации настроек. Крайне важно сохранить логичность системы и сфокусировать изменения на ценовом графике базовой ценной бумаги.

NYSE TickThe NYSE Tick indicator is a market breadth indicator used to determine short-term bullish or bearish market sentiment. The NYSE Tick index compares the number of stocks on the New York Stock Exchange that are ticking up to the number of stocks ticking down at a specific moment in time. When the NYSE Tick is hovering around the zero line, roughly the same number of stocks are ticking up as are ticking down. When the overall market is rising it will usually present on the NYSE Tick as a rise in value that will generally stay mostly above the zero line for a period of time. The opposite is true when the general market is falling and can be seen as the NYSE Tick staying mostly below the zero line. This information can be very helpful for a short-term day trader who trades a market that also follows many of these same stocks, like the E-Mini S&P 500 Futures (ES), for example. While the index can theoretically rise or fall to over ±2,000 if all stocks on the NYSE are ticking up or down at the same time, it’s generally considered an extreme movement if the NYSE Tick is ±1,000. For this reason, the indicator has default reference lines at ±1,000 and halfway marks at ±500. In order to partially smooth out the movement and make movement trends more easily read, the indicator plots the values using Heikin Ashi candles instead of the standard bars or candlesticks. The price-line value displayed is an accurate live value, however, rather than the OHLC average value of a standard Heikin Ashi candle. Since the standard hours for the NYSE are Monday – Friday, 09:30 – 16:00 EST, the indicator only plots bars during this time.

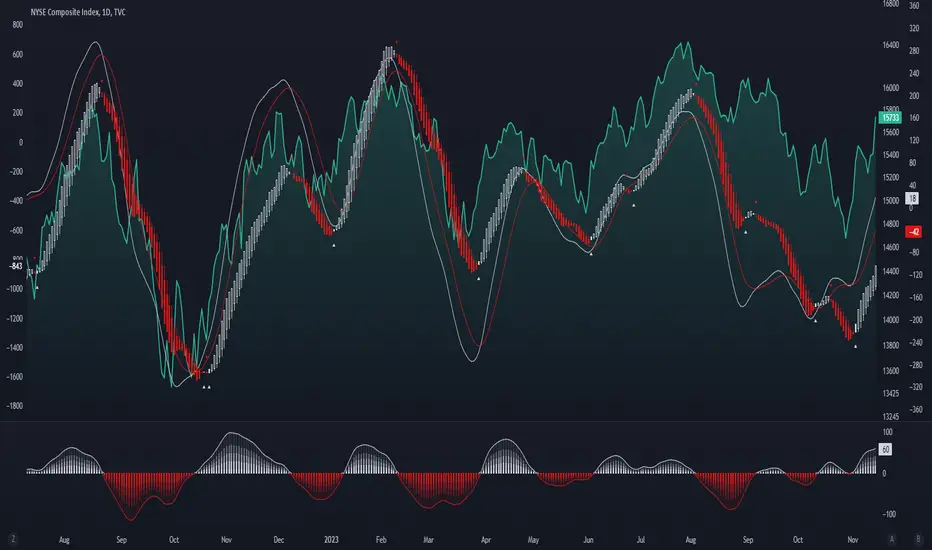
Enhanced McClellan Summation Index
The Enhanced McClellan Summation Index (MSI) is a comprehensive tool that transforms the MSI indicator with Heikin-Ashi visualization, offering improved trend analysis and momentum insights. This indicator includes MACD and it's histogram calculations to refine trend signals, minimize false positives and offer additional momentum analysis.
Methodology:
McClellan Summation Index (MSI) -
The MSI begins by calculating the ratio between advancing and declining issues in the specified index.
float decl = 𝘐𝘯𝘥𝘪𝘤𝘦 𝘥𝘦𝘤𝘭𝘪𝘯𝘪𝘯𝘨 𝘪𝘴𝘴𝘶𝘦𝘴
float adv = 𝘐𝘯𝘥𝘪𝘤𝘦 𝘢𝘥𝘷𝘢𝘯𝘤𝘪𝘯𝘨 𝘪𝘴𝘴𝘶𝘦𝘴
float ratio = (adv - decl) / (adv + decl)
It then computes a cumulative sum of the MACD (the difference between a 19-period EMA and a 39-period EMA) of this ratio. The result is a smoothed indicator reflecting market breadth and momentum.
macd(float r) =>
ta.ema(r, 19) - ta.ema(r, 39)
float msi = ta.cum(macd(ratio))
Heikin-Ashi Transformation -
Heikin-Ashi is a technique that uses a modified candlestick formula to create a smoother representation of price action. It averages the open, close, high, and low prices of the current and previous periods. This transformation reduces noise and provides a clearer view of trends.
type bar
float o = open
float h = high
float l = low
float c = close
bar b = bar.new()
float ha_close = math.avg(b.o, b.h, b.l, b.c)
MACD and Histogram -
The Enhanced MSI incorporates MACD and histogram calculations to provide additional momentum analysis and refine trend signals. The MACD represents the difference between the 12-period EMA and the 26-period EMA of the MSI. The histogram is the visual representation of the difference between the MACD and its signal line.
Options:
Index Selection - Choose from TVC:NYA , NASDAQ:NDX , or TVC:XAX to tailor the MSI-HA to the desired market index.
MACD Settings - Adjust the parameters for the MACD calculation to fine-tune the indicator's responsiveness.
Ratio Multiplier - Apply scaling to the MSI to suit different market conditions and indices.
Benefits of Heikin-Ashi -
Smoothed Trends - Heikin-Ashi reduces market noise, providing a more apparent and smoothed representation of trends.
Clearer Patterns - Candlestick patterns are more distinct, aiding in the identification of trend reversals and continuations.
Utility and Use Cases:
Trend & Momentum Analysis - Utilize the tool's Heikin-Ashi visualization for clearer trend identification in confluence with it's MACD and histogram to gain additional insights into the strength and direction of trends, while filtering out potential false positives.
Breadth Analysis - Explore market breadth through the MSI's cumulative breadth indicator, gauging the overall health and strength of the underlying market.
- Alerts Setup Guide -
The Enhanced MSI is a robust indicator that combines the breadth analysis of the McClellan Summation Index with the clarity of Heikin-Ashi visualization and additional momentum insights from MACD and histogram calculations. Its customization options make it adaptable to various indices and market conditions, offering traders a comprehensive tool for trend and momentum analysis.
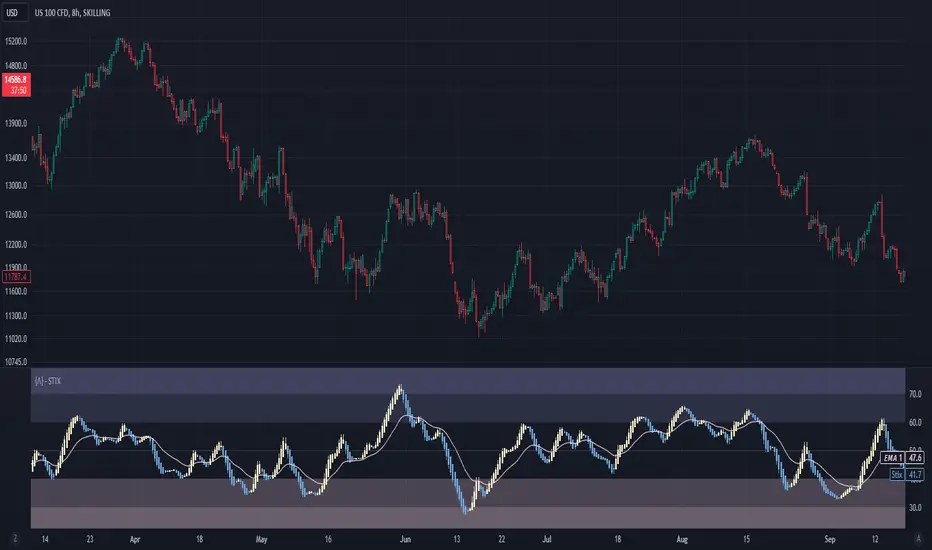
Short Term IndeXThe Short-Term Index (STIX) is a simple market indicator designed to assess short-term overbought or oversold conditions in the stock market. Leveraging a combination of advancing and declining issues, STIX provides valuable insights into market sentiment and potential reversals. To enhance its interpretability and reveal the underlying trend with greater clarity, STIX has been refined through a Heiken-Ashi transformation, ensuring a smoother representation of market dynamics.
Calculation and Methodology:
stix = ta.ema(adv / (adv + dec) * 100, len)
STIX is calculated by dividing the difference between the sum of advancing issues (ADV) by the total number of issues traded (ADV + DEC). This quotient is multiplied by 100 to express the result as a percentage. The STIX index ranges from 0 to 100, where extreme values indicate potential overbought (mainly above 60) or oversold (mainly below 40) market conditions.
Heiken-Ashi Transformation:
By applying a Heiken-Ashi transformation to STIX, the indicator gains improved visual clarity and noise reduction. This transformation enhances the ability to identify trend shifts and potential reversal points, making it an even more valuable tool for traders and investors.
Utility and Use Cases:
-The Short-Term Index (STIX) offers a range of practical applications-
1. Overbought/Oversold Conditions: STIX provides a clear indication of short-term overbought or oversold conditions, helping traders anticipate potential market reversals.
2. Reversal Points: STIX can help pinpoint potential reversal points in short-term market trends, providing traders with opportunities to enter or exit positions.
3. Trend Analysis: By observing STIX values over time, traders can assess the strength and sustainability of short-term trends, aiding in trend-following strategies.
The Short-Term Index (STIX), enhanced by its Heiken-Ashi transformation, equips traders and investors with a tool for assessing short-term market conditions, confirming price movements, and identifying potential reversal points. Its robust methodology and refined presentation contribute to a more comprehensive understanding of short-term market dynamics, enabling traders to make well-informed trading decisions.
See Also:
- Other Market Breadth Indicators-
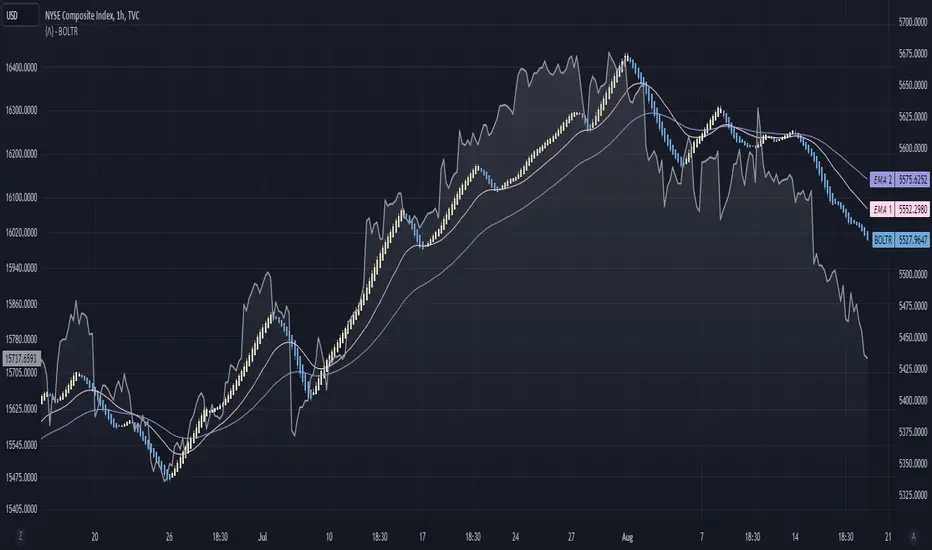
Bolton-Tremblay IndexThe Bolton-Tremblay Index (BOLTR) is a dynamic cumulative advance-decline indicator which incorporates the count of unchanged issues as a fundamental element. This index serves as a valuable tool for identifying shifts in market trends and gauging the overall strength or weakness of the market. To enhance its effectiveness and reveal underlying trends, BOLTR has been refined through a Heiken-Ashi transformation, resulting in a smoother and more insightful representation.
Calculation and Methodology:
r = (adv - dec) / unch
var float bt = na
bt := r > 0 ? nz(bt ) + math.sqrt(math.abs(r)) : nz(bt ) - math.sqrt(math.abs(r))
The BOLTR index is derived from a calculation involving three essential components: advancing issues (ADV), declining issues (DEC), and securities with unchanged closing prices (UNC). By formulating the ratio (ADV - DEC) / UNC, BOLTR captures the relationship between market movements and unchanged securities. This ratio then dictates whether the BOLTR index increases or decreases in the following period. If the ratio is positive, the index advances, and if negative, it retreats. This iterative process yields a cumulative index that reflects the evolving dynamics of market trends.
Heiken-Ashi Transformation:
The addition of a Heiken-Ashi transformation imparts a smoothing effect to the BOLTR index, revealing the underlying trend with greater clarity. This transformation diminishes noise and fluctuations, making it easier to identify meaningful shifts in market sentiment and overall market health.
Utility and Use Cases:
-The Bolton-Tremblay Index offers a range of applications that contribute to informed decision-making-
1. Trend Analysis: BOLTR provides insights into the changing trends of the market, helping traders and investors identify potential shifts in market sentiment.
2. Market Strength Assessment: By considering advancing, declining, and unchanged issues, BOLTR offers a comprehensive assessment of market strength and potential weaknesses.
3. Divergences: Traders can use BOLTR to detect divergences between price movements and the cumulative advance-decline dynamics, potentially signaling shifts in market direction.
The Bolton-Tremblay Index offers a versatile toolset for interpreting market trends, evaluating market health, and making better informed trading decisions.
See Also:
- Other Market Breadth Indicators-
Nasdaq or US Composite Total VolumeBecause no NASDAQ composite index or NYSE composite index provide data volume, this script intends to use the NASDAQ Composite total volume index, index ticker : TVOLQ, or the NYSE Composite total volume index, index ticker : TVOL, as a classical volume indicator on chart.
How tu use : in the input tab choose youe prefered SMA lenght and the volume' index ticker you want to display. TVOLQ for the NASDAQ Composite total volume or TVOL for the NYSE Composite total volume.
On chart, choose to display the indicator in a new pane.

Advance/Decline Line [IQ]Advance/Decline Line is a Market Breath indicator.
A/D line calculates a ratio between total number stocks advancing and total number of stocks in one day, providing another way to grasp the market breath at any moment.
We think the indicator covers the whole market, as we use data from the three main exchanges: NYSE, NASDAQ and AMEX.
The New York Stock Exchange (NYSE), nicknamed "The Big Board") is by far the world's largest stock exchange by market capitalization of its listed companies.
The Nasdaq Stock Market (NASDAQ) is ranked second on the list of stock exchanges by market capitalization of shares traded, behind the New York Stock Exchange.
The American Stock Exchange (AMEX) is the third largest stock exchange in the U.S. after the NYSE and the NASDAQ, and handles approximately 10% of all American trades.
How to interpret it:
Green columns mean more than 50% of NASDAQ stocks are advancing, red columns mean more than 50% of NASDAQ stocks are declining.
Green values above the top band mean correlation to the upside, red values bellow the low band mean correlation to the downside.
Correlation means rising probability of capitulation (to the upside or to the downside) and is market by a white bar (as signal).
Important:
For a better interpretation, the Advance/Decline Line indicator should be used in conjunction with other indicators (volatility, volume, etc.).

UP & DOWN VOLUMEIndicator draws UP & DOWN VOLUME for both NYSE and NASDAQ - just choose the appropriate exchange in settings.

4C NYSE Market Breadth RatioThe NYSE Market Breadth Ratio is considered by some to be the “king” of market internals. It lets you know instantly how strong current buying or selling pressure is in the broad market, to eliminate guessing or opinion.
This indicator plots the Market Breadth Ratio values for the NYSE and the NASD exchanges in real time.
It also plots the NYSE Market Breadth Ratio in a histogram plot for visual reference.
The indicator dynamically changes colors between green and red depending on whether breadth is currently positive or negative.
This indicator divides the 'Up-Volume' ("UVOL") by 'Down-Volume' ("DVOL"), for each exchange.
It can be added to any chart, but is incredibly useful when added to other sources of market internals like the NYSE Advancers/Decliners Difference (ticker ADD) or with the NYSE UVOL / DVOL Difference (ticker VOLD ).
Credit goes to author=@auron9000 as the bulk of this code was from their Breadth Ratio Bubbles indicator.
---> The changes made to their indicator include: bug fixes where the values werent properly updating; fixed indicator to be a separate plot (not chart overlay), and added the histogram plot.

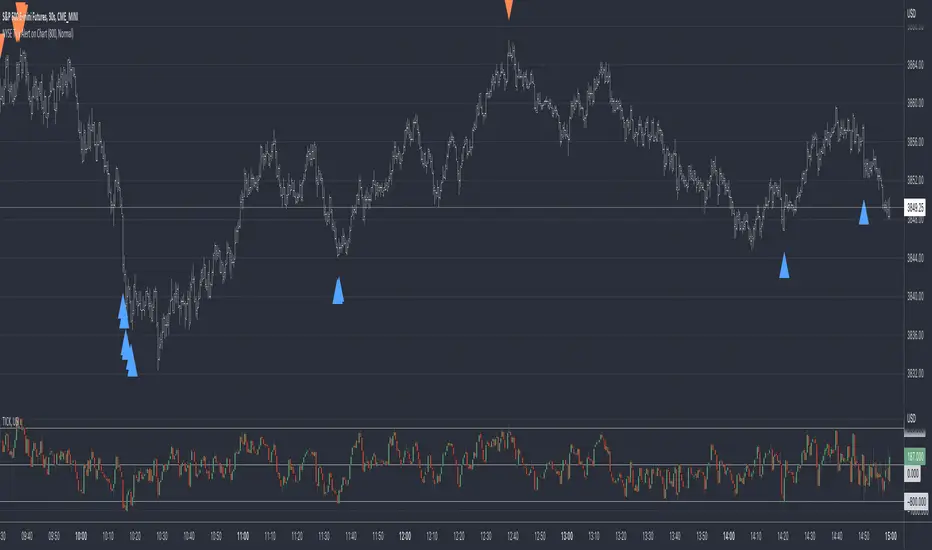
Up Volume vs Down VolumeCalculating NYSE Up Volume (UPVOL.NY) vs NYSE Down Volume (DNVOL.NY). The triangles appear when the ratio exceeds 90% in either direction.
Also has the option to switch to NQ, US, DJ, AM, or AX tickers.
Credit to @MagicEins for the original script:

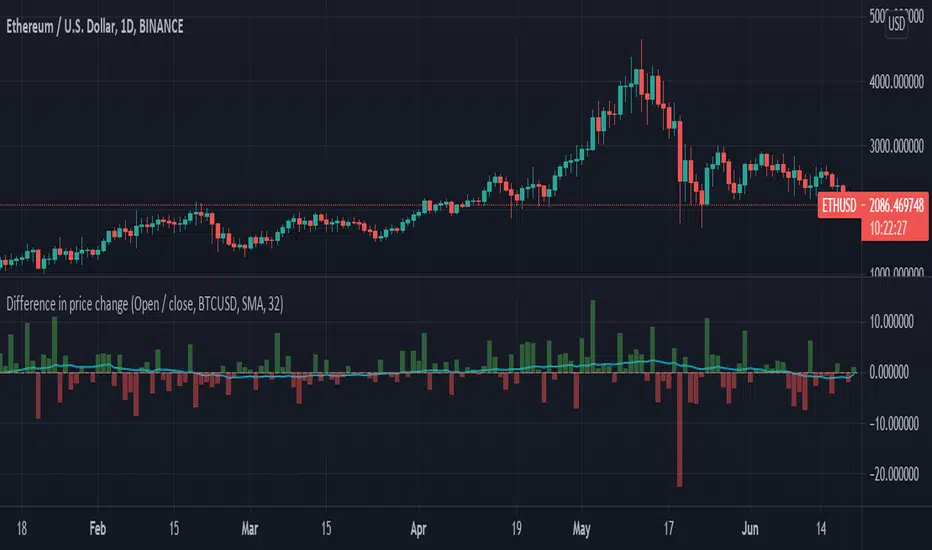
Difference in price changeCompares price change between current symbol and other one (eg. BTC vs S&P500). It calculates price change on each bar (from high to low or from open to close) and compares with price change of equivalent bar from the other source.
Example
Current symbol
open = 10 USD
close = 7 USD
change = -3 USD
% change = -30%
Second symbol
open = 3 USD
close = 4 USD
change = +1 USD
% change = +33%
Performance of price change = (-30) - (+30) = -63 // It means that current source has weaker performance right now
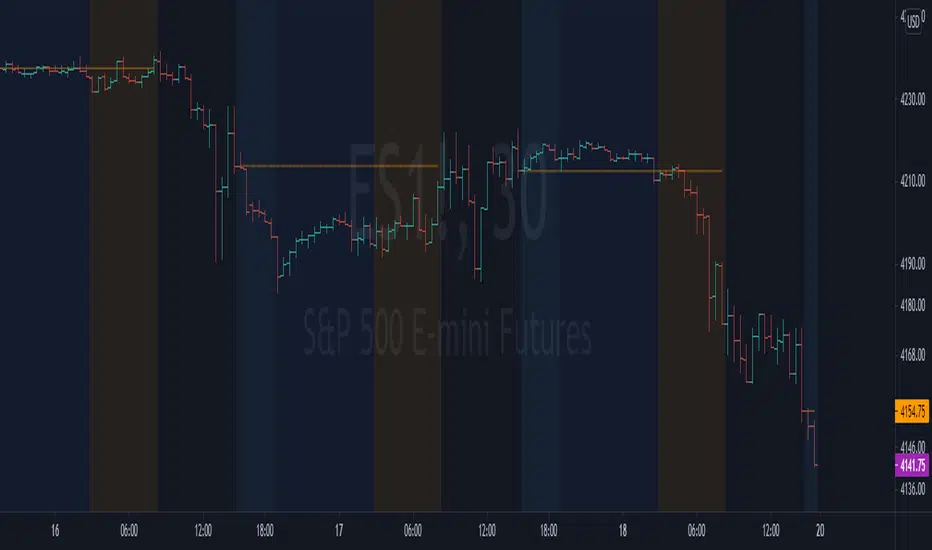
NYSE extended session backgroundThis script adds background to the chart to highlight different time areas in any chart.
The time areas are in relation to the open/close time of NYSE , both regular and extended session.
The background colors are the following by default:
NO COLOR : NYSE is open
DARK BLUE : NYSE is closed
LIGHT BLUE : NYSE post market session
ORANGE : NYSE pre market session
In addition, previous day close price line is shown during extended and closed sessions (orange line).
This script is useful to visualize any chart in relation to the NYSE timetable.
NASDAQ/NYSE Short Volume [NeoButane]This shows short volume from NASDAQ and NYSE.
If you do not understand what short volume is, I highly recommend researching FINRA documentation and reporting.
The indicator looks nice in histogram and column style.
The neat thing about nesting str.replace_all is that you can get the ticker without using a mutable variable.
NYSE Advance/DeclineAn indicator for traders who trade intraday on the US market. It makes use of the symbols made available by TradingView to show the number of advancing vs declining stocks.
The GREEN AREA represents advancing issues. The INTENSE GREEN AREA represents the advancing issues at daily high.
The RED AREA represents declining issues. The INTENSE RED AREA represents the declining issues at daily low.
The part above the BLUE LINE represents issues which are trading above their VWAP (volume-weighted average prices).


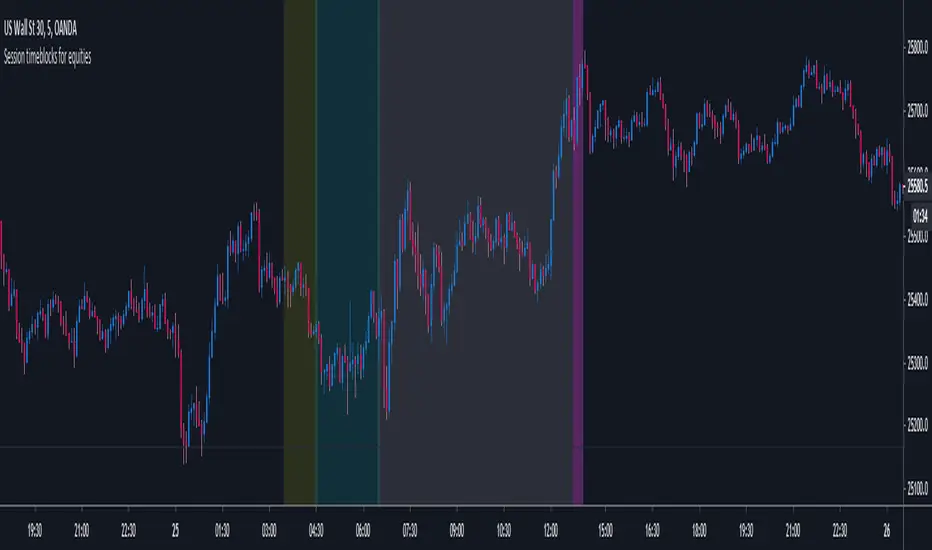
MightyFine Time blocks - EquitiesThis is a session timing indicator designed to show you certain times that the NYSE trades in. The bands represent:
Pre-Market Queue
NYSE Early Trading
NYSE Core Trading Session
Closing Auction Imbalance Freeze period
(optional) NYSE Afterhours until Asian session open
NYSE Volume UP FLOW VS Down FLOW ULTIMATE VOLDNYSE Volume UP FLOW VS Down FLOW ULTIMATE StokedStocks
BASED OFF THE VOLD INDEX
The VOLD (also $VOLD) is the difference between the up volume and down volume on the NYSE. i.e. NYSE $UVOL minus $DVOL; the net up volume.
If you consider that VOLD is the net value between UVOL (up volume) and DVOL (down volume) then you need to understand these two to understand VOLD.
UVOL or DVOL are a total of the volume on all stocks that are up or down in price. Up or down is based on the previous session's closing price. The size of the stock's price change is irrelevant.
If the stock is up only $.01, then its volume is grouped into the UVOL total. If that stock's price then drops by $.02 it will be down $.01 and the day's volume for that stock will now be grouped with the DVOL total.
Note that when a stock moves from being an up stock to a down stock its volume will be removed from the UVOL total and added to the DVOL total. Say the stocks volume is 1 million shares when it moves from up to down. The DVOL will increase by 1 million and the UVOL will decrease by 1 million which means that VOLD will decrease by 2 million.
NYSE Up/Down Volume Ratio is often used as a barometer for stocks trading on all U.S. Exchanges even though it is calculated based on stocks listed on the New York Stock Exchange.
NYSE Up/Down ratio represents the volume of NYSE stocks that are advancing divided by the volume of declining stocks.
The volume of advancing stocks or upside volume is the sum of the volume or the number of shares traded associated with stocks that closed higher.
The downside volume is the total number of shares traded that are associated with stocks that closed lower.
The interpretation of the NYSE Up/Down ratio is rather simple. A value higher than one indicates that there is more volume associated with up stocks than with down stocks and it is usually interpreted as a bullish signal.
Obviously, a bearish signal occurs when the NYSE Up/Down ratio is lower than one, which tells us that there are more volume associated with down stocks than with up stocks.
Check out my other indicators and website stokedstocks.wordpress.com for tons of free stock training books and pictures and settings
