Hybrid Strategy: Trend/ORB/MTFHybrid Strategy: Trend + ORB + Multi-Timeframe Matrix
This script is a comprehensive "Trading Manager" designed to filter out noise and identify high-probability breakout setups. It combines three powerful concepts into a single, clean chart interface: Trend Alignment, Opening Range Breakout (ORB), and Multi-Timeframe (MTF) Analysis.
It is designed to prevent "analysis paralysis" by providing a unified Dashboard that confirms if the trend is aligned across 5 different timeframes before you take a trade.
How it Works
The strategy relies on the "Golden Trio" of confluence:
1. Trend Definition (The Setup) Before looking for entries, the script analyzes the immediate trend. A bullish trend is defined as:
Price is above the Session VWAP.
The fast EMA (9) is above the slow EMA (21). (The inverse applies for bearish trends).
2. The Signal (The Trigger) The script draws the Opening Range (default: first 15 minutes of the session).
Buy Signal: Price breaks above the Opening Range High while the Trend is Bullish.
Sell Signal: Price breaks below the Opening Range Low while the Trend is Bearish.
3. The Confirmation (The Filter) A signal is only valid if the Higher Timeframe (default: 60m) agrees with the direction. If the 1m chart says "Buy" but the 60m chart is bearish, the signal is filtered out to prevent false breakouts.
Key Features
The Matrix Dashboard A zero-lag, real-time table in the corner of your screen that monitors 5 user-defined timeframes (e.g., 5m, 15m, 30m, 60m, 4H).
Trend: Checks if Price > EMA 21.
VWAP: Checks if Price > VWAP.
ORB: Checks if Price is currently above/below the Opening Range of that session.
D H/L: Warns if price is near the Daily High or Low.
PD H/L: Warns if price is near the Previous Daily High or Low.
Visual Order Blocks The script automatically identifies valid Order Blocks (sequences of consecutive candles followed by a strong explosive move).
Chart: Draws Green/Red zones extending to the right, showing where price may react.
Dashboard: Displays the exact High, Low, and Average price of the most recent Order Blocks for precision planning.
Risk Management (Trailing Stop) Once a trade is active, the script plots Chandelier Exit dots (ATR-based trailing stop) to help you manage the trade and lock in profits during trend runs.
Visual Guide (Chart Legend)
⬜ Gray Box: Represents the Opening Range (first 15 minutes). This is your "No Trade Zone." Wait for price to break out of this box.
🟢 Green Line: The Opening Range High. A break above this line signals potential Bullish momentum.
🔴 Red Line: The Opening Range Low. A break below this line signals potential Bearish momentum.
🟢 Green / 🔴 Red Zones (Boxes): These are Order Blocks.
🟢 Green Zone: A Bullish Order Block (Demand). Expect price to potentially bounce up from here.
🔴 Red Zone: A Bearish Order Block (Supply). Expect price to potentially reject down from here.
⚪ Dots (Trailing Stop):
🟢 Green Dots: These appear below price during a Bullish trend. They represent your suggested Stop Loss.
🔴 Red Dots: These appear above price during a Bearish trend.
🏷️ Buy / Sell Labels:
BUY: Triggers when Price breaks the Green Line + Trend is Bullish + HTF is Bullish.
SELL: Triggers when Price breaks the Red Line + Trend is Bearish + HTF is Bearish.
Settings
Session: Customizable RTH (Regular Trading Hours) to filter out pre-market noise.
Matrix Timeframes: 5 fixed slots to choose which timeframes you want to monitor.
Order Blocks: Adjust the sensitivity and lookback period for Order Block detection.
Risk: Customize the ATR multiplier for the trailing stop.
Disclaimer
This tool is for educational purposes only. Past performance does not guarantee future results. Always manage your risk properly.
Openingrangebreakout

Opening Range Intraday IndicatorOpening Range Intraday Indicator
Summary
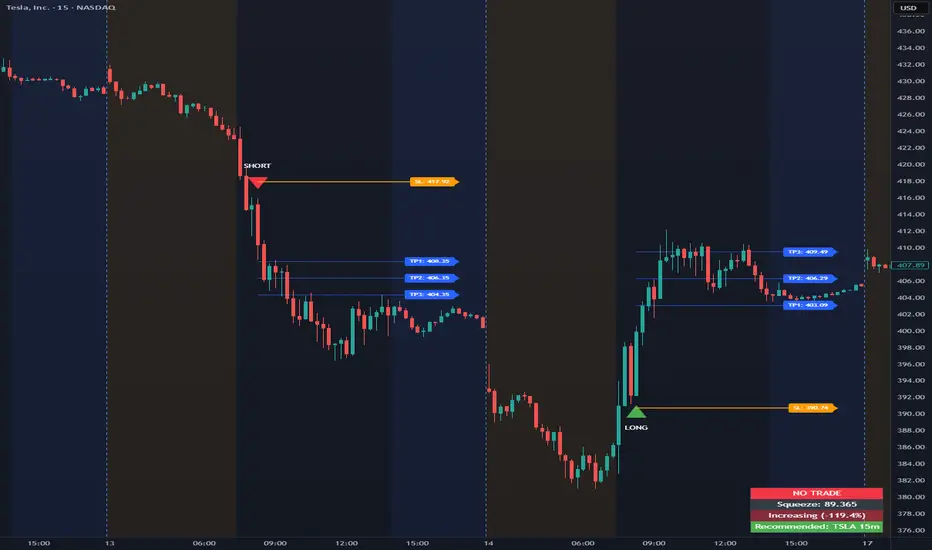
The Opening Range Intraday Indicator is a decision-support tool for intraday breakout entries. It combines an Opening Range Breakout (ORB) model with relative volume confirmation and a squeeze-style trend filter, then visualizes entries with clearly defined take-profit (TP) and stop-loss (SL) levels.
The indicator works on any ticker and any timeframe. However, its default parameters and internal logic are optimized for TSLA on the 15-minute chart, which is shown as a recommended context in the on-chart table for informational purposes only.
Core Logic
Opening Range Breakout
Establishes an opening range during the early session and monitors for confirmed breakouts above or below that range to generate potential intraday entries.
Relative Volume confirmation
Breakouts are validated using relative volume to help ensure participation and reduce low-quality signals during thin or inactive periods.
Squeeze / trend filter
A squeeze-style metric evaluates recent compression and directional behavior, helping to avoid entries during unfavorable or low-quality structural conditions.
Entry Visualization & Risk Levels
When a valid entry is confirmed, the indicator automatically:
Plots directional entry markers
Calculates and draws multiple take-profit levels
Draws a stop-loss level based on opening-range structure or ATR logic
Marks TP or SL hits directly on the chart for visual review
These visuals persist on the chart to allow traders to manually review trade structure and outcome over time.
On-Chart Table & Context Guidance
The indicator includes a compact on-chart table that displays:
Current squeeze value and short-term trend behavior
“No trade” conditions when structure is unfavorable
A recommended context message indicating whether the chart matches the optimized setup (TSLA on the 15-minute timeframe)
This message is informational only and does not restrict signals or functionality on other symbols or timeframes.
Flexibility & Controls
Users can customize:
Take-profit and stop-loss display behavior
Tight or standard stop-loss logic
Quiet windows near session close to suppress alerts
Visual settings and table positioning
This allows the indicator to be adapted to different instruments, volatility profiles, and execution styles.
Important Notes
This indicator does not execute trades and does not include automated backtesting or performance statistics.
TP/SL markers are visual aids only and are intended for manual review, not statistical validation.
Results will vary by symbol, timeframe, execution, and market conditions.
This indicator is intended as a research and decision-support tool for experienced intraday traders who understand execution risk, volatility, and position sizing. It should be used alongside proper risk management and independent analysis.
Open Range BreakoutOpen Range Breakout (ORB)
The Open Range Breakout (ORB) is a classic intraday strategy used across stocks, indices, FX and futures. It focuses on how price behaves during the first minutes of a major session, when liquidity and volatility are highest.
This indicator fully automates the ORB process with session detection, box drawing, breakout & retest logic, and final Buy/Sell signals.
Multi-Session Support
Choose between the three most important global opens:
Asia (Tokyo) – JPY pairs, Asian indices, gold, crypto
London – FX majors, European indices, strong volatility
New York – US indices, USD pairs, gold, oil, highest volume
The Opening Range is calculated only during the selected session.
ORB Range (5 / 15 / 30 min)
The indicator builds the ORB High/Low from the first X minutes of the session, draws the box, and waits for price action once the range is complete.
How It Works
ORB Window → High/Low of the opening minutes are recorded.
Breakout → Price closes above/below the ORB → “BREAKOUT” label.
Retest → Price returns to the ORB box → “RETEST” label.
Confirmation Levels Freeze → Upper/lower structure set.
Final Signal
Close above frozen upper level → BUY
Close below frozen lower level → SELL
This filters out false breakouts and provides structured continuation signals.
Alerts
Includes built-in alert conditions for:
ORB BUY Signal
ORB SELL Signal
Alerts trigger exactly when the Buy or Sell label appears.
Works On
Stocks & indices
Forex
Futures

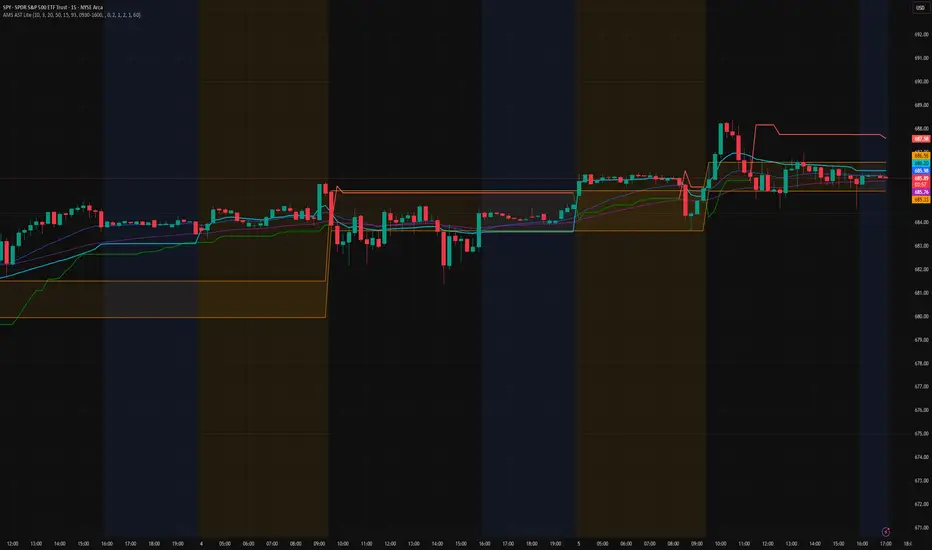
AMS Adaptive Supertrend Lite – ORB + VWAP 1.0AMS Adaptive Supertrend Lite – ORB + VWAP
This indicator focuses on providing a clean read of trend, structure, and opening range context without unnecessary complexity. It’s designed for traders who prefer straightforward visual tools that support their own decision-making process.
Consider this a small multi-tool for your basic ORB needs.
Included:
-Supertrend
A simple ATR-based Supertrend for directional context.
You can edit colors, line width, ATR settings, etc.
No signals or automation, just a clear trend reference.
-EMAs
Optional fast and slow EMAs for structural context.
Useful for gauging short-term momentum and slope.
-VWAP
A standard session VWAP.
You can style it however you like (solid, dashed, colored) in the Style tab.
-Opening Range (ORB)
Configurable ORB band including:
ORB duration (in minutes)
Optional RTH-only logic
Adjustable session window
Choice of timeframe used to build the ORB
Automatic hiding on higher timeframes (optional)
The ORB high/low are built on the selected lower timeframe and then displayed on the active chart.
-HTF Bias Shading (Optional)
A simple background tint based on EMA structure on a higher timeframe.
Meant to give gentle context, not trading signals.
Alerts
Two alerts are included:
Supertrend flipping bullish
Supertrend flipping bearish
These are notifications, not calls to action.
Intended Use
This is a visual tool for traders who want clear structure and context on their chart.
It does not provide entries, exits, strategies, or automated logic.
Disclaimer
This script is for educational and informational purposes only.
It is not financial advice, and no performance is guaranteed.
Always test tools for yourself and use proper risk management.
ORB_RDORB_RD - Opening Range Box (Ryan DeBraal)
This indicator automatically draws a high/low box for the first portion of
each trading day, automatically stepping the range window from 15, 30, 45,
up to 60 minutes after the session starts. The box updates live as the range
forms, then optionally extends across the rest of the session.
FEATURES
-----------------------------------------------------------------------------
• Opening Range Detection
- Automatically ladders the range window: 0–15, 0–30, 0–45, 0–60 minutes
- Automatic reset at each new trading day
- Live high/low updates while inside the 0–60 minute window
• Auto-Drawing Range Box
- Draws a dynamic rectangle as the range forms
- Top and bottom update with every new high/low
- Extends sideways in real time during formation
- Optional full-day extension after the 60-minute range finalizes
• Customizable Visuals
- Adjustable fill transparency
- Mild green tint by default for clarity
PURPOSE
-----------------------------------------------------------------------------
This tool highlights the evolving opening range, a widely used intraday
reference for breakout traders, mean-reversion setups, and session structure
analysis. Ideal for:
• Identifying early support and resistance
• Framing breakout and pullback decisions
• Tracking intraday trend bias after the morning range

Reversal SMC Suite Pro by TradeswithBThe Reversal SMC Suite is an intraday Smart Money Concepts toolkit designed to help traders visually analyze structure, imbalances, and displacement during trending or volatile sessions. This script combines multiple SMC elements—reversals, order blocks, FVGs, HTF bias, and pivot-based support/resistance—into one organized framework to support decision-making.
This indicator does not generate buy or sell signals and does not guarantee results. It is strictly a charting and visualization tool intended to help traders study market behavior.
🔍 Key Features
1. Reversal Detection
Swing Failure Pattern (SFP)
Bullish/Bearish Engulfing
Momentum candle detection (ATR-based)
Optional unified “reversal” signal
Visual arrows and reversal blocks
These are designed to highlight potential turning points based on price behavior—not to predict or guarantee outcomes.
2. HTF Trend Filter
Optional higher timeframe EMA/SMA filter
Customizable HTF resolution
Bias modes: Long only / Short only / Both
This helps you align lower-timeframe reversals with broader market context.
3. Dynamic Order Blocks
Automated OB detection (Body, Wick, or Hybrid)
Smart mitigation logic (body-based or wick-based)
Configurable lookback and OB count
Optional ATR body-size filter for OB quality
Real-time mitigation removal
These tools help visualize areas of interest where price previously showed displacement.
4. Fair Value Gaps (FVG)
Automatic gap detection
Optional FVG extension until filled
Per-side max FVG limit
Useful for identifying imbalance zones and measuring how price revisits inefficiencies.
5. Support / Resistance
Pivot-based S/R with left/right bar settings
Auto-drawing with customizable line counts
Optional S/R visibility toggle
🎛 Presets Included
Several visual configurations are included for convenience:
Custom / Manual (default)
Intraday ORB 5–15m (optimized for fast futures charts)
Clean SMC (Trend + OB)
FVG + OB Combo
Presets adjust inputs automatically to give new users cleaner starting points.
🧠 How To Use
This script is meant to be paired with any strategy or workflow that benefits from:
visual structure analysis,
HTF/LTF alignment,
OB + FVG context, or
intraday trend identification.
It does not replace risk management, strategy rules, or trade planning.
⚠️ Important Notes / Disclaimer
This indicator does not generate trading signals.
No part of this script guarantees profitable outcomes.
It is for educational and informational purposes only.
Always perform your own analysis and use proper risk management.
Past market behavior does not guarantee future results.

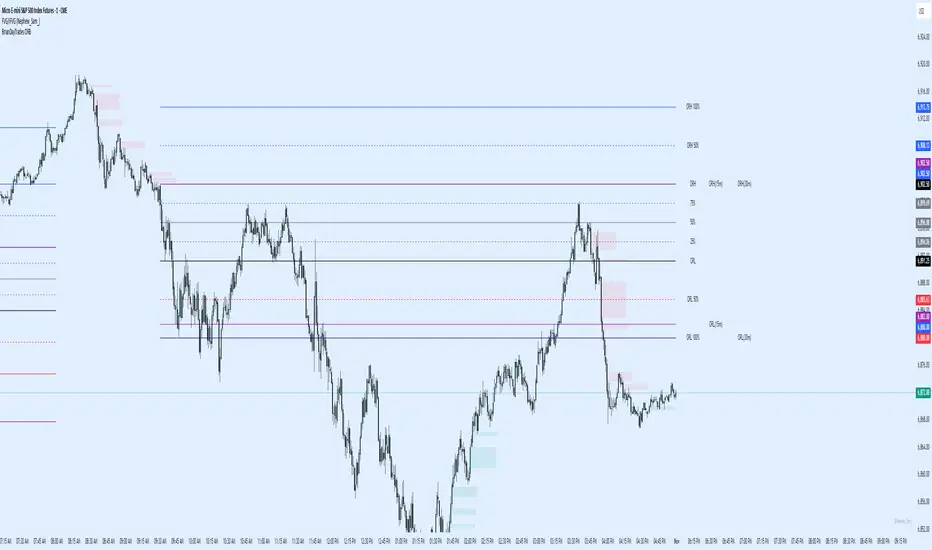
Session Open Range, Breakout & Trap Framework - TrendPredator OBSession Open Range, Breakout & Trap Framework — TrendPredator Open Box
Stacey Burke’s trading approach combines concepts from George Douglas Taylor, Tony Crabel, Steve Mauro, and Robert Schabacker. His framework focuses on reading price behaviour across daily templates and identifying how markets move through recurring cycles of expansion, contraction, and reversal. While effective, much of this analysis requires real-time interpretation of session-based behaviour, which can be demanding for traders working on lower intraday timeframes.
The TrendPredator indicators formalize parts of this methodology by introducing mechanical rules for multi-timeframe bias tracking and session structure analysis. They aim to present the key elements of the system—bias, breakouts, fakeouts, and range behaviour—in a consistent and objective way that reduces discretionary interpretation.
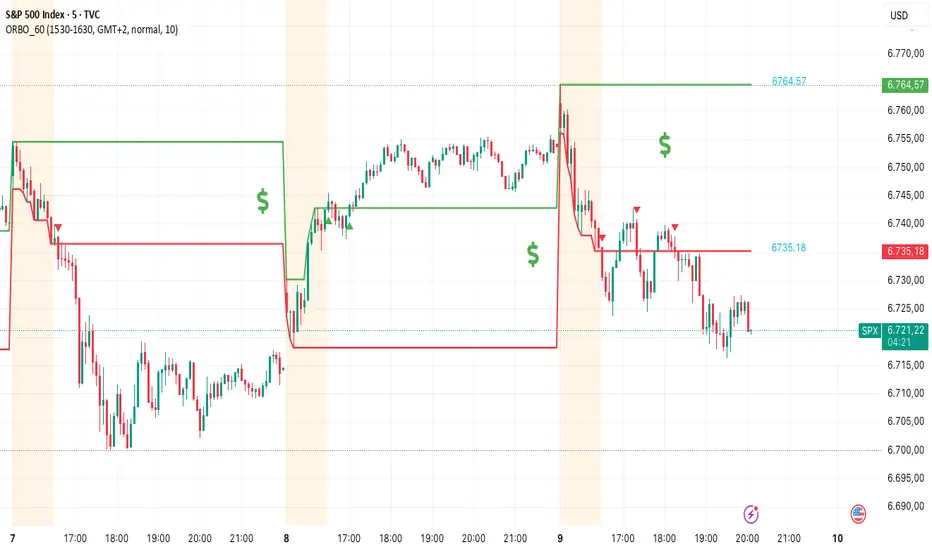
The Open Box indicator focuses specifically on the opening behaviour of major trading sessions. It builds on principles found in classical Open Range Breakout (ORB) techniques described by Tony Crabel, where a defined time window around the session open forms a structural reference range. Price behaviour relative to this range—breaking out, failing back inside, or expanding—can highlight developing session bias, potential trap formation, and directional conviction.
This indicator applies these concepts throughout the major equity sessions. It automatically maps the session’s initial range (“Open Box”) and tracks how price interacts with it as liquidity and volatility increase. It also incorporates related structural references such as:
* the first-hour high and low of the futures session
* the exact session open level
* an anchored VWAP starting at the session open
* automated expansion levels projected from the Open Box
In combination, these components provide a unified view of early session activity, including breakout attempts, fakeouts, VWAP reactions, and liquidity targeting. The Open Box offers a structured lens for observing how price transitions through the major sessions (Asia → London → New York) and how these behaviours relate to higher-timeframe bias defined in the broader TrendPredator framework.
Core Features
Open Box (Session Structure)
The indicator defines an initial session range beginning at the selected session open. This “Open Box” represents a fixed time window—commonly the first 30 minutes, or any user-defined duration—that serves as a structural reference for analysing early session behaviour.
The range highlights whether price remains inside the box, breaks out, or rejects the boundaries, providing a consistent foundation for interpreting early directional tendencies and recognising breakout, continuation, or fakeout characteristics.
How it works:
* At the session open, the indicator calculates the high and low over the specified time window.
* This range is plotted as the initial structure of the session.
* Price behaviour at the boundaries can illustrate emerging bias or potential trap formation.
* An optional secondary range (e.g., 15-minute high/low) can be enabled to capture early volatility with additional precision.
Inputs / Options:
* Session specifications (Tokyo, London, New York)
* Open Box start and end times (e.g., equity open + first 30 minutes, or any custom length)
* Open Box colour and label settings
* Formatting options for Open Box high and low lines
* Optional secondary range per session (e.g., 15-minute high/low)
* Forward extension of Open Box high/low lines
* Number of historic Open Boxes to display
Session VWAPs
The indicator plots VWAPs for each major trading session—Asia, London, and New York—anchored to their respective session opens. These session-specific VWAPs assist in tracking how value develops through the day and how price interacts with session-based volume distributions.
How it works:
* At each session open, a VWAP is anchored to the open price.
* The VWAP updates throughout the session as new volume and price data arrive.
* Deviations above or below the VWAP may indicate balance, imbalance, or directional control.
* Viewed together, session VWAPs help identify transitions in value across sessions.
Inputs / Options:
* Enable or disable VWAP per session
* Adjustable anchor and end times (optionally to end of day)
* Line styling and label settings
* Number of historic VWAPs to draw
First Hour High/Low Extensions
The indicator marks the high and low formed during the first hour of each session. These reference points often function as early control levels and provide context for assessing whether the session is establishing bias, consolidating, or exhibiting reversal behaviour.
How it works:
* After the session starts, the indicator records the highest and lowest prices during the first hour.
* These levels are plotted and extended across the session.
* They provide a visual reference for observing reactions, targets, or rejection zones.
Inputs / Options:
* Enable or disable for each session
* Line style, colour, and label visibility
* Number of historic sessions displayed
EQO Levels (Equity Open)
The indicator plots the opening price of each configured session. These “Equity Open” levels represent short-term reference points that can attract price early in the session.
Once the level is revisited after the Open Box has formed, it is automatically cut to avoid clutter. If not revisited, the line remains as an untested reference, similar to a naked point of control.
How it works:
* At session open, the open price is recorded.
* The level is plotted as a local reference.
* If price interacts with the level after the Open Box completes, the line is cut.
* Untested EQOs extend forward until interacted with.
Inputs / Options:
* Enable/disable per session
* Line style and label settings
* Optional extension into the next day
* Option for cutting vs. hiding on revisit
* Number of historic sessions displayed
OB Range Expansions (Automatic)
Range expansions are calculated from the height of the Open Box. These levels provide structured reference zones for identifying potential continuation or exhaustion areas within a session.
How it works:
* After the Open Box is formed, multiples of the range (e.g., 1×, 2×, 3×) are projected.
* These expansion levels are plotted above and below the range.
* Price reactions near these areas can illustrate continuation, hesitation, or potential reversal.
Inputs / Options:
* Enable or disable per session
* Select number of multiples
* Line style, colour, and label settings
* Extension length into the session
Stacey Burke 12-Candle Window Marker
The indicator can highlight the 12-candle window often referenced in Stacey Burke’s session methodology. This window represents the key active period of each session where breakout attempts, volatility shifts, and reversal signatures often occur.
How it works:
* A configurable window (default 12 candles) is highlighted from each session open.
* This window acts as a guide for observing active session behaviour.
* It remains visible throughout the session for structural context.
Inputs / Options:
* Enable/disable per session
* Configurable window duration (default: 3 hours)
* Colour and transparency controls
Concept and Integration
The Open Box is built around the same multi-timeframe logic that underpins the broader TrendPredator framework.
While higher-timeframe tools track bias and setups across the H8–D–W–M levels, the Open Box focuses on the H1–M30 domain to define session structure and observe how early intraday behaviour aligns with higher-timeframe conditions.
The indicator integrates with the TrendPredator FO (Breakout, Fakeout & Trend Switch Detector), which highlights microstructure signals on lower timeframes (M15/M5). Together they form a layered workflow:
* Higher timeframes: context, bias, and developing setups
* TrendPredator OB: intraday and intra-session structure
* TrendPredator FO: microstructure confirmation (e.g., FOL/FOH, switches)
This alignment provides a structured way to observe how daily directional context interacts with intraday behaviour.
See the public open source indicator TP FO here (click on it for access):
Practical Application
Before Session Open
* Review previous session Open Box, Open level, and VWAPs
* Assess how higher-timeframe bias aligns with potential intraday continuation or reversal
* Note untested EQO levels or VWAPs that may function as liquidity attractors
During Session Open
* Observe behaviour around the first-hour high/low and higher-timeframe reference levels
* Monitor how the M15 and 30-minute ranges close
* Track reactions relative to the session open level and the session VWAP
After the Open Box completes
* Assess price interaction with Open Box boundaries and first-hour levels
* Use microstructure signals (e.g., FOH/FOL, switches) for potential confirmation
* Refer to expansion levels as reference zones for management or target setting
After Session
* Review how price behaved relative to the Open Box, EQO levels, VWAPs, and expansion zones
* Analyse breakout attempts, fakeouts, and whether intraday structure aligned with the broader daily move
Example Workflow and Trade
1. Higher-timeframe analysis signals a Daily Fakeout Low Continuation (bullish context).
2. The New York session forms an Open Box; price breaks above and holds above the first-hour high.
3. A Fakeout Low + Switch Bar appears on M5 (via FO), after retesting the session VWAP triggering the entry.
4. 1x expansion level serves as reference targets for take profit.
Relation to the TrendPredator Ecosystem
The Open Box is part of the TrendPredator Indicator Family, designed to apply multi-timeframe logic consistently across:
* higher-timeframe context and setups
* intraday and session structure (OB)
* microstructure confirmation (FO)
Together, these modules offer a unified structure for analysing how daily and intraday cycles interact.
Disclaimer
This indicator is for educational purposes only and does not guarantee profits.
It does not provide buy or sell signals but highlights structural and behavioural areas for analysis.
Users are solely responsible for their trading decisions and outcomes.

GardFx - Fusion - ORBFusion ORB & Bias Monitor
This indicator is a comprehensive toolkit designed for session-based traders. It combines an Opening Range Breakout (ORB) visualizer with a Multi-Timeframe (MTF) trend bias dashboard. It is designed to help traders identify key session levels while keeping track of the broader market trend.
How it Works
1. Opening Range Breakout (ORB) Lines The script identifies the High and Low prices established during the first 15 minutes of a specific session or a manually defined start time.
Calculation: The script tracks the high and low values of candles occurring within the 15-minute window defined by the user settings. It then projects these levels forward using line.new.
Reset Logic: The lines automatically reset at the start of a new session (London or New York) or at specific reset times to ensure the chart remains clean for the next trading opportunity.
2. Multi-Timeframe Bias Dashboard The dashboard provides a quick "Bullish" or "Bearish" sentiment check across four timeframes: Daily, 4-Hour, 1-Hour, and 15-Minute.
Methodology: The script uses request.security to fetch the closing price and a 50-period Exponential Moving Average (EMA) for each timeframe.
Signal:
Bullish: Current Close > 50 EMA
Bearish: Current Close < 50 EMA
3. Exchange Clock & Session Tracker A built-in clock displays the current Exchange Time and identifies the active trading session (Asia, London, or New York). This uses timenow and timezone-specific checks to account for Daylight Savings Time shifts between London and New York.
Settings
Automate Session Times: Toggles between automatic detection of London (08:00) and NY (09:30) opens, or a manual user-defined start time.
Manual Start Hour/Minute: Defines the start of the ORB calculation if automation is disabled.
Bias EMA Length: Adjustable length for the trend detection EMA (Default: 50).
Visuals: Users can customize line colors, width, and toggle the mid-line display.
Usage This tool is best used on lower timeframes (e.g., 1-minute or 5-minute) to visualize the 15-minute opening range boundaries. Traders often observe price action around these high/low lines to determine potential breakouts or reversals, using the MTF Dashboard to align trades with the higher timeframe momentum.

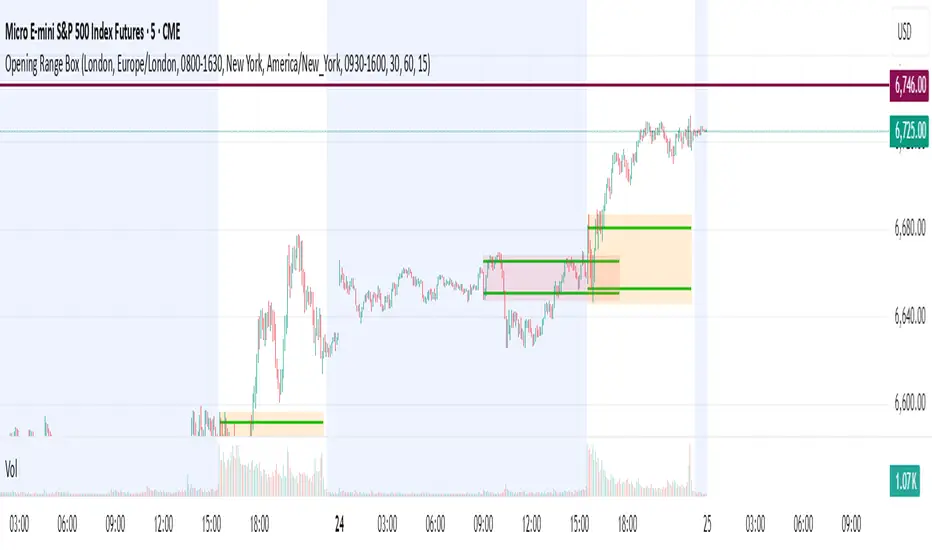
Opening Range Box, 2 SessionsOpening Range & Session Box Indicator
This indicator automatically draws Opening Range (OR) boxes and Session Boxes based on specific time zone settings, helping you visualize key trading periods across different global markets.
Key Features:
Custom Sessions: Define two independent trading sessions (e.g., New York and London).
Time Zone Selection: Choose the exact time zone for each session from a simple dropdown menu, ensuring accurate session mapping regardless of your chart's time zone.
Opening Range Definition: The initial portion of each session (defined by the Opening Range Minutes input) establishes the high and low of the box.
Offset Lines: Automatically draws two percentage offset lines inside the box, allowing you to easily track price movement relative to the Opening Range high and low (e.g., 10% retracement levels).
How to Use the Inputs:
Session A/B Timezone - Select the time zone for Session A (e.g., America/New_York).
Session A/B Time - Define the start and end time for Session A (e.g., 0930-1600).
Opening Range Minutes - Set how long the initial opening range period lasts (e.g., 30 minutes).
Percent from High/Low for Line - Set the percentage distance for the inner offset lines (e.g., 10.0 for 10% retracement).
Number of Boxes to Show - Controls the number of historical session boxes and lines that remain visible on the chart.
MTF Checklist DashboardMTF Checklist Dashboard
Overview
The MTF Checklist Dashboard is an advanced multi-timeframe analysis tool that provides traders with a comprehensive visual dashboard to analyze market conditions across six customizable timeframes simultaneously. This indicator combines multiple technical analysis methods, including Opening Range Breakouts (ORB), VWAP, EMAs, and daily price levels, to generate high-probability confluence-based trading signals.
Unlike traditional single-timeframe indicators, this dashboard displays all critical information in one organized table, allowing traders to instantly identify when multiple timeframes align for optimal entry and exit opportunities.
Key Features
Multi-Timeframe Analysis
Analyzes up to 6 timeframes simultaneously (default: 1m, 5m, 15m, 30m, 1h, 4h)
Fully customizable timeframe selection via comma-separated input
Color-coded cells for instant visual recognition (green=bullish, red=bearish, yellow=neutral)
Technical Indicators Tracked
Current and previous candle direction
Opening Range Breakout (ORB) positioning with custom period
VWAP relationship (above/below)
200 EMA positioning
Daily and previous day high/low proximity
EMA crossovers (9 vs 21, both vs 200)
Advanced Signal Filtering System
Confluence scoring: Requires multiple timeframes to align (3-6 timeframes)
Higher timeframe confirmation: Ensures 30m/1h/4h agreement
Volume filter: Confirms signals with above-average volume (1.5x default)
ATR volatility filter: Validates sufficient market movement
Session timing: Restricts signals to optimal trading hours (EST)
Momentum confirmation: Requires recent directional strength
Range positioning: Blocks signals near daily extremes
Candle strength: Validates strong directional candles (60%+ body ratio)
Visual Signals
Optional entry arrows (above/below bars)
Background color highlighting
Organized dashboard with real-time price levels
ORB range, current day, and previous day summary rows
Alert Conditions
JSON-formatted alerts for automated trading integration
Separate alerts for long entry, short entry, long exit, and short exit
Compatible with webhook automation systems
How To Use
Dashboard Interpretation
The dashboard displays a color-coded table with the following columns:
TF: Timeframe being analyzed
C: Current candle (Green=bullish, Red=bearish)
P: Previous candle (Green=bullish, Red=bearish)
ORB: Opening Range Breakout position (A=Above, B=Below, W=Within)
VWAP: Price vs VWAP (A=Above, B=Below)
E200: Price vs 200 EMA (A=Above, B=Below)
D Hi/Lo: Proximity to current day high/low (Hi/Lo/Mid)
PD Hi/Lo: Proximity to previous day high/low (Hi/Lo/Mid)
9 vs 21: EMA 9 vs EMA 21 relationship (A=9 above 21, B=9 below 21)
9&21 v200: Both EMAs vs 200 EMA (>>=both above, <<=both below, <>=mixed)
Signal Generation
Long Entry Signal triggers when:
Minimum number of timeframes show bullish alignment (default: 5 of 6)
Higher timeframes (30m/1h/4h) confirm direction (default: 2 of 3)
Price breaks above ORB high with sufficient distance
Volume exceeds average by specified multiplier
ATR shows adequate volatility
Trade occurs during optimal session hours
Recent momentum is upward
Price not too close to daily high
Strong bullish candle forms
Short Entry Signal uses opposite conditions
Exit Signals trigger when opposing timeframe confluence reaches threshold (default: 3 timeframes)
Recommended Workflow
Select your asset and primary trading timeframe
Observe the dashboard - Look for rows showing mostly green (bullish) or red (bearish)
Wait for alignment - The indicator will show arrows when confluence requirements are met
Check the bottom rows - Review ORB levels and daily ranges for context
Set alerts - Enable TradingView alerts using the built-in alert conditions
Manage risk - Use appropriate position sizing and stop losses based on ORB range or daily ATR
Settings Guide
Basic Settings
Timeframes: Enter comma-separated values (e.g., "1,5,15,30,60,240")
Show Header: Toggle column headers on/off
ORB Minutes: Set opening range period (default: 15 minutes)
Near % for daily highs/lows: Define proximity threshold (default: 0.20%)
Use close for comparisons: Compare using close vs current price
Dashboard Position: Choose from 9 screen positions
Confluence Filters
Minimum Timeframes Aligned: Set required confluence (3-6, default: 5)
Require Higher Timeframe Confirmation: Toggle HTF requirement on/off
Min Higher Timeframes: Specify HTF agreement needed (1-3, default: 2)
Volume Filter
Volume Confirmation: Enable/disable volume filtering
Volume vs Average: Set multiplier threshold (default: 1.5x)
Volume Average Length: Period for volume average (default: 20 bars)
Volatility Filter (ATR)
Volatility Filter: Enable/disable ATR confirmation
ATR Length: Calculation period (default: 14)
Min ATR vs Average: Required ATR level (default: 0.5x = 50%)
ORB Filters
ORB Breakout Distance Required: Toggle distance requirement
Min Breakout % Beyond ORB: Additional breakout threshold (default: 0.10%)
Session Filter
Trade Only During Best Hours: Enable time-based filtering
Session 1: First trading window (default: 0930-1130 EST)
Session 2: Second trading window (default: 1400-1530 EST)
Momentum Filter
Recent Momentum Required: Enable directional momentum check
Lookback Bars: Period for momentum comparison (default: 3 bars)
Daily Range Filter
Block Signals Near Daily Extremes: Prevent entries at extremes
Distance from High/Low %: Minimum distance required (default: 2.0%)
Candle Filter
Strong Directional Candle: Require candle strength
Min Candle Body %: Body-to-range ratio threshold (default: 60%)
Visual Signals
Show Entry Signals: Master toggle for visual signals
Show Arrows: Display entry arrows on chart
Background Color: Enable background highlighting
Best Practices
Start with default settings and adjust based on your trading style and asset volatility
Higher confluence requirements (5-6 timeframes) produce fewer but higher-quality signals
Enable all filters for conservative trading; disable some for more frequent signals
Use the dashboard as confirmation alongside your existing trading strategy
Backtest on your specific instruments before live trading
Consider market conditions—trending vs ranging markets may require different settings
Alerts
This indicator includes four alert conditions with JSON formatting for webhook integration:
Long Entry Signal: Triggers when all long conditions are met
Short Entry Signal: Triggers when all short conditions are met
Long Exit Signal: Triggers when opposing confluence reaches exit threshold
Short Exit Signal: Triggers when opposing confluence reaches exit threshold
Alert messages include ticker symbol, action (buy/sell), price, and quantity for automated trading systems.
Important Notes
This indicator works best on liquid instruments with clear price action
Highly volatile markets may require adjusted ATR and ORB distance settings
Session times are in EST timezone—adjust if trading non-US markets
The ORB calculation requires sufficient price history for the day
Signals are generated in real-time but should be confirmed at candle close
Limitations
Maximum of 6 timeframes can be analyzed due to TradingView's security call limits
ORB calculations may not work correctly on instruments with gaps or irregular sessions
The indicator is most effective during regular market hours when volume and volatility are adequate
Lower timeframes (1m, 5m) may produce more false signals in choppy conditions
License
Mozilla Public License 2.0 (MPL-2.0)
This indicator is licensed under the Mozilla Public License 2.0. You are free to use, modify, and distribute this code under the terms of the MPL-2.0. The full license text is available at mozilla.org
Key license provisions:
You may use this code commercially
You may modify and distribute modified versions
Modified versions must be released under the same license
You must include the original license notice in any distributions
No trademark rights are granted
Disclaimer
This indicator is provided for educational and informational purposes only. It is not financial advice, and past performance does not guarantee future results. Trading involves substantial risk of loss. Always:
Practice proper risk management
Test thoroughly on paper/demo accounts before live trading
Use appropriate position sizing
Never risk more than you can afford to lose
Consult with a financial advisor for personalized advice
The creator assumes no liability for trading losses incurred using this indicator.
Version: 2.0
Pine Script Version: v6
Author: © EliasVictor

ORB Pro SuiteOverview
ORB Pro with Filters + Debug Overlay is an advanced Opening Range Breakout indicator designed for precision intraday trading. It defines a configurable ORB window, automatically builds the breakout range, and triggers long or short signals only when all active filters align. The script also includes a built-in debug overlay that explains why each breakout is accepted or blocked, allowing traders to fine-tune entries with transparency.
What Makes It Unique
• Modular filter stack – close-confirmation vs. instant breaks, retest confirmation with adjustable tolerance %, volume-spike and EMA-trend filters, ORB-size range, session cutoff, and cooldown logic.
• Non-blocking debug overlay – inline or corner display of the exact rejection reason (“Too late,” “Low volume,” “Trend mismatch,” etc.).
• Fully customizable visuals – choose shaded, outline, or line-only ORB styles; set opacity, border color, and right-edge offset so the box never hides current candles.
• Integrated reversal engine – detects doji, hammer, and engulfing structures within a time-filtered window and optional VWAP/EMA confluence.
How It Works
During the defined opening window (default 9:30 – 9:45 NY), the indicator records the session high and low.
After the box closes, it looks for breakouts confirmed by candle close or retest (per user settings).
Each signal passes through range, volume, trend, time-delay, and session filters before printing.
Visual stop-loss / take-profit levels appear for reference using either R:R multiples or fixed %.
The optional reversal layer marks short-term exhaustion zones for counter-scalp setups.
Usage Guidelines
• Apply to standard candlestick charts (not Heikin Ashi, Renko, or Range).
• Select your local ORB start / end time, then enable or disable filters based on your playbook.
• Use the “Outline only” or “Corner table” debug modes for a cleaner chart.
• The script provides visual and alert-based confirmations only; it does not execute orders or backtest performance.
Inputs at a Glance
– ORB window (start/end time)
– Close-confirm toggle
– Retest tolerance %
– Volume SMA length
– EMA length for trend filter
– Min/Max range % filter
– Cooldown bars and session cutoff
– Visual R:R ratio or fixed SL/TP %
– Box style, opacity, border width / color
– Debug overlay mode (inline or table) and leader lines
Notes & Disclaimers
• This script is for analysis and educational purposes only. It does not constitute financial advice or guarantee performance.
• Signals are calculated on completed bars without lookahead.
• Invite-only access ensures version integrity and controlled distribution.
© Trades with B – Original development in Pine v6. Reuse of this code requires explicit permission from the author.

ORB 30 Alerts (ATH)Overview
ATH ORB 30m automates the Opening Range Breakout (ORB) process across multiple global sessions — Tokyo, London, and New York — and delivers clean, consolidated alerts when fresh breakouts occur.
It’s built for traders who track several tickers and want precise, non-repeating signals that reflect genuine momentum shifts, not constant noise.
How it works
The script defines a 30-minute Opening Range (ORB) for each enabled session and plots its high, low, and midpoint levels.
Every 10-minute candle close is evaluated to detect first-time crosses of those range boundaries — upward or downward.
Once a breakout triggers, that side’s alert is disabled until price returns inside the range, where the system automatically re-arms.
Multiple triggers in the same bar are batched into one combined alert, listing all symbols that broke out.
A built-in debug panel and optional chart labels visualize each trigger and re-arm event in real time.
Key features
-Multi-session ORB logic (Tokyo, London, New York)
-10-minute confirmation filter to validate breakouts
-Automatic alert re-arming when price re-enters range
-Combined per-bar alert messages (no duplicates)
-Optional on-chart labels and debug diagnostics
-Optimized for watchlists and multi-symbol scanners
Usage
Designed for day traders and momentum scalpers, this tool highlights early directional strength during market opens.
Add it to your chart, enable your preferred sessions, and set alert conditions for “ORB Breakouts (BUY),” “ORB Breakdowns (SELL),” or "Any alert() function call" You’ll receive one concise message each bar showing exactly which symbols broke out and in which direction.
DISCLAIMER:
This script is for educational and informational purposes only.
It does not constitute financial advice or a recommendation to buy or sell any security.
Always perform your own due diligence and backtesting before using any trading strategy live.
Trading involves risk; past performance does not guarantee future results.

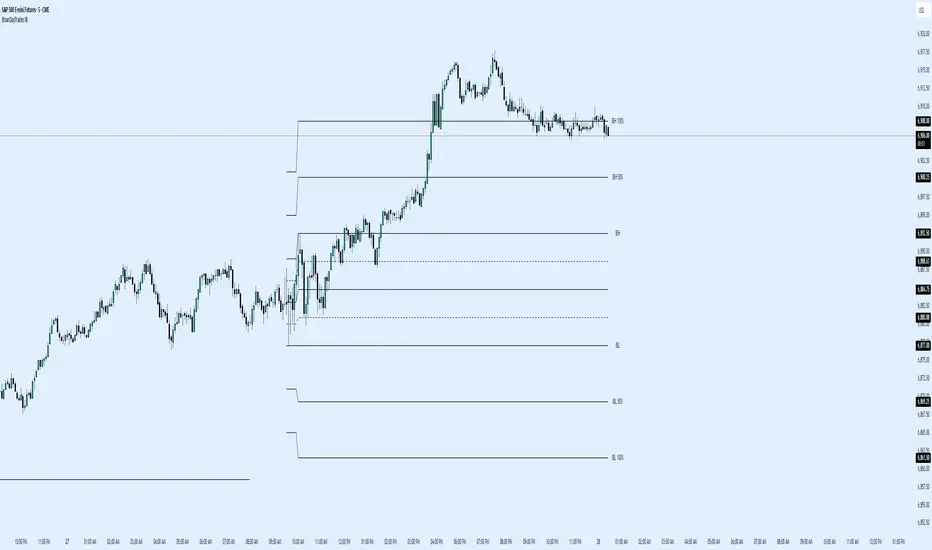
BrianDayTrades ORBThis script enables you to trade the 5m, 15m, or 30m ORB or any combination. You can select the main one you want, and see 25%, 50%, 75% lines as well as 50% and 100% extension lines above and below.
ORBSMMAATRVOLREENTRY2Contracts📈 Opening Range Fibonacci Breakout (TradingView Strategy)
Overview:
The Opening Range Fibonacci Breakout strategy is designed to capture high-probability intraday moves by combining the power of the 15-minute opening range, trend confirmation via SMMA, and volume-based momentum filtering.
At the start of each trading session, the script automatically plots the Opening Range Box based on the first 15 minutes of price action — highlighting key intraday support and resistance levels.
How It Works:
Opening Range Setup
The first 15 minutes of the session define the range high and low.
A visual box marks this zone on the chart for easy reference.
Signal Generation
A Smoothed Moving Average (SMMA) with a user-defined period determines overall trend bias.
Candle volume is analyzed to confirm momentum strength.
Long Signal: Price breaks above the opening range high, SMMA trending up, and volume supports the move.
Short Signal: Price breaks below the opening range low, SMMA trending down, and volume supports the move.
Take Profit & Targets
Fibonacci extension levels are automatically plotted from the opening range.
These dynamic levels serve as structured Take Profit (TP) zones for partial or full exits.
Features:
✅ 15-Minute Opening Range Box
✅ Adjustable SMMA period
✅ Volume-based confirmation filter
✅ Automatic Fibonacci profit targets
✅ Visual Long/Short alerts & signals
Ideal For:
Scalpers and intraday traders who rely on early-session momentum, breakout confirmation, and precision exit targets.
Backtested for MNQ/NQ futures trading

BrianDayTrades IBThis indicator plots the Initial Balance for the NY Open. This takes the high and low of the first hour between 9:30am and 10:30am New York time.
You can adjust which lines and labels are shown.
The Initial Balance high and low are shown with 25%, 50%, 75% lines; as well as 50% and 100% above and below the IB range for targets to use as take profits.
FUTURA ORB.o3 Stategy (Gap + Dynamic Risk)ORB Strategy
Includes Mini & Micro Futures
Dynamic Risk based position sizing
Adjustable RR Levels
Gap Detection
Default settings are for NQ & MNQ.
Adjust as needed for different futures.

BORB 5m 15m IB5m and 15m OR indicator with 100% extensions for each.
Also has Initial Balance with 50% extensions.
NY session.

Opening Range + Daily LevelsA comprehensive multi-timeframe indicator designed for intraday traders who need critical support/resistance levels and EMAs all in one clean display.
Features:
📊 EMAs
9 EMA (default: white)
21 EMA (default: orange)
📅 Previous Day Levels
Yesterday's High, Low, Open, and Close
Lines extend progressively through the current session
Clean visual separation between trading days
📈 Previous Week Levels
Last Week's High, Low, Open, and Close
Dotted lines that extend through the current week
Perfect for identifying major support/resistance zones
🌙 Pre-Market Session (12:00 AM - 7:30 AM)
Pre-Market High and Low
Tracks overnight price action
Extends through the trading day
⏰ 15-Minute Opening Range (7:30 AM - 7:45 AM)
Opening Range High and Low with shaded box
Fibonacci retracement levels (0.382, 0.5, 0.618)
Golden ratio levels (0.382 & 0.618) in gold, midpoint (0.5) in dotted gray
Customization:
Adjustable timezone settings
Fully customizable colors for all levels
Adjustable line widths
Toggle Fibonacci levels on/off
Perfect For:
Day traders who need key levels at a glance
Price action traders using previous session data
Opening range breakout strategies
Multi-timeframe analysis
All levels update automatically and extend progressively as the day progresses, with labels staying visible at the current bar edge.

The Wave Levels (ORB Indicator)This Indicator is made for the ORB trader. It's purpose is to help make your charting faster by providing some basic key levels to reference at a glance. This was optimized to be used on the 5m timeframe.
Key features:
1. Green and Red ORB rays to indicate the 15 minute Opening Range. These ranges will only extend as long as its respective session's length.
2. Previous sessions zones for historical easily identification of historical data (best used in UTC-4 timezone)
3. White Liquidity Rays. These rays are used to mark a previous session's high or low which hasn't been swept yet. This makes for a good TP area or identifying a potential reversal area.
Once a previous session high or low has been taken, the ray will automatically remove.
I am not a professional coder. This indicator was created by continuously prompting AI commands over the course of 3 days.

BTS_ORB_V1.0Description
This indicator displays Opening Range Breakouts (ORB) based on a fully customizable time window — for example, 15, 30, or 60 minutes after the market open.
All parameters can be adjusted: start time, end time, range display, and chart visualization.
Additionally, alerts can be triggered on closed candles, both for breakouts above and below the defined range.
Perfect for traders who rely on precise breakout signals after the opening phase and want to automate their strategies with smart alerts.
With this ORB indicator you can:
• Customize the opening range window
• Set automatic breakout alerts on candle close
• Test different timeframes (e.g. 15 min / 60 min / custom)
• Visualize clean long and short breakout zones
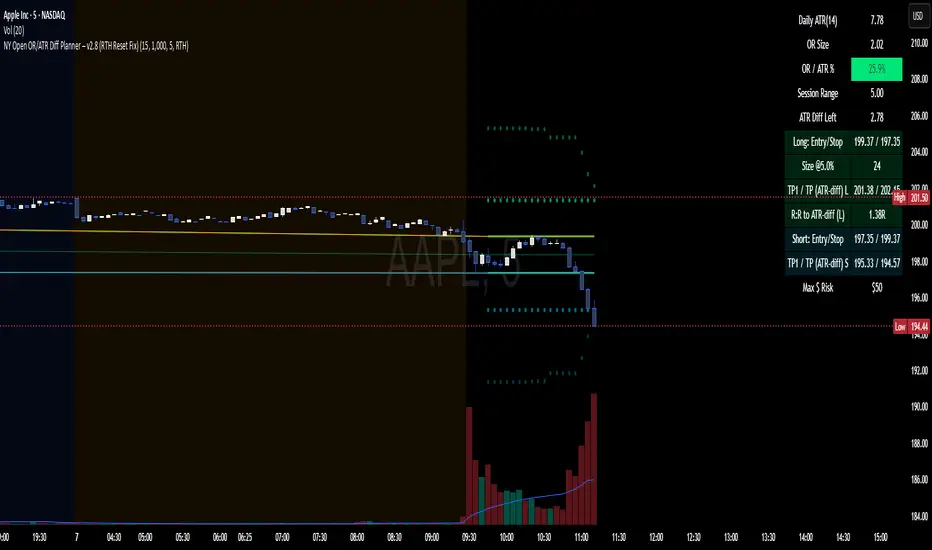
NY Open OR/ATR Diff Planner – v2.8 NY Open OR/ATR Diff Planner – v2.8 (Hi-Contrast)
Trade the Opening Range Breakout with a plan, not vibes.
This tool builds the NY Opening Range (OR) from the cash open and overlays a complete, risk-based execution plan: precise entry, structural stop, position size, targets, and R:R — all tied to the Daily ATR(14) and the remaining ATR “fuel” left in the day.
What it does
Opening Range: First N minutes after 09:30 ET (choose 5/15/30/60).
Today-only lines: Automatically resets at 09:30; no carry-over from prior days.
Session aware: Works on RTH or ETH charts. OR always anchors at 09:30 ET.
Fuel model: Computes Session Range (since 09:30) and ATR Diff Left = Daily ATR − Session Range.
Entries & Stops:
Long plan: Entry = ORH, Stop = ORL
Short plan: Entry = ORL, Stop = ORH
Targets:
TP1 = 1R (distance of entry→stop)
TP (ATR-diff cap): Entry ± ATR Diff Left (caps greed when the day’s ATR is nearly spent)
Sizing & R:R: Position size = Account × Risk% / Risk per share, with live R:R to ATR-diff target.
Hi-contrast table: Clear readout of Daily ATR, OR size, OR/ATR%, Session Range, ATR left, entries/stops/TPs, size, and max $ risk.
Inputs
Opening Range (minutes): 5 / 15 / 30 / 60
Account Size ($) and Risk % per trade
Session mode: RTH (09:30–16:00) or ETH (chart’s session; still anchored at 09:30)
Also show Short plan (toggle)
Show info table (toggle)
How to use
Add on a 1–5m chart.
Choose your OR window (e.g., 15m = 09:30–09:45).
Set Account Size and Risk % (e.g., 4–5% for small accounts; adjust to taste).
Wait for the OR to complete.
Trade the break/retest with the levels shown:
Long: Break of ORH, SL at ORL, TP1 = 1R, TP2 = ATR-diff cap.
Short: Mirror logic.
If OR/ATR% > ~50% (red), the “fuel” is thin — be selective.
Why it helps build an edge
Objective structure: Clear levels and sizing remove guesswork.
Context-aware targets: ATR-diff keeps targets realistic to the day’s potential.
Discipline by design: One framework that’s easy to review, journal, and iterate.
Notes
This is an indicator (visual planner), not an order-placing strategy.
If you want a back testable version (one trade/day, optional retest rule, TP/SL logic), say the word — I can publish a strategy variant.
Keywords: ORB, Opening Range, ATR, Risk Management, Position Sizing, Day Trading, NYSE Open, Mean Reversion Fuel, Execution Planner
ORB Breakout Traffic Signal (5/15/30)ORB Breakout Traffic Signal (5/15/30)
This indicator visualizes Opening Range Breakouts (ORB) for the first 5, 15, and 30 minutes of the US regular trading session (09:30–16:00 ET).
It provides a compact, easy-to-read traffic signal table on your chart to show whether price is breaking out, breaking down, or consolidating inside the range.
🔑 Features
Auto-anchors at 09:30 ET (converted to your local time automatically).
Tracks ORB High/Low for:
5-minute window (09:30–09:34)
15-minute window (09:30–09:44)
30-minute window (09:30–09:59)
Displays results in a compact table:
↑ (green) → price has broken above the ORB high
↓ (red) → price has broken below the ORB low
• (gray) → price remains inside the ORB range (optional; can be disabled)
Customizable:
Toggle which ORBs to show (5m, 15m, 30m)
Choose table position (top/bottom left/right)
Adjustable text size
Option to plot the ORB High/Low lines on your chart
📌 Usage
Designed for intraday traders watching US equities/ETFs/futures.
Works best on 1-minute or 5-minute charts with Extended Hours turned OFF (so the session starts exactly at 09:30 ET).
Helps you quickly spot early breakouts (5m), mid-session trends (15m), or confirmed directional moves (30m).
⚠️ Notes
Signals only update during the RTH session
Outside market hours, the last locked ORB and signal remain displayed until the next open.
This tool is for analysis/visualization only; not a buy/sell signal. Always combine with your own trading strategy and risk management.
👉 Perfect for traders who want a quick visual confirmation of whether price is breaking out of the opening range or stuck inside it.

Multi-Session Opening RangesThe Multi-Session Opening Ranges indicator plots the Opening Range (OR) levels for three major trading sessions: Asia, London, and New York. It displays the high (ORH), low (ORL), and midline of each session's opening range, helping traders identify key price levels for potential breakouts, reversals, or support/resistance zones.
This indicator is highly customizable, allowing users to tailor the appearance and behavior of each session independently.
Features
Multi-Session Support: Visualizes Opening Ranges for Asia, London, and New York sessions, with customizable session times and timezones.
Customizable Lines: Adjust the color, style (solid, dashed, dotted), and width of ORH, ORL, and midline for each session.
Offset Control: Set a custom offset (in bars) for lines and labels to position them away from price action for better visibility.
Fill Customization: Choose the fill color for the area between ORH and ORL for each session.
Historical Data Option: Toggle the display of historical OR levels to focus on current session data or analyze past ranges.
Timezone Flexibility: Select from a wide range of timezones to align session times with your trading needs.
Label Customization: Adjust the size of labels (tiny, small, normal, large, huge) for clarity on any chart.
How It Works
The indicator identifies the high and low prices during the user-defined opening range period for each session (default: 5 minutes). It then draws:
ORH (Opening Range High): The highest price during the session's opening range.
ORL (Opening Range Low): The lowest price during the session's opening range.
Midline: The average of ORH and ORL, plotted as a dashed line by default.
Filled Area: A semi-transparent fill between ORH and ORL to highlight the range.
Lines and labels extend until the start of the next session or can be offset by a user-specified number of bars for better chart readability. The indicator supports historical data display for analyzing past session ranges.
Inputs
Display:
Show Historical Data: Enable/disable historical OR levels.
Timezone: Select the timezone for session calculations (e.g., UTC-4, UTC+1, etc.).
Asia/London/New York Sessions:
Show Session: Enable/disable the session.
Session Time: Define the start and end time for the opening range (e.g., "0930-0935:1234567" for 9:30–9:35 AM, all days).
Asia/London/New York Style:
ORH/ORL/Midline Color: Set the color for each line.
ORH/ORL/Midline Style: Choose solid, dashed, or dotted styles.
ORH/ORL/Midline Width: Adjust line thickness (1–5).
OR Fill Color: Customize the fill color for the OR area.
Lines/Labels Offset: Set the offset (in bars, -50 to 50) to shift lines and labels relative to price action.
General Style:
Label Size: Set the size of ORH and ORL labels (tiny, small, normal, large, huge).
Usage
Add the indicator to your chart.
Configure session times to match your trading instrument and timezone.
Customize colors, line styles, widths, and offsets for each session to suit your chart preferences.
Use the ORH, ORL, and midline levels to identify key price zones for trading strategies, such as breakouts or reversals.
Notes
Ensure session times do not overlap to avoid conflicts in visualization.
Large offsets may place lines/labels outside the visible chart area; adjust as needed.
The indicator is optimized for intraday timeframes but works on any timeframe.
