S&R Zones + Signals V6.4 (Rejection & Break)This indicator is to trigger once the Candle go into the Zone, get rejection and Break
المؤشرات والاستراتيجيات

avax by dionfor adding liquidity for view the trend then avax foundation adding liquidity whats the price action

Triple Supertrend + EMA CrossoverCustomized 3 supertrend and EMA crossover which is helpful for identification of the trend.

Supertrend + EMA + RSI Algo (Low Risk High Accuracy)This is a trend-following + momentum confirmation strategy designed to reduce false signals and control loss.
Supertrend (10,3) → Identifies overall market direction (Buy in uptrend, Sell in downtrend)
EMA 50 & EMA 200 → Confirms strong trend and avoids sideways market
Buy only when EMA 50 is above EMA 200
Sell only when EMA 50 is below EMA 200
RSI (14) → Confirms momentum
Buy when RSI > 55 (strong bullish momentum)
Sell when RSI < 45 (strong bearish momentum)
---
🔹 Entry Logic
BUY: Market is in uptrend + strong momentum
SELL: Market is in downtrend + strong bearish pressure
---
🔹 Risk Management (Most Important)
Stop Loss: Based on ATR (adapts to volatility)
Target: Fixed Risk-Reward ratio (example: 1 : 2.5)
This keeps loss small and profits larger
---
🔹 Best Use Case
Works best in trending markets
Ideal timeframes: 15m, 1h, 4h
Suitable for crypto futures & swing trading
Beginner-friendly if used with low leverage

High Volume Breakout DetectorThis indicator is a dedicated volume analysis tool displayed in a separate pane below the price chart. It visually highlights significant volume surges (spikes) by comparing the current bar's volume to a dynamic threshold based on a Simple Moving Average (SMA) of volume.
Key Concepts and Methodology:
- The core calculation uses a user-configurable Simple Moving Average (default: 20 periods) of historical volume to establish a baseline of "normal" trading activity.
- A customizable multiplier (default: 1.50, meaning 150% of the SMA) defines the threshold for a volume spike. When the current bar's volume meets or exceeds this threshold, it is classified as a spike—indicating unusually high participation that often accompanies breakouts, reversals, climaxes, or institutional activity.
- Volume bars are plotted as columns and colored based on two factors:
- Candle direction: Green shades for bullish candles (close ≥ open), red shades for bearish candles (close < open).
- Spike status: Brighter/solid colors for confirmed spikes, muted/translucent colors for normal volume. This candle-matched coloring helps traders quickly assess whether the surge supports buying pressure (green spike on up candle) or selling/distribution (red spike on down candle).
- Optional overlays include the volume SMA line (blue) and the dynamic threshold line (orange, plotted as circles for easy distinction).
Features and Customization:
- Fully adjustable inputs: SMA length, multiplier threshold, colors for up/down/normal/spike bars, and toggles for showing the SMA line, threshold line, or background highlighting on spikes.
- Built-in alert condition triggers reliably on volume spikes (≥ selected multiplier of SMA), with a constant message string including ticker, timeframe, volume value, and threshold reference.
How to Use:
- Add to any chart in a separate pane (overlay=false).
- Look for brighter colored volume bars as potential signals of conviction in price moves. For example:
- Green spikes on up candles may signal strong accumulation or breakout confirmation.
- Red spikes on down candles may indicate distribution or exhaustion selling.
- Combine with price action, support/resistance, or trend indicators for confluence.
- Ideal for day trading, swing trading, or spotting volume climaxes on stocks, forex, crypto, or futures across any timeframe.
The unique combination of candle-direction-matched coloring for spikes, visual threshold plotting, and focused spike highlighting provides clearer, more actionable insight into directional volume pressure compared to standard volume displays.

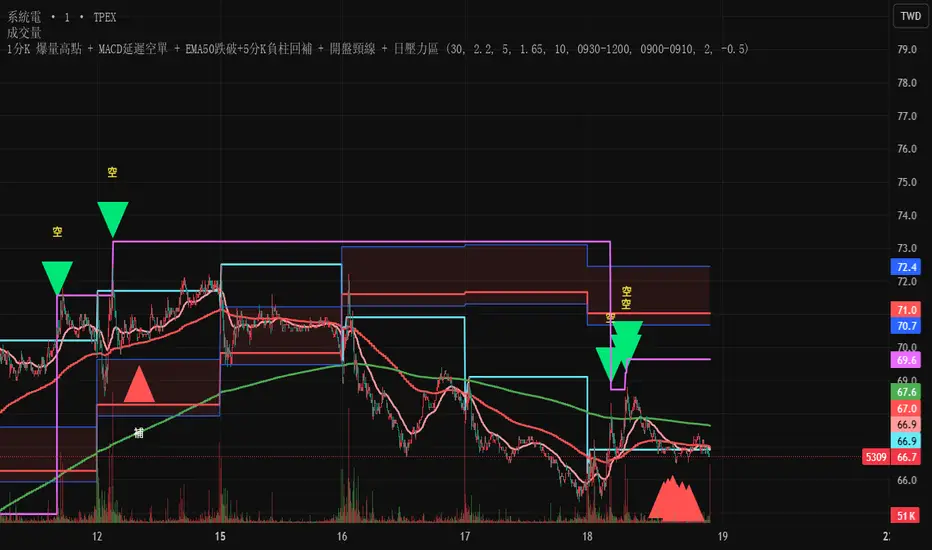
Test此指標為測試階段
最近手法改變,高點出現率後移,
此指標為爆量後跌破12ema才放空,
由於操盤手還是可以騙線,故時間設定為10:00之後成功率比較大
This indicator is in the testing phase.
Recently, the method has changed, and the occurrence rate of high points has shifted later.
This indicator only calls for shorting after a surge in volume followed by a drop below the 12-day moving average (EMA).
Because traders can still create false signals, setting the time after 10:00 AM increases the success rate.
MTF rsi/stoch imdI just built this indicator.
It displays a multi-timeframe (MTF) table directly on the chart, showing Stoch RSI K and RSI values per timeframe.
Cell background colors are driven by predefined value ranges, while text color turns green or red depending on whether the value is rising or falling compared to the previous candle on the same timeframe.
The RSI color conditions are based on the levels 36, 46, 56, and 65.
The Timeframe Pack selector works as follows:
Pack 1 (BNC): 3m, 9m, 27m, 1h, 81m, 3h, 9h, 12h, 1D, 3D, 1W, 9D
Pack 2: 1h through 24h
Pack 3: 1D through 24D
Pack 4 (Custom): fully user-defined timeframes via the 24 slots
Only when Pack 4 (Custom) is selected do the custom timeframe slots apply; in Packs 1–3 they are ignored.
All visual behavior (box colors, text colors, transparency, or a single-color override) is configurable under Style, and the entire table can be toggled on or off.

EMA12/50 如果放空後趨勢由背景紅轉綠可以考慮常抱
抱到背景再次翻紅而比較不被雜訊洗掉
現階段指標合併在一起會出BUG
If the trend changes from red to green after shorting, consider holding for a longer period.
Hold until the background turns red again to avoid being washed out by noise.
Currently, merging them together will cause bugs.

Custom ORB (Adjustable Time + Alerts)Opening range Breakout for the current day only. Time frame and be adjusted for first 15 min, 30 min, e.g., 9:30 am to 9:45 am or to 10 am, etc. You can add price alerts for high and low. You can also change the color of solid lines.

Adaptive Trend-Based Fib Extension + TrendlinesThis advanced analysis tool is designed to take the guesswork out of Fibonacci trading. By combining Adaptive Fibonacci Extensions with multi-method Pivot Detection, Dynamic Trendlines, and Horizontal Support/Resistance, this indicator provides a comprehensive roadmap for any market trend.
Learn volume trading - @pricevolumetraders
Key Features
Adaptive Fibonacci Engine: Unlike static tools, this indicator uses an ATR-based adaptive factor to adjust extension levels according to current market volatility.
Smart Trend Detection: Automatically identifies trend direction using EMA cross-overs or Higher High/Higher Low sequences to determine whether to plot Bullish or Bearish extensions.
Multi-Method Pivots: Choose from six different pivot detection methods, including Volume-Based, Fractal, ATR-Based, and Long Wick detection, to suit your specific trading style.
Automated Trendlines & S/R: High-probability diagonal trendlines and horizontal S/R levels are drawn only when they meet a minimum "touch" requirement and volume confirmation.
Institutional Zones: Highlights the "Golden Zone" between the 127.2% and 161.8% extension levels, where trends often reach exhaustion or find major targets.
How to Use
Trend Alignment: Use the built-in Dashboard to quickly identify the current trend (Bull/Bear) and RSI momentum.
The 3-Point Setup: The indicator automatically finds Point 1 (Trend Start), Point 2 (Impulse End), and Point 3 (Retracement/Last Touch) to project future price targets.
Entry Confirmation: Look for price action near the 61.8% or 78.6% Retracement levels for high-probability entries in the direction of the trend.
Targeting: Use the extension levels (100%, 127.2%, 161.8%) as your primary Take Profit zones.
Confluence: The strongest setups occur when a Fibonacci level aligns perfectly with a Horizontal S/R line or a Diagonal Trendline.
Technical Settings
Pivot Settings: Adjust 'Left' and 'Right' bars to change the sensitivity of swing high/low detection.
Fib Timeframe: You can anchor Fibonacci levels to a higher timeframe (e.g., 1-hour levels) while trading on a lower timeframe (e.g., 5-minute).
Volume Multiplier: Filter for horizontal levels that were formed with significant institutional volume.
Disclaimer: Trading involves significant risk. This tool is for educational and analytical purposes only and should be used in conjunction with a complete trading plan.

First Presented FVGSummary: First Presented FVG Indicator
This is a Pine Script v6 TradingView indicator that identifies and visualizes the first Fair Value Gap (FVG) that forms within configurable time windows during a trading session.
What it Does
1. Detects FVGs : Uses the classic 3-candle FVG definition:
- Bullish FVG: When low > high (gap up)
- Bearish FVG: When high < low (gap down)
2. "First Presented" Logic : For each configured time slot, it captures only the first qualifying FVG that forms—subsequent FVGs in that window are ignored.
3. Visual Display :
- Draws a colored box spanning from detection time to session end
- Optional text label showing detection time (e.g., "9:38 Tue FP FVG")
- Optional grade lines at 25%, 50%, and 75% levels within the FVG
Key Configuration
Setting Description
Timeframe Only works on 5-minute charts or lower
Timezone IANA timezone for session times (default: America/New_York)
Session Futures trading hours (default: 1800-1715)
Min FVG Size Minimum gap size in ticks to qualify
4 Time Slots Each with enable toggle, time window, and color
Default Time Slots
Slot 1 (enabled): 09:30-10:30 — lime green
Slot 2 (enabled): 13:30-14:30 — blue
Slot 3 (disabled): 13:00-13:30 — teal
Slot 4 (disabled): 14:15-14:45 — fuchsia
Technical Features
Handles cross-midnight sessions correctly
Resets all drawings at each new session
Skips the first bar of each window to ensure valid 3-candle lookback
Clamps slot windows to session boundaries

10>20,p>50 DEMARenders daily EMA, 10, 20 and 50 on any timeframe below 1D
30m timeframe works well.
Use trend of 10 > 20 + price > 50 for long and 10 < 20 + price < 50 for shorts or exits.

GME Warrant Tracker [theUltimator5]The GME Warrant Tracker was designed to be used for GME warrants tracking. The theory behind this indicator is that warrants are priced similarly to options and generally follow the same Greeks. With that assumption, we can break down the price of the warrants by using known Greeks to estimate either the theoretical price, or even estimate Implied Volatility (IV).
The base settings for this indicator plot the calculated IV, the theoretical price (there are multiple methods of calculation which I will discuss later) and the current warrant price.
You can toggle on or off all of these plots to display only what you want to track.
For example, you can simply track the difference between the theoretical price and the current price to see if warrants are trading at a premium or a discount vs what the indicator calculates it to be.
Calculating implied volatility is extremely difficult and must be approximated.
The theoretical warrant price produced by this indicator depends primarily on the volatility input (σ) used in the Black–Scholes pricing model.
This script supports five distinct methods for approximating σ, each extracting different information from the market.
1) Close-to-Close Historical Volatility
Close-to-Close computes the standard deviation of daily close-to-close returns and uses a lookback window scaled to time-to-expiry. As the expiration approaches, the lookback window tightens, giving a more responsive volatility approximation relative to time-to-expiry.
This option produces conservative approximations for volatility, and may lag actual volatility intraday.
2) Parkinson High-Low Volatility
Parkinson High-Low volatility uses daily high and low prices to calculate intraday trading range for a more responsive estimation to volatility. It ignores opening and close gaps, so overnight volatility is not accounted for.
This option produces higher theoretical volatility during choppy price action and can over estimate actual volatility.
3) Garman–Klass Volatility
Garman–Klass volatility is a way to estimate how much price is fluctuating by using the open, high, low, and close for each period. Because it draws on multiple intraperiod price points (not just the range or close-to-close moves), it typically produces a tighter, more informative volatility estimate than simpler approaches. It’s often most helpful when gaps occur and when the open and close carry meaningful information about the session’s trading.
4)Yang–Zhang Volatility
The Yang–Zhang volatility estimator is designed to account for both opening jumps and price drift. It estimates volatility by combining overnight (close-to-open) variance, intraday (open-to-close) variance, and a weighted Rogers–Satchell component using OHLC data, often yielding a more robust measure than simpler close-to-close style estimators.
5) Option price
By default, the indicator uses the call option strike dated closest to the warrant expiration date. Since the Greeks for both the warrants and the
options are assumed to be equivalent with a minor difference in theta (time-to-expiry), the theoretical price of the warrants closely matches the trade price of the call strike chosen.
There is a table that can be enabled (off by default because it is large and fills entire screen on mobile) which shows all the configuration settings and Greeks.
You can also manually adjust the "dilution" factor for the warrants, which shifts the number of active warrants and moves the count into the shares outstanding for the underlying (GME). The reason for this is that as warrants get exercised, the total quantity of warrants in circulation decreases and the the total quantity of shares outstanding increases.
Since this indicator was built around the single warrant, ticker NYSE: GME/W, it is only meant to be used with NYSE:GME. Any other ticker will not work properly with this indicator.

A program written by a beginner# TXF Choppy Market Detector (Whipsaw Filter)
## Introduction
This project is a technical indicator developed in **Pine Script v5**, specifically optimized for **Taiwan Index Futures (TXF)** intraday trading.
The TXF market is known for its frequent periods of low-volatility consolidation following sharp moves, often resulting in "whipsaws" (double-loss scenarios for trend followers). This script utilizes **volatility analysis** and **trend efficiency metrics** to filter out noise and detect potential "Stop Hunting" or "Liquidity Sweep" setups within range-bound markets.
## Methodology & Algorithms
The strategy operates on the principle of **Mean Reversion**, combining two core components:
### 1. Market Regime Filter: Choppiness Index (CHOP)
We use the Choppiness Index (originally developed by E.W. Dreiss) to determine if the market is trending or consolidating based on **Fractal Dimension** theory.
* **Logic**:
The index ranges from 0 to 100. Higher values indicate low trend efficiency (consolidation), while lower values indicate strong directional trends.
* **Condition**: `CHOP > Threshold` (Default: 50).
* **Application**: When this condition is met, the background turns **gray**, signaling a "No-Trade Zone" for trend strategies and activating the Mean Reversion logic.
### 2. Whipsaw Detection: Bollinger Bands
Bollinger Bands are used to define the dynamic statistical extremities of price action.
* **Logic**:
We identify **Fakeouts** (False Breakouts) that occur specifically during the choppy regime identified above. This is often where institutional traders hunt for liquidity (stops) before reversing the price.
#### Signal Algorithms (Pseudocode)
**A. Bull Trap (Washout High)**
A false upside breakout designed to trap long traders.
```pine
Condition:
1. Is_Choppy == true (Market is sideways)
2. High > Upper_Bollinger_Band (Price pierces the upper band)
3. Close < Upper_Bollinger_Band (Price fails to hold and closes back inside)

Lot Size CalculatorSimple indicator that calculating how many shares you can buy based on your deposit.

Monthly High/Low - [JTCAPITAL]Monthly High/Low Probability Table - is a modified way to use historical monthly high and low tracking combined with probabilistic analysis for bullish and bearish months to detect potential patterns in monthly price behavior.
The indicator works by calculating in the following steps:
Variable Declaration
Persistent variables ( var ) are used to store monthly highs, lows, open and close prices, and the days on which highs and lows occurred. Separate arrays track bullish and bearish month statistics for highs and lows ( highBull, lowBull, highBear, lowBear ). Counters ( bullCount, bearCount ) store the number of bullish and bearish months recorded.
New Month Detection
The script detects the start of a new month by comparing the current bar’s month to the previous bar’s month. If a new month is detected, the script proceeds to update statistics for the previous month.
Monthly High/Low Recording and Classification
At the start of each new month, the previous month’s high, low, open, and close are evaluated:
If monthClose > monthOpen , the month is classified as bullish.
If monthClose < monthOpen , the month is classified as bearish.
The arrays ( highBull, lowBull, highBear, lowBear ) are updated at the respective high and low days of the month by incrementing counts, which allows the script to keep track of the frequency of monthly highs and lows occurring on specific days.
Monthly High/Low Tracking
During the month, the script continuously updates monthHigh and monthLow if the current bar’s high exceeds monthHigh or the low is below monthLow . The days on which these highs and lows occur are recorded ( highDay and lowDay ). The monthClose variable is continuously updated to the latest closing price.
Probability Calculation
Once monthly data is accumulated, the script calculates probabilities for each day of the month:
bullHighProb and bullLowProb represent the probability (in percentage) that a bullish month’s high or low occurred on a given day.
bearHighProb and bearLowProb represent the probability for bearish months.
These probabilities are calculated by dividing the count of high or low occurrences on each day by the total number of bullish or bearish months, then multiplying by 100. This probabilistic approach allows traders to see recurring patterns for highs and lows across multiple months.
Gradient Coloring Function
The helper function gradientRelative computes a color gradient between lowColor and highColor based on the relative probability value. Higher probabilities are colored closer to highColor , and lower probabilities closer to lowColor . This visual representation allows for quick identification of the most probable days for highs and lows in bullish or bearish months.
Dynamic Updates
As new bars are processed, the table is updated in real-time with new probabilities reflecting the most recent month’s data. This dynamic behavior ensures that the table remains accurate and responsive to the latest market information.
Buy and Sell Conditions:
This indicator does not provide direct buy or sell signals. Instead, it provides probabilistic information about historical patterns for bullish and bearish months. Traders can use the table to:
Identify days in the month where highs or lows are statistically more likely to occur.
Combine with other trend-following or reversal strategies to optimize entry and exit points.
For example, if a trader notices that bullish month highs frequently occur around day 15, they may plan trades around that period when other indicators align.
Features and Parameters:
Dynamic Probability Table : Updates in real-time as new monthly data becomes available.
Historical Pattern Tracking : Maintains arrays for highs and lows in bullish and bearish months.
Gradient Visualization : Uses color interpolation to quickly highlight higher probability days.
Specifications:
Monthly High/Low Tracking
Tracks the highest and lowest prices within each month. This is the foundation of the probability calculations. It allows traders to understand when significant price events historically occur.
Bullish/Bearish Month Classification
Each month is classified based on the relationship between monthClose and monthOpen . This provides context for the high/low occurrences: whether they happened in bullish or bearish months.
High/Low Occurrence Arrays
Four arrays ( highBull, lowBull, highBear, lowBear ) store the count of high and low occurrences for each day of the month. These arrays are the core of the statistical analysis.
Probability Calculation
Divides the count of occurrences for each day by the total number of months in that category (bullish/bearish). Multiplying by 100 converts this to a percentage probability, giving traders a numerical sense of recurrence.
Real-Time Updates
The table and probabilities are recalculated and refreshed with each new bar. This ensures that traders have the most current information available without manual recalculation.
User-Centric Visualization
By showing probabilities for both bullish and bearish months separately, traders gain a deeper understanding of market tendencies and recurring monthly patterns, which can be leveraged for improved timing and strategy alignment.
Important:
There is a misalign in percentages due to not all months having the same amount of days.

BK AK-Zenith💥 Introducing BK AK-ZENITH — Adaptive Rhythm RSI for Peak/Valley Warfare 💥
This is not another generic RSI. This is ZENITH: it measures where momentum is on the scale, then tells you when it’s hitting extremes, when it’s turning, and when price is lying through its teeth with divergence.
At its core, ZENITH does one thing ruthlessly well:
it matches the oscillator’s period to the market’s current rhythm—adaptive when the market is fast, adaptive when the market is slow—so your signals stop being “late because the settings were wrong.”
🎖 Full Credit — Respect the Origin (AlgoAlpha)
The core RSI architecture in this form belongs to AlgoAlpha—one of the best introducers and coders on TradingView. They originated this adaptive/Rhythm-RSI framework and the way it’s presented and engineered.
BK AK-ZENITH is my enhancement layer on top of AlgoAlpha’s foundation.
I kept the spine intact, and I added tactical systems: clearer Peak/Valley warfare logic, pivot governance (anti-spam), divergence strike markers, momentum flip confirmation, and a war-room readout—so it trades like a weapon, not a toy.
Respect where it started: AlgoAlpha built the engine. I tuned it for battlefield use.
🧠 What Exactly is BK AK-ZENITH?
BK AK-ZENITH is an Adaptive Period RSI (or fixed if you choose), designed to read momentum like a range of intent rather than a single overbought/oversold gimmick.
Core Systems Inside ZENITH
✅ Adaptive Period RSI (Rhythm Engine)
Automatically adjusts its internal RSI length to match current market cadence.
(Optional fixed length mode if you want static.)
✅ Optional HMA Smoothing
Cleaner shape without turning it into a laggy moving average.
✅ Peak / Valley Zones (default 80/20)
Hard boundaries that define “true extremes” so you stop treating every wiggle like a signal.
✅ Pivot-Based BUY/SELL Triangles + Cooldown
Signals are governed by pivots and a cooldown so it doesn’t machine-gun trash.
✅ Momentum Flip Diamonds (◇)
Shows when the oscillator’s slope flips—clean confirmation for “engine change.”
✅ Divergence Lightning (⚡)
Exposes when price is performing confidence while momentum is quietly breaking.
✅ War-Room Table / Meter
Bias, zone, reading, and adaptive period printed so you don’t “interpret”—you execute.
✅ Alerts Suite
Pivots, divergences, zone entries—so the chart calls you, not your emotions.
🎯 How to use it (execution rules)
1) Zones = permission
Valley (≤ Valley level): demand territory. Stalk reversal structure; stop chasing breakdown candles.
Peak (≥ Peak level): supply territory. Harvest, tighten, stop adding risk at the top.
2) Pivot triangles = the shot clock
Your ▲/▼ signals are pivot-confirmed with a cooldown. That’s intentional.
This is designed to force patience and prevent overtrading.
3) Divergence = truth serum
When price makes the “confident” high/high or low/low but ZENITH disagrees, you’re seeing internal change before the crowd does.
Treat divergence as warning + timing context, not a gambling button.
4) Meter/Table = discipline
If you can’t summarize the state in one glance, you’ll overtrade. ZENITH prints the state so your brain stops inventing stories.
🔧 Settings that actually matter
Adaptive Period ON (default): the whole point of ZENITH
Peak/Valley levels: how strict extremes must be
Pivot strength + Cooldown: your anti-spam governor
Divergence pivot length: controls how “major” divergence must be
The “AK” in the name is an acknowledgment of my mentor A.K. His standards—patience, precision, clarity, emotional control—are why this tool is built with governors instead of hype.
And above all: all praise to Gd—the true source of wisdom, restraint, and right timing.
👑 King Solomon Lens — ZENITH Discernment
Solomon asked Gd for something most people never ask for: not wealth, not victory—discernment. The ability to separate what looks true from what is true.
That is exactly what momentum work is supposed to do.
1) Honest weights, honest measures.
In Solomon’s world, crooked scales were an abomination because they disguised reality. In trading, the crooked scale is your own excitement: you see one green candle and call it strength. ZENITH forces an honest measure—0 to 100—so you deal in degree, not drama. A Peak is not “bullish.” A Peak is “momentum priced in.” A Valley is not “bearish.” A Valley is “selling pressure reaching exhaustion.”
2) Wisdom adapts to seasons.
Solomon’s order wasn’t chaos—there was a time to build, a time to harvest, a time to wait. Markets have seasons too: trend seasons, chop seasons, compression seasons, expansion seasons. Fixed-length RSI pretends every season is the same. ZENITH does not. It listens for rhythm and adjusts its internal timing so your read stays relevant to today’s market tempo—not last month’s.
3) The sword test: revealing what’s hidden.
Solomon’s most famous judgment wasn’t about theatrics—it was about revealing the truth beneath appearances. Divergence is that same test in markets: price can perform strength while the engine quietly weakens, or perform weakness while momentum secretly repairs. The ⚡ is not a prophecy. It’s a revelation: “what you see on price is not the full story.”
That’s ZENITH discipline: measure → discern → execute.
And may Gd bless your judgment to act only when the measure is clean.
⚔️ Final
BK AK-ZENITH is a momentum fire-control system: adaptive rhythm + extreme zones + pivot timing + divergence truth.
Use it to stop feeling trades and start weighing them. Praise to Gd always. 🙏

BK AK-IED💥 Introducing BK AK-IED — Volatility Ignition / Expansion / Detonation 💥
A pressure-to-release weapon system for traders who want timing, not noise.
Markets don’t move clean because they “feel like it.” They load, they ignite, and then they detonate into expansion. BK AK-IED is built to expose that sequence in real time—so you stop trading randomness and start trading regime shifts.
⚔️ What BK AK-IED is
BK AK-IED is a 3-speed VWMA energy oscillator that blends price movement + volume into a single pressure readout:
Fast (5) = ignition energy (range-driven)
Medium (21) = core pressure engine
Slow (55) = structural volatility backdrop
It’s not a “direction oracle.” It’s an energy meter that tells you when the market is coiling, when it’s waking up, and when it’s breaking out with force.
🧠 Core Weapon Systems
✅ Dynamic Scaling
Keeps the oscillator readable across symbols (no ridiculous y-axis blowouts).
✅ Volatility State Bar (Bottom Strip) — Your War Room
🟨 CONTRACTION = VWMA convergence / coil / pressure loading
🟩 EXPANSION = energy spike begins
🟥 BREAKOUT = expansion without contraction (release phase)
⬜ NEUTRAL = dead zone, don’t force it
✅ Breakout Peak Icons (Crown markers)
Crowns print only when there’s true breakout energy and the move hits major peak territory versus recent extremes. Translation:
tighten risk, scale-out, stop getting greedy. These are exhaustion warnings—not automatic reversals.
Timeframe-adaptive peak filtering is built in:
< 1H: stricter peak requirement
≥ 1H: more realistic swing threshold
🧭 How to use it (execution, not opinions)
1) 🟨 Contraction = don’t bleed.
This is the chop factory. You wait. You map levels. You stalk.
2) 🟩 Expansion = prepare.
Start aligning with structure: trend framework, VWAP, key levels, HTF bias.
3) 🟥 Breakout = engage.
This is where moves pay. Trade the direction your structure supports and manage risk like a professional.
4) 👑 Peak during breakout = harvest / protect.
Scale. Tighten stops. Don’t turn winners into donations.
🧱 Inputs that matter (what you’re actually tuning)
Amplitude Multiplier = how aggressive the energy read is
VWMA Spread Contraction Threshold = how tight “coil” must be to count
Scale Lookback = how far back the dynamic scaling references
Peak Thresholds = how selective peaks are (auto-switches based on timeframe)
The “AK” in the name is an acknowledgment of my mentor A.K. His standards (patience, precision, clarity, and emotional control) are a major reason I build tools with structure instead of hype.
And above all: all praise to Gd — the true source of wisdom, restraint, and right timing.
👑 King Solomon Lens — ZENITH Discipline
Solomon didn’t build greatness by impulse. He built it by measure, order, and restraint.
When the Temple was built, the stones were prepared away from the site—so the structure went up with precision, not chaos. That is the market lesson: the decisive moment is loud, but the preparation is silent. If you only show up for the noise, you will always arrive late.
BK AK-IED is that Solomon blueprint on a chart:
🟨 Contraction is the quarry.
The market is cutting the stones in silence. This is where the undisciplined burn money “doing something.” The wise do the opposite: they reduce noise, define levels, and wait.
🟩 Expansion is the line being set.
Pressure starts to move. This is where you bring structure online—bias, levels, risk plan. Not excitement.
🟥 Breakout is the placement.
The stone drops into position. This is the only phase where aggression is righteous—because it’s backed by a real shift, not hope.
👑 Peak icons are ZENITH—crown-of-the-move logic.
Zenith is where force and momentum reach their highest point before decay begins. The crown is not “celebrate and add.” The crown is govern yourself: harvest, tighten, protect. Solomon’s edge wasn’t prediction—it was rule over the self. That’s what separates profit from punishment.
This is what wisdom looks like in trading: not guessing the future—governing your exposure when the present is telling you the truth. And may Gd bless your restraint as much as your entries, because restraint is where survival becomes power.
✅ Final
BK AK-IED is your volatility weapon for market warfare:
Load → Ignite → Detonate.
Use it with structure. Use it with discipline. And give praise to Gd for every protected loss, every clean entry, and every moment you didn’t force a trade. 🙏

First presented FVG (w/stats) w/statistical hourly ranges & biasOverview
This indicator identifies the first Fair Value Gap (FVG) that forms during each hourly session and provides comprehensive statistical analysis based on 12 years of historical NASDAQ (NQ) data. It combines price action analysis with probability-based statistics to help traders make informed decisions.
⚠️ IMPORTANT - Compatibility
Market: This indicator is designed exclusively for NASDAQ futures (NQ/MNQ)
Timeframe: Statistical data is based on FVGs formed on the 5-minute timeframe
FVG Detection: Works on any timeframe, but use 5-minute for accuracy matching the statistical analysis
All hardcoded statistics are derived from 12 years of NQ historical data
What It Does
1. FVG Detection & Visualization
Automatically detects the first FVG (bullish or bearish) that forms each hour
Draws colored boxes around FVGs:
Blue boxes = Bullish FVG (gap up)
Red boxes = Bearish FVG (gap down)
FVG boxes extend to the end of the hour
Optional midpoint lines show the center of each FVG
Uses volume imbalance logic (outside prints) to refine FVG boundaries
2. Hourly Reference Lines
Vertical Delimiter: Marks the start of each hour
Hourly Open Line: Shows where the current hour opened
Expected Range Lines: Projects the anticipated high/low based on historical data
Choose between Mean (average) or Median (middle value) statistics
Upper range line (teal/green)
Lower range line (red)
All lines span exactly one hour from the moment it opens
Optional labels show price values at line ends
3. Real-Time Statistics Table
The table displays live data for the current hour only:
Hour: Current hour in 12-hour format (AM/PM)
FVG Status: Shows if a Bull FVG, Bear FVG, or no FVG has formed yet
Green background = Bullish FVG detected
Red background = Bearish FVG detected
1st 15min: Direction of the first 15 minutes (Bullish/Bearish/Neutral/Pending)
Continuation %: Historical probability that the hour continues in the first 15-minute direction
Color-coded: Green for bullish, red for bearish
Avg Range %: Expected percentage range for the current hour (based on 12-year mean)
FVG Effect %: Historical probability that FVG direction predicts hourly close direction
Shows BISI→Bull % for bullish FVGs
Shows SIBI→Bear % for bearish FVGs
Blank if no FVG has formed yet
Time Left: Countdown timer showing MM:SS remaining in the hour (updates in real-time)
Hourly Bias: Historical directional tendency (bullish % or bearish %)
H Open: Current hour's opening price
Exp Range: Projected price range (Low - High) based on historical average
Customization Options
Detection Settings:
Lower Timeframe Selection (15S, 1min, 5min) - controls FVG detection granularity
Display Settings:
FVG box colors (bullish/bearish)
Midpoint lines (show/hide, color, style)
Table Settings:
Position (9 locations: corners, edges, center)
Text size (Tiny, Small, Normal, Large)
Hourly Lines:
Toggle each line type on/off
Hour delimiter (color, width)
Open line (color, width, style)
Range lines (color, width, style)
Choose Mean or Median statistics for range calculation
Show/hide labels with customizable text size
How to Use
Apply to NQ futures chart (NQ1! or MNQ1!)
Set chart to 5-minute timeframe for optimal FVG detection matching the statistical data
Watch for the first FVG to form each hour
Reference the table for probability-based decision support:
High continuation % = strong directional bias
FVG Effect % shows reliability of the FVG signal
Time Left helps manage entries/exits within the hour
Use range lines as potential targets or reversal zones
Statistical Foundation
All statistics are derived from:
12 years of NASDAQ (NQ) historical data
Hourly analysis of FVG formation patterns
First 15-minute directional analysis
Mean and Median calculations for range expectations
Data encompasses 2,400+ samples per hour
Best Practices
✅ Use on NQ/MNQ futures only
✅ Best on 5-minute charts (matches statistical data)
✅ Combine FVG signals with continuation probabilities
✅ Use range lines as potential profit targets
✅ Watch the countdown timer for hour-end setups
❌ Do not use on other markets (statistics won't apply)
❌ Avoid using during low-liquidity hours (5PM ET has minimal data)
Technical Notes
Timezone: America/New_York (EST/EDT)
Weekend filtering: Automatically hides data during market closure
Updates in real-time on live bars
Maximum 500 boxes/lines for performance
FVG detection includes volume imbalance (body gap) refinement
Credits
Statistical analysis based on 12 years of NASDAQ historical data. FVG detection methodology follows ICT concepts with volume imbalance refinement.
Disclaimer: This indicator provides statistical analysis based on historical data. Past performance does not guarantee future results. Always use proper risk management.
Would you like me to adjust any section or add/remove anything?6-9 Session & Levels - Customizable Range Analysis Indicator
Description:
This indicator provides comprehensive session-based range analysis designed for intraday traders. It calculates and displays key levels based on a customizable session period (default 6:00-9:00 AM ET).
Core Features:
Sespastedthis is a summary for another indicator- i was hoping for something more like this in terms of content etc22:23Architected comprehensive indicator summary matching professional documentation style.The user wants me to rewrite the summary for their FVG indicator in a similar style to the example provided. The example is more structured, detailed, and professional. Let me create a comprehensive summary that follows that format:
Clear title
Description/Overview
Core Features (broken down into sections)
Input Settings Explained (detailed breakdown of all customization options)
How It Works section
Use Case
Note/Disclaimer
Let me make it thorough and match the style while being accurate to their indicator's functionality.Here's a detailed summary in that format:
Every Hour 1st FVG with Statistical Analysis - NASDAQ Hourly Trading Intelligence
Description:
This indicator identifies the first Fair Value Gap (FVG) that forms during each hourly session and provides comprehensive probability-based statistical analysis derived from 12 years of NASDAQ (NQ) historical data. It combines real-time FVG detection with hardcoded statistical probabilities to help intraday traders make informed decisions based on historical patterns and hourly price action dynamics.
IMPORTANT: This indicator is specifically calibrated for NASDAQ futures (NQ/MNQ) only. All statistical data is derived from 12 years of NQ historical analysis with FVGs detected on the 5-minute timeframe. Using this indicator on other markets will produce invalid statistical results.
Core Features:
FVG Detection & Visualization
Automatically detects and displays the first Fair Value Gap (bullish or bearish) that forms within each hourly session
Color-coded boxes mark FVG zones: Blue for bullish FVGs (gap up), Red for bearish FVGs (gap down)
FVG boxes extend precisely to the end of the hour boundary
Optional midpoint lines show the center point of each FVG
Uses volume imbalance logic (outside prints) to refine FVG boundaries beyond simple wick-to-wick gaps
Supports both chart timeframe detection and lower timeframe detection via request.security_lower_tf
Hourly Reference Lines
Vertical Hour Delimiter: Marks the exact start of each new hour with an extendable vertical line
Hourly Open Line: Displays the opening price of the current hour
Expected Range Lines: Projects anticipated high and low levels based on 12 years of statistical data
Choose between Mean (average) or Median (middle value) calculations
Upper range line shows expected high
Lower range line shows expected low
All lines span exactly one hour from open to close
Optional labels display exact price values at the end of each line
Real-Time Statistics Table
Displays comprehensive live data for the current hour only:
Hour: Current hour in 12-hour format (e.g., "9AM", "2PM")
FVG Status: Shows detection state with color coding
"None Yet" (white background) - No FVG detected
"Bull FVG" (green background) - Bullish FVG identified
"Bear FVG" (red background) - Bearish FVG identified
1st 15min: Direction of first 15 minutes (Bullish/Bearish/Neutral/Pending)
Continuation %: Historical probability that the hour closes in the direction of the first 15 minutes
Green background with up arrow (↑) for bullish continuation probability
Red background with down arrow (↓) for bearish continuation probability
Avg Range %: Expected percentage range for the current hour based on 12-year mean
FVG Effect %: Historical effectiveness of FVG directional prediction
Shows "BISI→Bull %" for bullish FVGs (gap up predicting bullish hourly close)
Shows "SIBI→Bear %" for bearish FVGs (gap down predicting bearish hourly close)
Displays blank if no FVG has formed yet
Time Left: Real-time countdown timer showing minutes and seconds remaining in the hour (MM:SS format)
Hourly Bias: Historical directional tendency showing bullish or bearish percentage bias
H Open: Current hour's opening price
Exp Range: Projected price range showing "Low - High" based on selected statistic (mean or median)
Input Settings Explained:
Detection Settings
Lower Timeframe: Select the base timeframe for FVG detection
Options: 15S (15 seconds), 1 (1 minute), 5 (5 minutes)
Recommendation: Use 5-minute to match the statistical data sample
The indicator uses this timeframe to scan for FVG patterns even when viewing higher timeframes
Display Settings
Bullish FVG Color: Set the color and transparency for bullish (upward) FVG boxes
Bearish FVG Color: Set the color and transparency for bearish (downward) FVG boxes
Show Midpoint Lines: Toggle horizontal lines at the center of each FVG box
Midpoint Line Color: Customize the midpoint line color
Midpoint Line Style: Choose between Solid, Dotted, or Dashed line styles
Table Settings
Table Position: Choose from 9 locations:
Top: Left, Center, Right
Middle: Left, Center, Right
Bottom: Left, Center, Right
Table Text Size: Select from Tiny, Small, Normal, or Large for readability on different screen sizes
Hourly Lines Settings
Show Hourly Lines: Master toggle for all hourly reference lines
Show Hour Delimiter: Toggle the vertical line marking each hour's start
Delimiter Color: Customize color and transparency
Delimiter Width: Set line thickness (1-5)
Show Hourly Open: Toggle the horizontal line at the hour's opening price
Open Line Color: Customize color
Open Line Width: Set thickness (1-5)
Open Line Style: Choose Solid, Dashed, or Dotted
Show Range Lines: Toggle the expected high/low projection lines
Range Statistic: Choose "Mean" (12-year average) or "Median" (12-year middle value)
Range High Color: Customize upper range line color and transparency
Range Low Color: Customize lower range line color and transparency
Range Line Width: Set thickness (1-5)
Range Line Style: Choose Solid, Dashed, or Dotted
Show Line Labels: Toggle price labels at the end of all horizontal lines
Label Text Size: Choose Tiny, Small, or Normal
How It Works:
FVG Detection Logic:
The indicator scans price action on the selected lower timeframe (default: 1-minute) looking for Fair Value Gaps using a 3-candle pattern:
Bullish FVG: Formed when candle 's high is below candle 's low, creating an upward gap
Bearish FVG: Formed when candle 's low is above candle 's high, creating a downward gap
The detection is refined using volume imbalance logic by checking for body gaps (outside prints) on both sides of the middle candle. This narrows the FVG zone to areas where bodies don't touch, indicating stronger imbalances.
Only the first FVG that forms during each hour is displayed. If a bullish FVG forms first, it takes priority. The FVG box is drawn from the formation time through to the end of the hour.
Statistical Analysis:
All probability statistics are hardcoded from 12 years (2,400+ samples per hour) of NASDAQ futures analysis:
First 15-Minute Direction: At 15 minutes into each hour, the indicator determines if price closed above, below, or equal to the hour's opening price
Continuation Probability: Historical analysis shows the likelihood that the hour closes in the same direction as the first 15 minutes
Example: If 9AM's first 15 minutes are bullish, there's a 60.1% chance the entire 9AM hour closes bullish (lowest continuation hour)
4PM shows the highest continuation at 86.1% for bullish first 15 minutes
FVG Effectiveness: Tracks how often the first FVG's direction correctly predicts the hourly close direction
BISI (Bullish Imbalance/Sell-side Inefficiency) → Bullish close probability
SIBI (Bearish Imbalance/Buy-side Inefficiency) → Bearish close probability
Range Expectations: Mean and median values represent typical price movement percentage for each hour
9AM and 10AM show the largest ranges (~0.6%)
5PM shows minimal range (~0.06%) due to low liquidity
Hourly Reference Lines:
When each new hour begins:
Vertical delimiter marks the hour's start
Hourly open line plots at the first bar's opening price
Range projection lines calculate expected high/low:
Upper Range = Hourly Open + (Range% / 100 × Hourly Open)
Lower Range = Hourly Open - (Range% / 100 × Hourly Open)
Lines extend exactly to the hour's end time
Labels appear at line endpoints showing exact prices
Real-Time Updates:
FVG Status: Updates immediately when the first FVG forms
First 15min Direction: Locked in at the 15-minute mark
Countdown Timer: Uses timenow to update every second
Table Statistics: Refresh on every bar close
Timezone Handling:
All times are in America/New_York (Eastern Time)
Automatically filters weekend periods (Saturday and Sunday before 6PM)
Hour detection accounts for daylight saving time changes
Use Cases:
Intraday Trading Strategy Development:
FVG Entry Signals: Use the first hourly FVG as a directional bias
Bullish FVG + High continuation % = Strong long setup
Bearish FVG + High continuation % = Strong short setup
First 15-Minute Breakout: Combine first 15-min direction with continuation probabilities
Wait for first 15 minutes to complete
If continuation % is above 70%, trade in that direction
Example: 4PM bullish first 15 min = 86.1% chance hour closes bullish
Range Targeting: Use expected high/low lines as profit targets or reversal zones
Price approaching mean high = potential resistance
Price approaching mean low = potential support
Compare mean vs median for different risk tolerance (median is more conservative)
Hour Selection: Focus trading on hours with:
High FVG effectiveness (11AM: 81.5% BISI→Bull)
High continuation rates (4PM: 86.1% bull continuation)
Avoid low-continuation hours like 9AM (60.1%)
Time Management: Use the countdown timer to:
Enter early in the hour when FVG forms
Exit before hour-end if no follow-through
Avoid late-hour entries with <15 minutes remaining
Statistical Edge Identification:
Compare current hour's FVG against historical effectiveness
Identify when first 15-min direction contradicts FVG direction (conflict = caution)
Use hourly bias to confirm or contradict FVG signals
Monitor if price stays within expected range or breaks out (outlier moves)
Risk Management:
Expected range lines provide logical stop-loss placement
FVG Effect % helps size positions (higher % = larger position)
Time Left countdown aids in time-based stop management
Avoid trading hours with neutral bias or low continuation rates
Statistical Foundation:
All embedded statistics are derived from:
12 years of NASDAQ futures (NQ) continuous contract data
5-minute timeframe FVG detection methodology
24 hours per day analysis (excluding weekends)
2,400+ samples per hour for robust statistical validity
America/New_York timezone for session alignment
Data includes:
Hourly range analysis (mean, median, standard deviation)
First 15-minute directional analysis
FVG formation frequency and effectiveness
Continuation probability matrices
Bullish/bearish bias percentages
Best Practices:
✅ Do:
Use exclusively on NASDAQ futures (NQ1! or MNQ1!)
Apply on 5-minute charts for optimal FVG detection matching statistical samples
Wait for first 15 minutes to complete before acting on continuation probabilities
Combine FVG signals with continuation % and FVG Effect % for confluence
Use expected range lines as initial profit targets
Monitor the countdown timer for time-based trade management
Focus on hours with high statistical edges (4PM, 11AM, 10AM)
❌ Don't:
Use on other markets (ES, RTY, YM, stocks, forex, crypto) - statistics will be invalid
Rely solely on FVG without confirming with continuation probabilities
Trade during low-liquidity hours (5PM shows only 0.06% average range)
Ignore the first 15-minute direction when it conflicts with FVG direction
Apply to timeframes significantly different from 5-minute for FVG detection
Use median range expectations aggressively (they're conservative)
Technical Implementation Notes:
Timezone: Fixed to America/New_York with automatic DST adjustment
Weekend Filtering: Automatically hides data Saturday and Sunday before 6PM ET
Performance: Maximum 500 boxes and 500 lines for optimal chart rendering
Update Frequency: Table updates on every bar close; timer updates every second using timenow
FVG Priority: Bullish FVGs take precedence when both form simultaneously
Lower Timeframe Detection: Uses request.security_lower_tf for accurate sub-chart-timeframe FVG detection
Precision: All price labels use format.mintick for appropriate decimal precision
Big thanks to @Trades-Dont-Lie for the FPFVG code in his excellent indicator that I've used here

History Trading SessionsThis indicator helps visually structure the trading day by highlighting custom time zones on the chart.
It is designed for historical analysis, trading discipline, and clear separation between analysis time, active trading, and no-trade periods.
Recommended to use on 4h and below time frames.

Trading Volatility Clock⏰ TRADING VOLATILITY CLOCK - Know When the Action Happens (Anywhere in the World)
A real-time session tracker with multi-timezone support for active traders who need to know when US market volatility strikes - no matter where they are in the world. Perfect for day traders, scalpers, and anyone trading liquid US markets.
══════════════════════════════════════════════════════
📊 WHAT IT DOES
This indicator displays a live clock showing:
- Current time in YOUR selected timezone (10 major timezones supported)
- Active US market session with color-coded volatility levels
- Countdown timer showing time remaining in current session
- Preview of the next upcoming session
- Optional alerts when entering high-volatility periods
══════════════════════════════════════════════════════
🌍 MULTI-TIMEZONE SUPPORT
SESSIONS ALWAYS TRACK US MARKET HOURS (Eastern Time):
No matter which timezone you select, the sessions always trigger at the correct US market times. Perfect for international traders who want to:
• See their local time while tracking US market sessions
• Know exactly when US volatility hits in their timezone
• Plan their trading day around US market hours
SUPPORTED TIMEZONES:
• America/New_York (ET) - Eastern Time
• America/Chicago (CT) - Central Time
• America/Los_Angeles (PT) - Pacific Time
• Europe/London (GMT) - Greenwich Mean Time
• Europe/Berlin (CET) - Central European Time
• Asia/Tokyo (JST) - Japan Standard Time
• Asia/Shanghai (CST) - China Standard Time
• Asia/Hong_Kong (HKT) - Hong Kong Time
• Australia/Sydney (AEDT) - Australian Eastern Time
• UTC - Coordinated Universal Time
EXAMPLE: A trader in Tokyo selects "Asia/Tokyo"
• Clock shows: 11:30 PM JST
• Session shows: "Opening Drive" 🔥 HIGH
• They know: US market just opened (9:30 AM ET in New York)
══════════════════════════════════════════════════════
🎯 WHY IT'S USEFUL
Whether you trade futures, high-volume stocks, or ETFs, volatility isn't constant throughout the day. Knowing WHEN to expect movement is critical:
🔥 HIGH VOLATILITY (Red):
• Opening Drive (9:30-10:30 AM ET) - Highest volume of the day
• Power Hour (3:00-4:00 PM ET) - Second-highest volume, final push
⚡ MEDIUM VOLATILITY (Yellow):
• Pre-Market (8:00-9:30 AM ET) - Building momentum
• Lunch Return (1:00-2:00 PM ET) - Traders returning
• Afternoon Session (2:00-3:00 PM ET) - Trend continuation
• After Hours (4:00-5:00 PM ET) - News reactions
💤 LOW VOLATILITY (Gray):
• Overnight Grind (12:00-8:00 AM ET) - Thin volume
• Mid-Morning Chop (10:30-11:30 AM ET) - Ranges form
• Lunch Hour (11:30 AM-1:00 PM ET) - Dead zone
• Evening Fade (5:00-8:00 PM ET) - Volume dropping
══════════════════════════════════════════════════════
⚙️ CUSTOMIZATION OPTIONS
TIMEZONE SETTINGS:
• Select from 10 major timezones worldwide
• Clock automatically displays in your local time
• Sessions remain locked to US market hours
SESSION TIME CUSTOMIZATION:
• Every session boundary is adjustable (in minutes from midnight ET)
• Perfect for traders who define sessions differently
• Advanced users can create custom volatility schedules
DISPLAY OPTIONS:
• Toggle next session preview on/off
• Enable/disable high volatility alerts
• Clean, unobtrusive table display in top-right corner
══════════════════════════════════════════════════════
💡 HOW TO USE
1. Add indicator to any chart (works on all timeframes)
2. Select your timezone in Settings → Timezone Settings
3. Set your chart to 1-minute timeframe for real-time updates
4. Customize session times if needed (Settings → Session Time Customization)
5. Watch the top-right corner for live session tracking
TRADING APPLICATIONS:
• Avoid trading during dead zones (lunch hour, mid-morning chop)
• Increase position size during high volatility windows
• Set alerts for Opening Drive and Power Hour
• Plan your trading day around US market volatility schedule
• International traders can track US sessions in their local time
══════════════════════════════════════════════════════
🎓 EDUCATIONAL VALUE
This indicator teaches traders:
• Market microstructure and volume patterns
• Why certain times produce better opportunities
• How institutional flows create intraday patterns
• The importance of timing in active trading
• How to adapt US market trading to any timezone
══════════════════════════════════════════════════════
⚠️ IMPORTANT NOTES
- Works best on 1-minute charts for frequent updates
- Sessions are ALWAYS based on US Eastern Time (ET)
- Timezone selection only changes the clock display
- Clock updates when new bar closes (not tick-by-tick)
- Alerts trigger once per bar when enabled
- Perfect for international traders tracking US markets
══════════════════════════════════════════════════════
📈 BEST USED WITH
- High-volume US stocks: TSLA, NVDA, AAPL, AMD, META
- Major US ETFs: SPY, QQQ, IWM, DIA
- US Futures: ES, NQ, RTY, YM, MES, MNQ
- Any liquid US instrument with clear intraday volume patterns
══════════════════════════════════════════════════════
🌏 FOR INTERNATIONAL TRADERS
This tool is specifically designed for traders outside the US who need to:
• Track US market sessions in their local timezone
• Know when to be at their desk for US volatility
• Avoid waking up for low-volatility periods
• Maximize trading efficiency around US market hours
No more timezone confusion. No more missing the opening bell. Just set your timezone and trade with confidence.
══════════════════════════════════════════════════════
This is an open-source educational tool. Feel free to modify and adapt to your trading style!
Happy Trading! 🚀

MACD + Divergence Indicator [Dynamic Filter]Title: MACD + Divergence
Description: This is an enhanced momentum analysis suite based on the classic Moving Average Convergence Divergence (MACD). It addresses the common weakness of the standard MACD—false signals during low-volatility consolidation—by integrating a Dynamic Volatility Filter and a Multi-Timeframe (MTF) Dashboard.
The Problem It Solves: Standard MACD indicators often generate "whipsaw" crossovers when the market is ranging (moving sideways). Traders often struggle to identify these consolidation zones until it is too late. This script solves this by calculating a dynamic "Consolidation Zone" based on Standard Deviation, visually warning traders when momentum is too weak to be reliable.
Key Features:
1. Dynamic Consolidation Filter (The Grey Zone)
The script calculates Upper and Lower bands around the MACD line using Standard Deviation (Volatility).
Grey Fill: When the MACD line is inside the grey bands, the market is in a "Squeeze" or low-volatility consolidation. Crossovers in this zone are often lower probability.
Breakout: When the MACD line exits the bands, it indicates a volatility expansion and a potentially stronger trend.
2. Automated Divergence Detection
Automatically scans for both Regular (Reversal) and Hidden (Continuation) divergences between Price and Momentum.
Bullish: Marked with Green lines/labels.
Bearish: Marked with Red lines/labels.
Customization: You can choose to calculate divergence based on the MACD Line or the Histogram via settings.
3. Multi-Timeframe (MTF) Dashboard
A customizable information table (optional) displays the MACD state across 4 different timeframes (e.g., 15m, 1H, 4H, Daily).
It checks for Trend Alignment (e.g., are all timeframes Bullish?) to help you trade in the direction of the higher timeframes.
4. Enhanced Visuals
4-Color Histogram: Visualizes momentum growing (bright) vs. momentum fading (pale) for both bullish and bearish phases.
Line Highlights: The MACD and Signal lines are clearly distinct, with configurable smoothing options (EMA/SMA).
Settings Guide:
Consolidation Filter: Increase the Dynamic Filter Multiplier (Default: 0.5) to widen the grey zone if you want to filter out more noise.
Oscillator Source: Switch between "MACD Line" or "Histogram" for divergence detection depending on your strategy.
Table: You can toggle the dashboard on/off or change its position to fit your chart layout.
Credits: Base MACD logic derived from standard technical analysis concepts. Dynamic filtering logic adapted from volatility band theories.
