Pivot

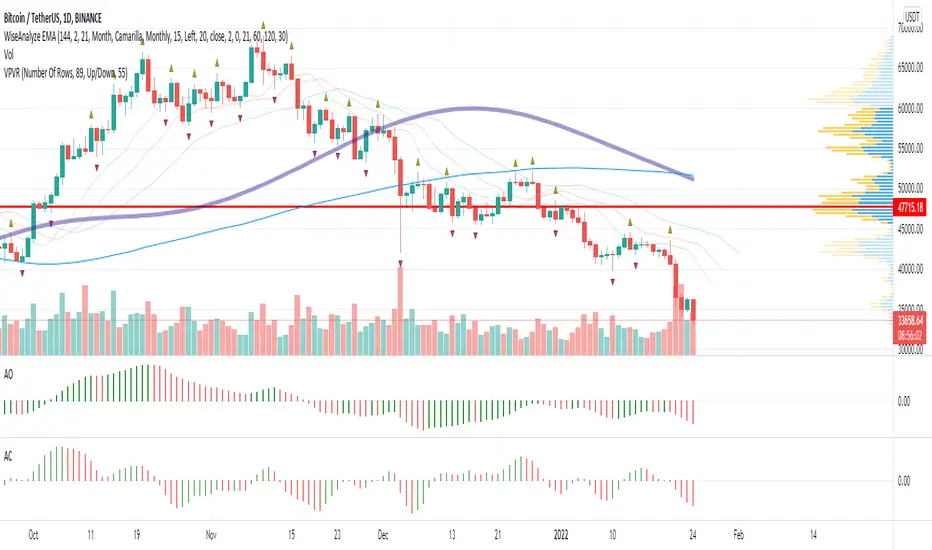
WiseAnalyze EMA + fractalsCombination of exponential moving averages allow to spot the trend reversal and expansion, Bill Williams fractals and support resistance zones allow to trade without drawing anything. Just follow the trend.
Study your chart. Note which EMA act as support and bounce most of tests. Most often I use 21/34 EMA for new entries.
Most powerful trend indicator is MAWV. Don't try to trade against it. If price above go long. If below - short.
Stops should be placed behind fractals. Breakout entries on price crossing fractals.
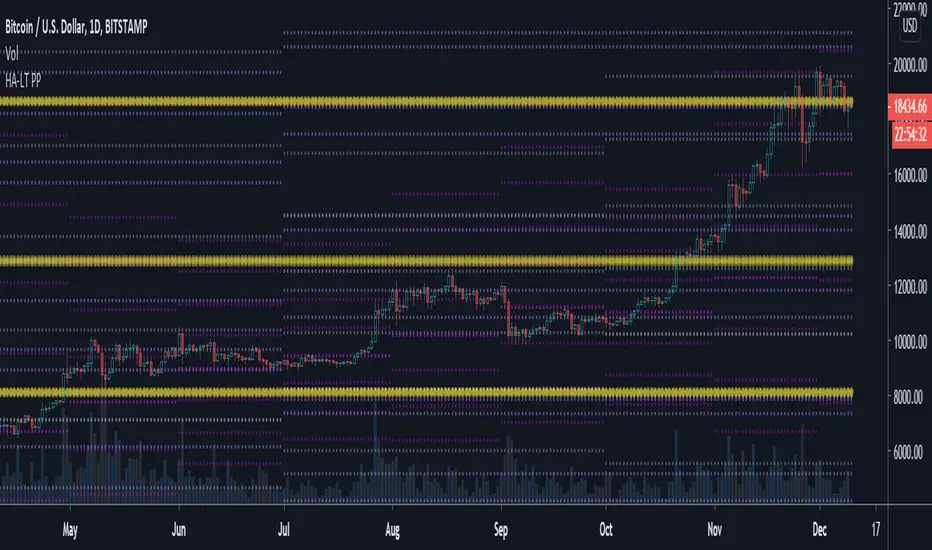
Auto Support Resistance [Free]This is for free version.
full version will come later with "invite only" soon.
(this free version may have some limited things.)
------------------
This show support line, and resistance line.
moderately! and beautiful way!
also proper trend line.
you cannot see source code, but it doesnt have any secret formula.
It use just pivot function.
( i just wanna keep my design tech. )
it has 3 type line.
1. horizontal. yellow. default pivot size is 15
2. connection of top(peak, blue). pivot size 10
3. connection of bottom(green). pivot size 10
you can change pivot size.
it has one speical option about volume.
if the bottom has too small volume, it cannot be starting point.
if you want every bottom can be starting point, you can turn off the option.
each point has name like H6, G8.
this name help you to talk with someone about the point, sharing the infomation.
that name is base on the time of candle (it mean it is not randome). so in your friend chart(screen), the point has same name.
=========================================
한글 설명.
이 지표는 무료 버전입니다.
기능 제한이 없는 정식 버전은 '인바이트 온리'로 나올 예정입니다.
(지금의 버전은 기능제한이 발생할 수 있습니다.)
아름답게 절제된, 그리고 적절한 추세선들을 자동으로 보여줍니다!!!
소스코드를 볼 수 없지만, 추세선을 결정하는 비밀 수식 같은 것은 없습니다.
오직 pivot피봇 함수만을 사용하여 고점과 저점을 찾고 있습니다.
선은 3가지가 있습니다.
1. 고점을 연결한 선. 파란색. 기본 피봇 10
2. 저점을 연결한 선. 녹색. 피봇 10
3. 고점 또는 저점의 수평선. 노란색. 피봇 15
특별한 기능이 하나 있는데, 볼륨이 낮은 저점은 녹색선의 시작점이 되지 못하게 하는 기능입니다.
이 기능은 옵션에서 끄거나, 정도를 조절할 수 있습니다.
각 고점 저점은 H4, G8 같은 이름을 가지고 있습니다.
이 이름은 여러분이 차트분석을 올리거나 친구와 차트에 대해 대화를 나눌 때 유용하게 쓰일 수 있습니다.
이 이름은 캔들의 시간값을 이용하며 (무작위로 지어진게 아니라는 의미), 그래서 친구의(모두의) 화면에서 같은 이름을 보여줍니다.
점선은 확장선이며, 기본은 30, 최대 55까지 늘릴 수 있습니다.
(너무 늘리면 화면이 복잡해집니다.)
가장 최근의 고점과 저점 수평선은 무한대의 길이를 가집니다.
그 외의 수평선은 적당한 길이로 조절되어 출력됩니다.
간혹 3개의 선으로 나뉘어 보이거나 투명도가 변하곤 하는데 이는 특별한 의미를 보이려는 것이 아닙니다. 트레이딩뷰 파인스크립트의 한계로 인한 현상입니다.

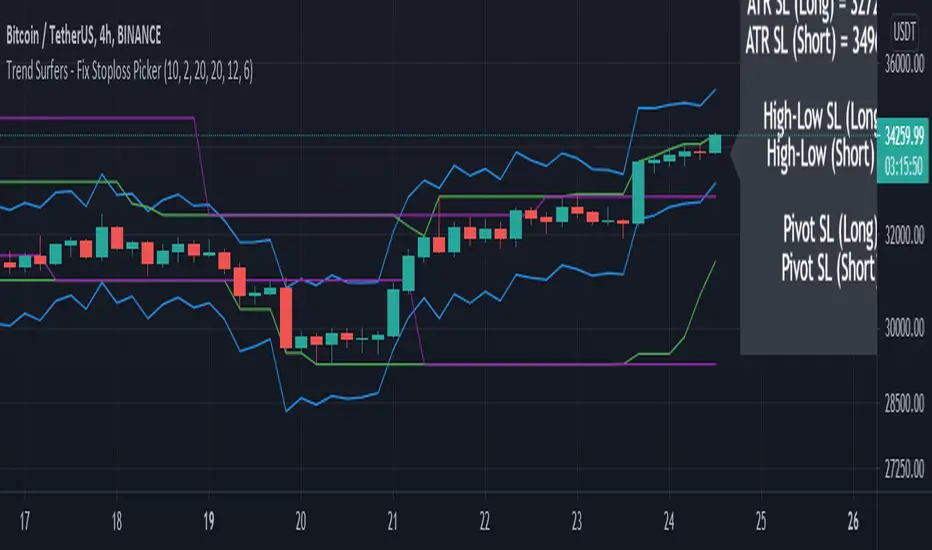
Trend Surfers - Fix Stoploss PickerThis study include 3 types of stop-loss (ATR, High/Low and Pivot point)
This script aimed to help new traders to respect risk management.
Simply select which stop-loss you would like to use in the settings and the suggested stop-loss will be displayed on the chart for Long and Short positions.
Please let me know in the comment if you would like me to add more indicators for the stop-loss in this script.
Hope you like it!
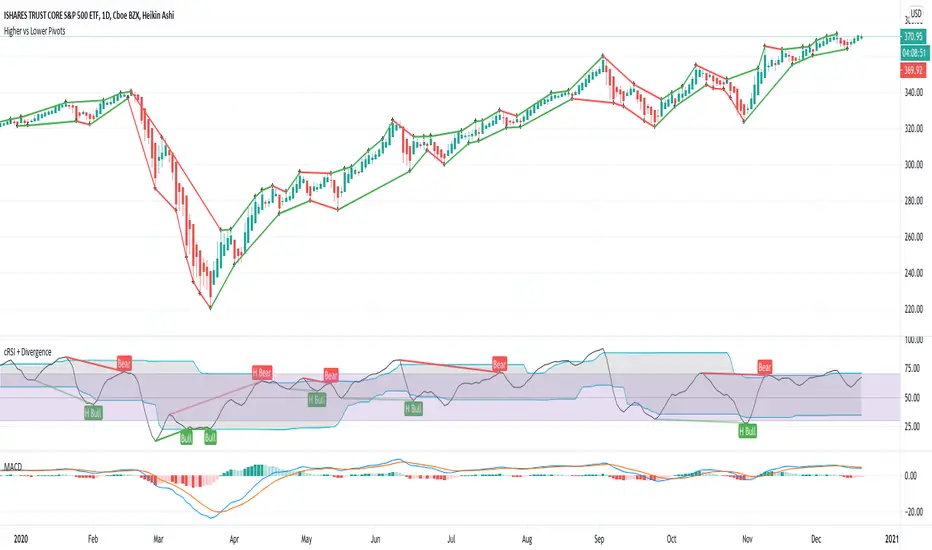
[JRL] Pivot Regression OscillatorIntroducing the Pivot Regression Oscillator. This oscillator uses a similar formula to the Stochastic Oscillator. However, instead of comparing the closing price to the lowest price of a period, it compares the distance between current price and the current pivot point. By basing our oscillator on pivot levels, we incorporate a much more relevant and consequential price point around which to base our comparisons.
The indicator can give reliable overbought and oversold signals, and it plots two exponential moving averages as output, which provides crossover signals that can be used to help time trades.
The Pivot Regression Oscillator can be effective for timing re-entries into a trend and seems to be able to avoid some of the false signals of other indicators.
Let me know if you find this useful. Cheers!

3 Weeks Tight - Price Consolidation [LevelUp]3 Weeks Tight - Introduction
3 weeks tight is a bullish continuation pattern discovered by IBD's founder, William O'Neil.
The pattern can used as an opportunity to add to an existing position as it often occurs after a breakout above a cup with handle or other technical pattern.
The 3 weeks tight pattern forms when a stock closes within approximately 1% to 1.5% of the prior week's close for at least two weeks. The reason for the bullishness is that it indciates that investors who moved the stock upward in price since the breakout are not taking profits, the price is holding steady.
The buy point is just above the area of resistance formed at the highs of the three weeks plus 10 cents. The ten cent addition to the price is to ensure a push through the resistance at the high of the range.
Key Points:
It's preferred that closes for each week are in the upper half of the stock's range.
Ideally, volume will increase significantly as the stocks moves past the buy point.
This pattern generally performs best when the market is in an uptrend.
Features:
A configurable horizontal bar that spans the 3 week period.
A vertical band that highlights the tightness pattern.
A label to show the buy price after 3 week tight pattern.
Optional alert when the 3 weeks tight pattern is recognized.

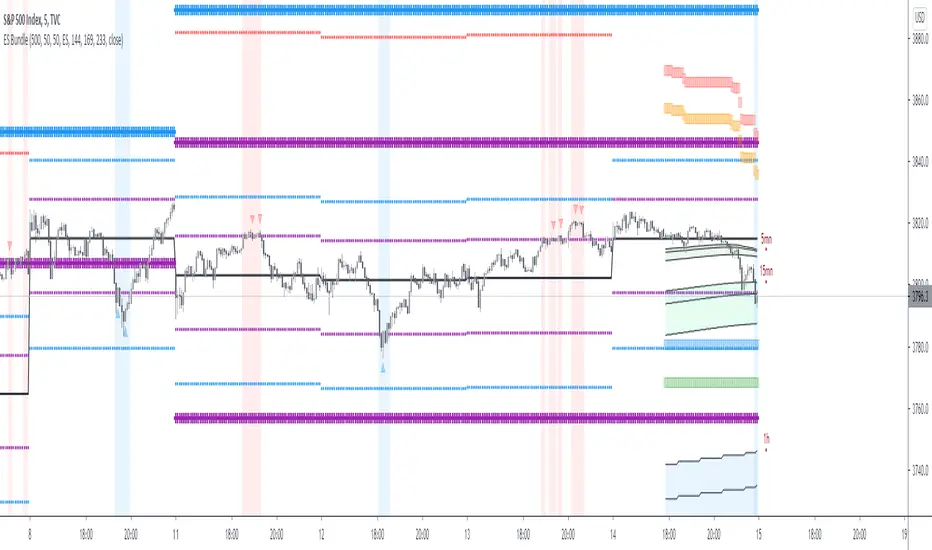
ES BundleThis script is for ES ( E Mini futur or MES) day trading only.
It is a simulation of marker behavior resulting in 2 kind of level:
Oversold and overbougth level:
* It is square shape: orange and red are 1st and 2nd level of Overbougth ( high probability to down of 16 points if you have a bearish divergence of momemtum above these levels)
* It is square shape:blue and green are 1st and 2nd level of Overbougth ( high probability to upof 16 points if you have a bullish divergence of momemtum above these levels)
*In case of crazy market rend (10% of the time, only small reversal is expected but more often than not momemtum will not plot divergence)
Level of support and resistance
*There is 2 size ( cross shaped pattern), the small is for daily timeframe and the large is for weekly timeframe
*Purple line is the fiest and weakest area of resistance or support
*Blue cross is and interesting level, if momemtum plot divergence above blue resistance or below bull support it is time to search for short or long respectivly
*Red line is when crazy market happen, every divergence above or below red line is a major trade reversal
Obviously if you are on support level + under oversold zone it is the best setup to long and vice versa
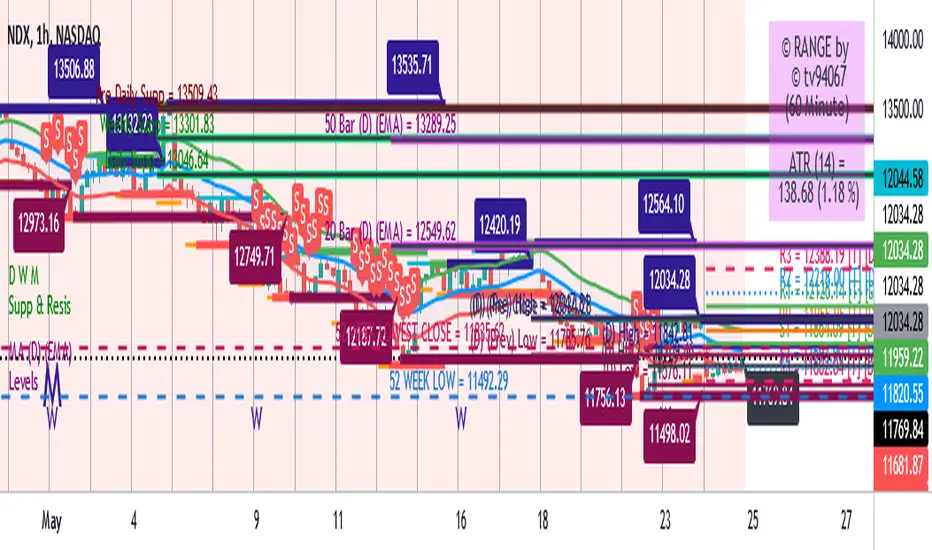
Range support and resistanceWelcome all
==========
This script specially is for Kunal Saraogi Senani Traders and beginners.
.
With this script you can find support and resistance for input range on any time-frame chart.
You need not draw line by own. You just input your desired range and this script will do your work automatically.
You can adjust range according to your choice.
Also have an option to select range source which help you to find support and resistance on the basis of close price or high/low of input range. Default range source is close price.
.
Latest support and resistance value labels also display on the chart.
.
To use this script, add to favorite and apply on chart.
.
Feel free to comment your suggestions.
.
Thanks all
[JRL] ATR Pivot PointsThis indicator plots pivot points with support and resistance lines based on average true range (ATR). ATR is one of the best volatility and trading range predictors, so it can be very useful for finding confluence in any strategy.

(CoInS) Confluence of Indicators and Signals v2 skvConfluence of Indicators and Signals (CoInS) v2 skv
This time best of pivots and oscillators came to confluence to guide traders for better decision making to trade. Remember practice makes profit.
This script created for educational purpose for learners want to observe/study the indicators and its signals. Indicators HMA, SMA, Super Trend, MACD, BB, ADX/DMI/DMS, RSI, Elder Impulse and Pivots CPR, Camarilla, Floor, SQR are used in this script and the display of them controlled through the indicator settings. Values are tuned and can't be changed. Only the current day values will be displayed.
Observe the signals and reversal points at pivots or moving average lines. The bright green up triangles and bright orange down triangles indicates momentum, the faded triangles indicates the momentum is getting weak.
At start of the day, this script indicates whether today is trending or not trending for the scrip.
The SQR pivot points will move as per the trend and indicate the resistance and support level at that time. The color crosses informs that the change occurred throughout the day.
The signals generated by this study are not recommendation and use it on your own discretion after keenly observing each and every details.
Pivots
Pivot Boss CPR with width
Pivot Boss Camarilla
Pivot Boss Floor pivots
Simple and amazing SQR pivots
Displays signals from,
RSI signals
HMA signals
Super Trend
MACD (cross and histogram signals)
Elder Impulse
ADX/DMI/DMS and BB for Momentum
I'm thankful to trading view, various pine coders and authors contributing here and building wealth of knowledge.
*****Remember: Practice makes Profits*****
Disclaimer
1. Only for educational and learning purpose
2. For Intraday and scalping strategies and 5 and 15 min TF only
3. Do paper trade before using any information for actual trading
4. Not swing or positional trade
5. Use it on your own discretion and no one else responsible for the profit/loss except you

Multitimeframe Pivot HiLoPivot High/Low for multi timeframes.
Could be great entry filter to include multi time frame pivots in trend trading strategies.
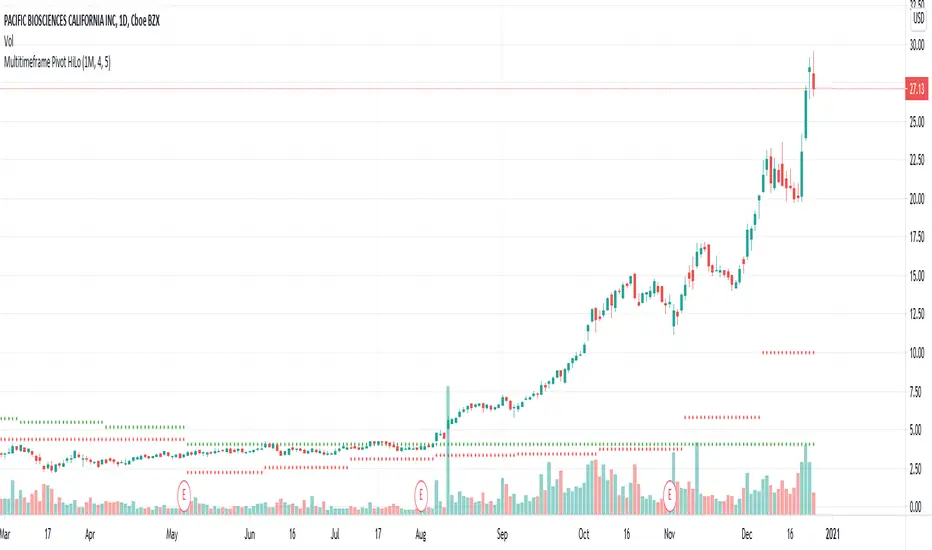
Higher vs Lower Pivots overlayA simple script that I made that draws lines between the high and low pivots. The color of the line define if the pivot is higher or lower than the previous pivot. The main thing to tune is the pivot look back vs look ahead, which are the same params used by the tradingview pivot indicator. There are several other params you can tweaks to get the look you want.
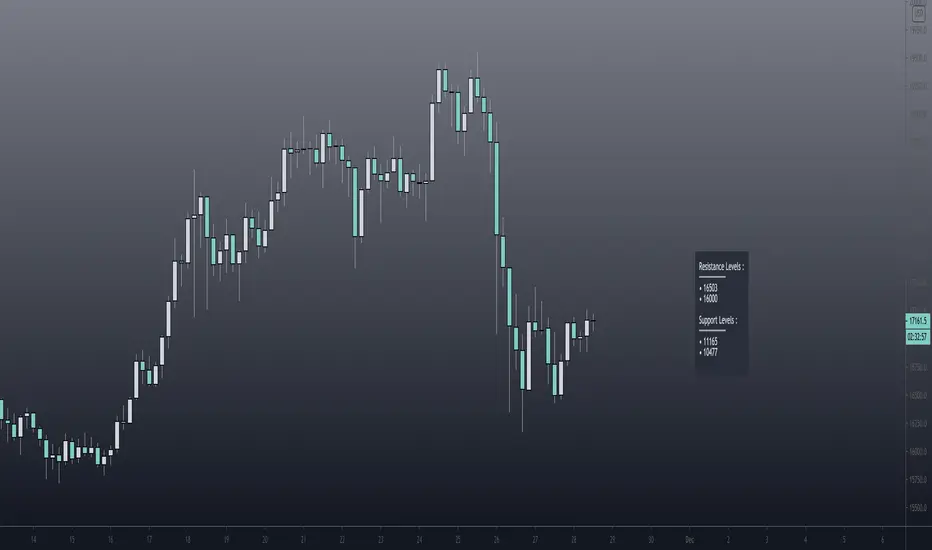
Heikin Ashi Pivot PointsPivot points are price levels that are calculated based on previous high, low, and close values. Pivot point levels include the pivot, 4 resistance levels (R1, R2, R3, R4), and 4 support levels (S1, S2, S3, S4). Pivot points are used as support and resistance levels.
This indicator includes the following pivot points:
6M (6 month)
Yearly
Weekly HA (Heikin Ashi)
Monthly HA (Heikin Ashi)
Quarterly HA (Heikin Ashi)
6M HA (6 month Heikin Ashi)
Yearly HA (Heikin Ashi)
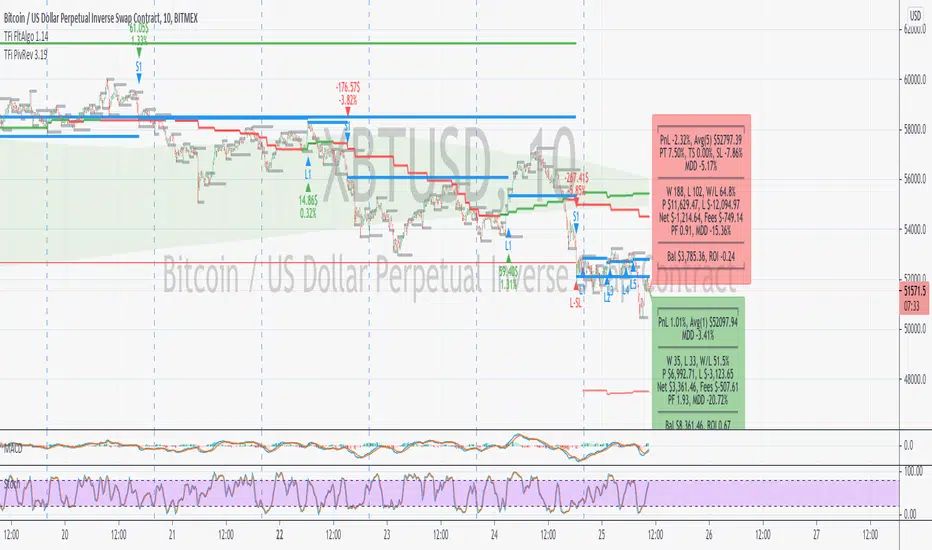
TFi Pivot Reversal V3The Pivot Reversal Study uses pivot points to create a support and resistance level; based on this levels the script creates virtual stop-market orders to catch the trend if the price is crossing the pivot lines.
A "Pyramiding" input allows to configure up to 3 entries; the script enters an additional position if the price falls by a configurable percentage amount (long), the reverse to short orders.
A configurable profit-target and stop-loss is being used to exit an open position.
An optional Moving Average filter can be used to enable only long or short positions.
The script renders a status box at the last bar, which shows the current position status and result of the built-in trading simulation results.
It shows the following statistic values:
current position PnL - also background turns green if position is in profit and red if in loss
the percentage distance to the profit-target and stop-loss level
the overall number of wins and losses and the win/loss ratio
the overall profit and loss amount (assuming a quantity of 1)
the net-profit and profit-ratio
For the correct simulation of entry/exit prices, the script contains inputs for a percentage entry and exit slippage.
The study also creates configurable alerts, which follow the exact position of the entry/exit markers. The default alert messages contain trading instruction to execute orders via Alertatron; but the message content can be replaced if configuring the alert in the Tradingview environment.
The script was mainly backtested with crypto-coins, e.g. XBTUSD at 15min timeframe. But the script also works with any other type of security and timeframe.
How to access
This strategy is a "Invite Only" script. You can can subscribe or purchase the strategy; please use the link below or send me a message via Tradingview to obtain access to the strategy and study script.
For enabling the script in your Tradingview chart window, click on "Indicators" and select "Invite-Only Scripts".
Full list of alerts
'Alertatron Exit' ... Exit all open positions.
'Alertatron Enter Long' ... Enter long position, w/o stop-loss being used.
'Alertatron Enter Short' ... Enter short position, w/o stop-loss being used.
'Alertatron Enter Long SL' ... Enter long position, w/ stop-loss being used.
'Alertatron Enter Short SL' ... Enter short position, w/ stop-loss being used.
Full list of parameters
"Pivot Left Bars" ... Number of bars on the left of the pivot point - used for pivot /peak detection.
"Pivot Right Bars" ... Number of bars on the right of the pivot point - used for pivot /peak detection.
"MA Filter Fast" ... Moving Average filter fast period.
"MA Filter Slow" ... Moving Average filter slow period.
"Profit Target Option" ... Configure the profit-target either as a fix percentage value or an ATR.
"Profit Target " ... Fix percentage profit-target.
"Profit ATR Period" ... ATR profit-target period.
"Profit ATR Factor" ... ATR profit-target factor/multiplier.
"Stop Loss Option" ... Configure the stop-loss either as a fix percentage value or disable the stop-loss completely.
"Stop Loss " ... Fix percentage stop-loss.
"Rebuy Loss " ... Percentage loss of the initial position before script enter a nw position in the same direction.
"Pyramiding" ... Maximum number of positions.
"Show MA Plots" ... Show/hide Moving average plots.
"Slippage Entry " ... Percentage slippage for entering a position.
"Slippage Exit " ... Percentage slippage for exiting a position.
"Statistic Label" ... Defines the position of the statistic label relatively to the last bar in the chart.
"Backtest Start" ... Backtest start time; area outside this timeframe will be grayed out.
"Backtest Stop" ... Backtest stop time; area outside this timeframe will be grayed out.
"Backtest Mode" ... Closes the currently opened position if chart switches to last bar; please only enable if backtesting, otherwise it leads to unwanted alerts.
Excellent ADXThe Average Directional movement indeX (ADX) is an indicator that helps you determine the trend direction, pivot points, and much more else! But it looks not so easy as other famous indicators. It seems strange or even terrible, but don't be afraid. Let's understand how it works and get its power into your analysis tactics.
In the beginning, imagine a drunk man goes through a ladder: step by step. Up, up, down, up, down, down, up...
How can we understand which direction he goes? Exactly! We can count the number of steps in each direction. In the above example, in the upward – 4, in the downward – 3. So, it looks like he goes in an upward direction.
The ADX indicator counts the same steps, but for price. The size of each step equals 1 ATR for "DI Length" candles. On the indicator chart, we have the green and red lines. The green line represents a number of steps upward. The red line shows one downward. When the red line upper green, then the price goes below, then the trend is directed down. Later the green line comes above the red one, and then the trend changes the direction to upward. Wow? After that, you can easy detect the trend direction on the market!
But it is still not the end. On the chart, we also have the fat blue line. This is the ADX line, and it represents the power of the trend. It is calculated from a distance between the green and red curves. The ADX line value grows if the distance is increased. If the movement is really powerful, then a number of steps into a direction much more prominent than one in an opposed direction. Then the blue line grows faster. But if the growth has stopped and the blue line turns back or already had changed self-direction, then it is a signal that the trend has ended too. It's an excellent sign to close the position (but not always). Easy? Not quite. Thresholds help you there. The indicator has two additional parameters: upper and lower thresholds to evaluate the trend-over signal strength. An u-turn of the ADX line above the upper threshold sends a strong signal. If one occurs between both thresholds, it is a bit weak signal. But if the blue line goes below the lower threshold, it looks like there is no trend, and the price goes side. We can also say that the price goes side when the ADX value gradually falls down.
The Excellent ADX indicator helps you catch pivot/pullback signals based on green, red, and blue lines. Each such signal is highlighted as a green (buy) or red (sell) dot on the plot. The size of the dot represents the strength of the signal. You can also check the position of green and red lines from each other to determine the trend direction and the place where it has been changed. The Excellent ADX indicator helps you there too. It highlights the trend direction by the background-color, so you'll never miss it! The Excellent ADX good compliance with the Price Channel indicator built for the same length. You can use them together to be on a trend wave always!

GreenCrypto PR Strategy for Swing TradesThis is a very good strategy for Swing Trading, I have been using this strategy for very long time and made good amount of profit using this. This works great for both long trades and short trades, Stop loss and Take profit target is must while entering the trade, this make sure that the trade ends up in good profit and in case if the market revers, ends in only small loss.
This strategy works using the pivot points, we calculate the pivot point using the number of candles mentioned in the input field "leftBars" and "rightBars", if you add more number of bars then the frequency of the trade decreases. for example with the leftBars as 4 you will get less trades than the leftBar=2. Every trade entry is represented using "Buy" and "Sell" signals, whenever there is a new signal chart shows buy/sell signal for limit price, you need to add a limit order for the same price.
Parameters:
LeftBars = Number of left bars should be used for calculating the pivot pints, (more bars means less frequent trades)
RightBars = Number of right candle bars used for calculating the pivot points (more bars means less frequent trades)
Date/month/day : for selecting the right backtesting the period (currently it set to Jan 2018 to current day )
for this backtesting i have used 1000$ capital and with 10% capital used for each trade, free to modify it as per your needs.
This strategy works best on 4H time frame but you can also try backtesting on other time periods.
The default parameters present in the strategy is works best for most of famous cryptocurrencies on 4H time period.
Please DM me if you would like to tryout 7 Days free trail.

Pivot Support / Resistance Panel [JV]Hello Traders,
First all of thanks to LonesomeTheBlue for making me grasp arrays, a wonderful addition to Pine Script.
This indicator uses arrays to find Pivot Points and mark them as Support / Resistance.
It displays an info panel with the latest values.
This code was written using the following standards:
• PineCoders Coding Conventions for Pine: www.pinecoders.com
Configurable options:
Up to 6 Support / Resistance Levels.
Pivot Lookback Period.
Panel Color.
Text Color.
Panel Offset.
Panel Size.
Enjoy!
Pivot Support and Resistance Finder [JV] V2Dear Traders,
This script is a follow-up to my previous Pivot Support and Resistance Finder.
After so many positive feedback, for which I thank you all, I started rebuilding it to implement some requested features.
The biggest change is that by default, the indicator now shows zones instead of lines.
Support Zone: from low to close
Resistance Zone: from close to high
I removed the 5 lines, instead showing the most recent levels and the forming (fast) levels.
However, if you change the occurrence in the options, you can still see previous levels:
0 = Current Level
1 = Previous Level
2 = Level before the Previous Level
...
More important configurable options:
Pivot Length
Pivot Quick Length (used to draw forming levels
Option to draw using bar closes, wicks or both (area)
Hide / Display to forming level
Show past levels.
I hope this is clear enough.
For any questions, remarks, suggestions, feel free to contact me.
Happy Trading!

Pivots High Low (HH/HL/LH/LL)/Trend [Anan] Hello Friends,,
This is pivot points high low with pivot trend to define the trend direction.
Pivot trend is the pivot points average.
Options:
- Pivot Point Period
- Show/hide Pivot Points Labels
- Show/hide Bull/Bear Labels ( depends on pivot trend)
- Show/hide Pivot Center Line (Bull>Center, Bear

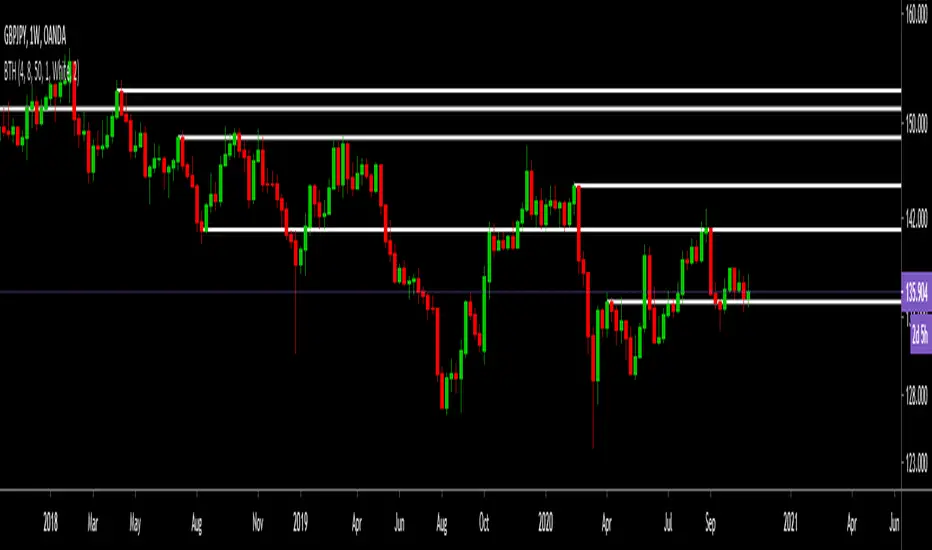
Borjas Tarh Horizontals S/RBorjas Tarh Horizontals
Automatically Plot Horizontals Support and Resistance.
In the Setting, you should optimize the values according to each time frame of the ticker.
Pivot Length : Number of bars to use to calculate pivot
Max Breaks : Maximum number of times a line can be broken before it's invalidated
Max Distance % : Maximum distance PA can move away from line before it's invalidated
Frontrun/Overshoot Threshold % : If PA reverses within this distance of an existing S&R line, consider it a Frontrun / Overshoot
You can copy it and make it better.
Darkpool FinderThis script is designed to located darkpool prints on SPY.
If you do not know what a darkpool is, please research into it.
Essentially, darkpools print at 8 am EST premarket almost everyday. When price hits these pockets, it is usually quite reactive to it since there are a large number of orders in that pocket.
When the script finds a darkpool print, it will plot the line until price hits the pocket, once the pocket is hit, the orders are filled entirely, hence the line will stop plotting. These pockets are only filled in the New York Cash session, if it isn't hit the day its printed, it remains open until it is filled.
For this script to work correctly, the user must have the Arca data exchange paid for since this is the only data that will show the wick prints during the premarket.
Once the correct data is enabled, use the 1-5 minute candles for the plots to render correctly, you may have to use each one for best results.
Even though this script was made for SPY, it works on any ticker because any equity ticker has darkpool prints.
So if you want to use the script on other tickers besides SPY, you must purchase the according exchange data or the script will not work!
If you are in a different time-zone other than EST, you must configure the inputs in the script to match the 8 AM EST time for the script to print properly.
Darkpools are not an end all be all play, sometimes its a coinflip, its just another tool in you toolbox to help determine your move in the market.

Pivot Range - Fisher's Methodology(1D & 3D & W & M)Pivot Range - Fisher's Methodology(1D & 3D & W & M)
Version 2.00
Created by TWA_TradeWithAmir(TWA_PriceActionTips)
Updated 10/29/2020
Based On Mark B. Fisher's ACD Methodology
* 1D Pivot Range, 3D Pivot Range, Weekly Pivot Range & Monthly Pivot Range

Magnetic Zones v1.1 BetaMagnetic Zones v1.1 Beta
This is one of the most powerful and effective indicator which I personally use for Intraday.
It works well for trending stocks and trending days.
What are the Zones?
The zones are basically Retracement and Reversal Zones. The price will take a halt at this zones. So it will be easy to take an entry.
How to use?
Labels:
Pivot = P
Major Zones = R1, R2, R3, S1, S2, S3
Minor Zones = R0.5, R1.5, R2.5, S0.5, S1.5, S2.5
Previous Day High & Low = PDH, PDL
Breakout:
Opens between Previous Day High or Low and R1 or S1 Zone and taking retracement at the zone can result in a breakout.
Entry Time:
No Entry: 0 to 15min. Wait for the early Algo rush to settle down. Just go through the shortlisted stocks or top gainers and top losers.
Risky Entry: 15min to 30min. It is the right or early time to participate in the beginning of a rally. But, recommended only for experienced, disciplined and planned traders.
Moderate Risk: 30min to 45min
Safe Entry: After 45min to 1hr
Stock Selection Tip:
Use Expanded Floor Pivots to spot Narrow Range stocks.
Entry Tip:
Use Opening Range Breakout (15, 30, 45 or 1hr) to spot false shoot ups.
Entry:
After the retracement on or closer to the zones.
If the retracement happens in between spaces of the zones expect next retracement at the next in between space. Imagine the levels accordingly.
Retracement is the right time to make an entry with minimum stoploss.
Stoploss:
Just below the longest candle which touches the zone.
Target:
If it is a trending stock the price will move easily from one major zone to another major zone.
If the zones are wider on a particular day use the minor zones as target.
Consider the historical support and resistance, highs and lows to confirm the entry or exit.
Indicator Features:
Inclusion of 2nd and 3rd zones: Helpful to identify the target zone and to participation in a major rally.
Clean and cluster free look
Shows only required zones
Hide historical levels
Previous day High and Low levels
Multi time-frame
Caution:
Don't solely depend on this indicator. Always use this with other analyzing tools or methods for more confirmation.
Acknowledgement:
Thanking the original formulators.
Note:
The indicator is under testing. Any errors, updates and additions will be updated in the final version.
Even though there many are other indicators similar to this in TradingView, this indicator is customized for precision, inclusion of extended levels and designed for a squeeze free chart and visual appeal.
Explore, improvise and formulate new methods with your personal experience and ideas.