[TTI] Volume +HISTORY AND CREDIT ––––––––––––––––––––––––––––––––––––––––––––––––––––
This indicator combines all that I have found useful throughout the years about volume analysis. Shoutout of people, whose rules I have used to make the indicator goes to: Mark Minervini, William O'Neil, Gil Morales, Dan Zanger, David Ryan
WHAT IT DOES ––––––––––––––––––––––––––––––––––––––––––––––––––––
The indicator plots the Volume series and highlights to bring the trader's attention to important rules. Most of the settings are color settings that show when a condition is being met.
👉 Pocket Pivot = Up Volume today > Highest Down volume in 10 pervious days
👉 Inverse Pocket Pivot = Down Volume today > Highest Up volume in 10 pervious days
👉 Lowest Volume = Very low volume in the past 10 days
👉 Simple Moving average of Volume
👉 Highlight when Volume is above SMA = ability to highlight different colors for up and down volume
👉 Biggest volume in 252 Days (up and down)
👉 Table with summary of important information
HOW TO USE ––––––––––––––––––––––––––––––––––––––––––––––––––––
I usually consult volume a lot while trading. My general advise is to look for above average volume on up days indicating strong institutional accumulation. Conversely when there are a lot of highlighted above average down volume days its good to be cautious of the stock.
Pivot

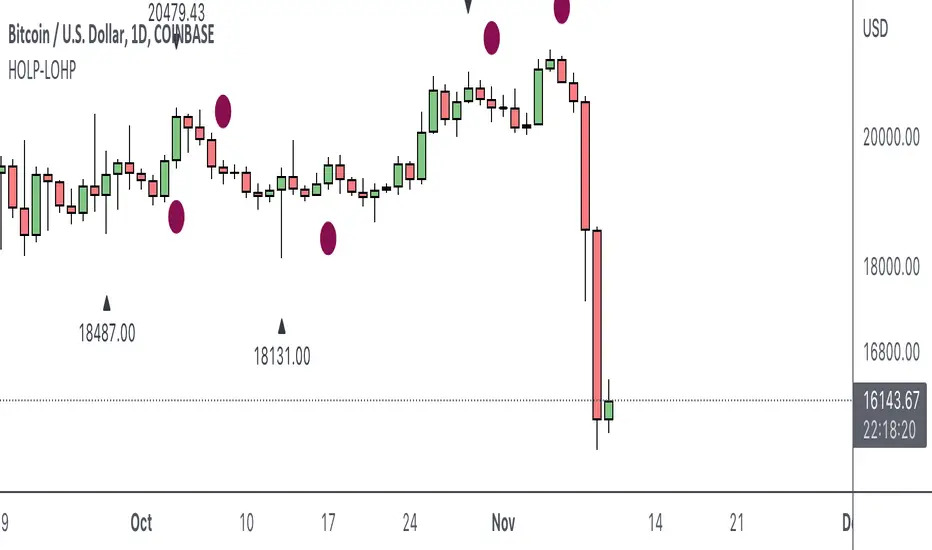
HOLP LOHP PivotCOINBASE:BTCUSD
HOLP and LOHP based on John Carter's Mastering the Trade.
HOLP stands for High Of the Low Period
LOHP stands for Low Of the High Period
This indicator is based on John Carter’s HOLP and LOHP from Mastering the Trade. The basic idea is to identify the session high and mark the low of the session high for a short entry, and vice versa for a long entry.
The default look back period is set to 10 here, albeit John Carter didn’t specify a hard coded number but rather the use of experience and common sense.
Option to turn on labels of the highs and lows of the pivots.
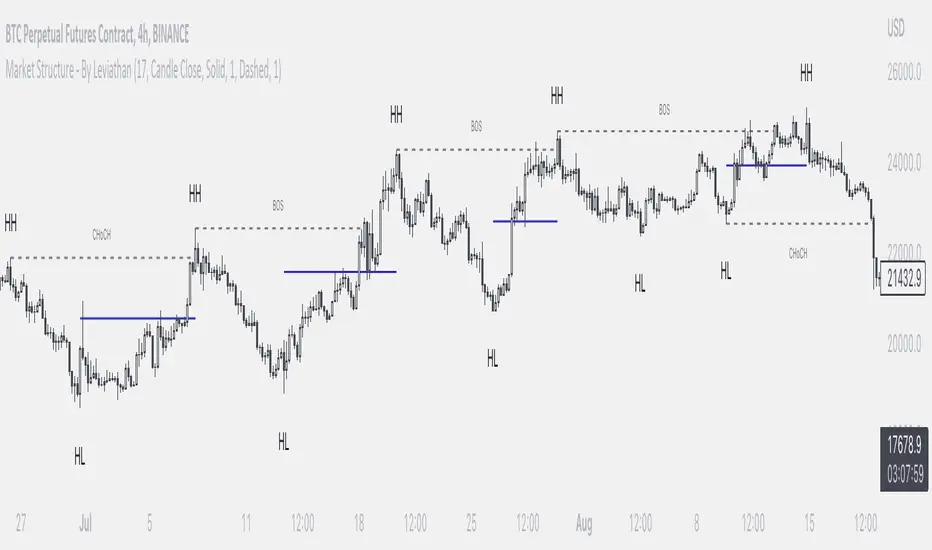
Market Structure - By LeviathanThis indicator helps you identify market structure by plotting swing highs and lows (HH, LH, HL, LL), BOS/CHOCH and 0.5 retracement levels. Other functionalities will be added in future updates.
Indicator Settings Overview
SWING LENGTH
The number of leftbars and rightbars when searching for swing points. The lower the value, the more swing points are shown and the higher the value, the less swing points are shown. I suggest adjusting it to fit your style and when switching between different timeframes.
BOS CONFIRMATION
Choose whether a Break of Structure is determined by a candle close or a wick breaching previous swing point. Using the "Wick" confirmation option will result in more breaks of structure.
CHOCH
Turning this ON renames the first counter trend Break of Structure (BOS) to CHoCH (Change of Character) and therefore signaling a possible trend shift.
SHOW 0.5 RETRACEMENT LEVEL
This will show a level halfway between a swing low and a swing high of an expansion move, which can act as an approximate retracement point if the trend continues.
In uptrends, 0.5 level is drawn between Higher Lows (HL) and Higher Highs ( HHs ). Long entries can be placed around that level if you suspect that the uptrend will continue.
In downtrends, 0.5 level is drawn between Lower Highs (LH) and Lower Lows (LLs). Short entries can be placed around that level if you suspect that the downtrend will continue.
RSI & BB QQE Mod (highlight)This script is a combination of the RSI, QQE and BB
Here is an explanation on how I combined them, and how they are used:
- RSI (Relative Strength Index)
- Display a smoothed version of the RSI to identify "oversold" and "overbought" market phases
- Used to calculate a QQE
- QQE (Quantitative Qualitative Estimation)
- Used to identify trend direction and trend strength
- Used to set a basis for the BB
- BB (Bollinger Bands)
- Used with QQE as a basis to determine a relative definition of "high RSI" and "low RSI"
- Used with QQE as a basis to determine the volatility of the RSI at a given moment
- Used to predict pivot points
Here are the main signals:
- When "RSI Smoothed" line above the Upper BB then "RSI Smoothed" line turns green
- Also , display green background color highlight
- Also , and if "RSI Smoothed" is above the overbought line then display a second green background color highlight
- When "RSI Smoothed" line bellow the Lower BB then "RSI Smoothed" line turns red
- Also , display red background color highlight
- Also , and if "RSI Smoothed" is bellow the oversold line then display a second red background color highlight
A tool codded to be aesthetically pleasing and VERY customisable:
- Designed for both light theme and dark theme users
- Value can be easily modified in the settings
- Colors can be easily swapped in the settings
- Opacity of "fill" & "bgcolor" regrouped as a single input
A tool codded to be easy to read and to learn from:
- Sources and inspirations all listed within the script
- Structure easily identifiable (to understand with little to no effort how the script works)
Notes :
- This script is lagging, because of that I do recommend using it on relatively large timeframe
- This script is OpenSource, feel free to reuse it, but if so please remember to include a link to my script in your sources
- This script is not a magical tool, use at your own risk

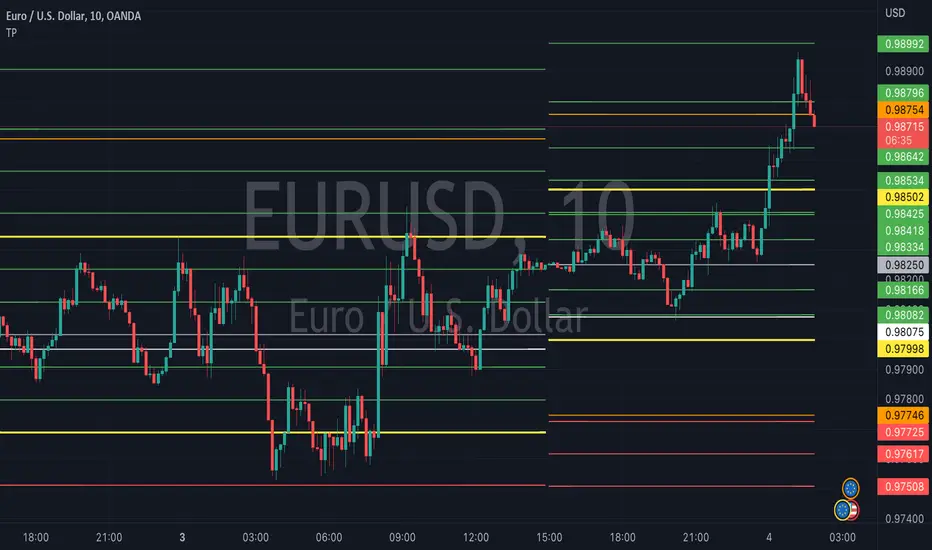
Support & Resistance Trendlines with PP + Fib. Channel█ Support & Resistance Trendlines with Pivot Points + Fibonacci Channel
This script automatically draw support and resistance trend lines based on pivot points and add a fibonacci channel.
It will show potential patterns with the help of support and resistance lines as well as breakout target and pullback entry with the fibonacci extension and retracement levels.
It is based on atolelole's script, I only made it more configurable so please check out his script.
I added the possibility to change values and add additional retracement and extension levels.
I also made it customizable with the possibility to change lines color, width and style.

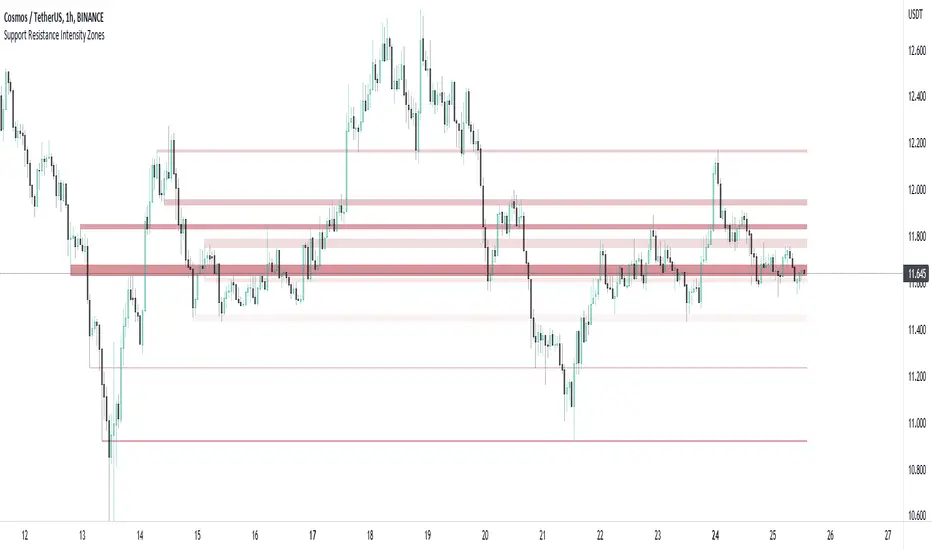
Support and Resistance Intensity ZonesSupport and resistance are often drawn using lines. This is too simple and doesn't give a clear idea of the market sentiment at these particular levels. What is strong support and resistance? What is weak support and resistance. How can either be defined by a single price point?
Using a simple, clean and configurable solution, this indicator not only shows these support and resistance levels as zones, it also gives them a colour gradient based on their intensity.
It does this by letting you choose the pivot highs and lows within a chosen range back. Then you choose one of two options to display how these multiple pivots at the same levels look. You can either group these pivots together into 'zones', where grouped pivots are all separated by a chosen price percentage, choosing how many zones to display, the most grouped pivots being the most intense colour.
Alternatively you display the pivots by 'gradient', where the closer the pivots are together in price the more intense the colour. As pivots diverge apart, the colour weakens.
Both of these options have to be seen to realise how much more there is to support and resistance than a single line.
[TTI] Gilmo's Pocket Pivots and Buyable Gap UpsHISTORY AND CREDITS–––––––––––––––––––––––––––––––––––––––––––––––––––––––
The credit for this goes to Gilmo - Gil Morales. Who I have learned the methodology from. If you are looking to understand more, just read his books where he covers many aspects of his IBD inspired trading. Hes a disciple of Bill Oneil.
WHAT IT DOES––––––––––––––––––––––––––––––––––––––––––––––––––––––––––––––
The indicator has 2 major signals. Showing the PocketPivots and Showing Buyable Gap Ups.
Both are bullish signals for a long play.
⬜️. Pocket Pivots are indicated by white arrow up, and show a combination of setups, but the main criteria is a day where the up volume is higher than any down volume for the last 10 days.
🟩 Green Buyable Gap Up - shows the places where certain technical criteria are met for a Gap and Go scenario. The criteria requires a big enough gap compared to yesterdays close, strong close and enough volume to make the signal trigger. There is high probability that once these 3 requirements are met, the ticker can experience a gap and go type of situation.
🟦 Blue Buyable Gap Up (early) - show the same as green but remove the criteria for volume. This allows us to jump onboard on the same day of the gap, since generally the volume condition can be evaluated only near the end of the day. In essence the Blue signal is preceeding the Green.
HOW TO USE IT–––––––––––––––––––––––––––––––––––––––––––––––––––––––––––––
Both are bullish signal for a long setup.
I have found that the Pocket Pivot is a very reliable signal, even in a downmarket like the 2022. I look for a proper base and then the pocket pivot has been a reliable trigger for change in the supply and dynamic balance.
The Buyable Gap Up, I also look to grab after a base formation. I especially look to play buyable gap ups in the beginning of a trend reversal. This means that Gap up after a long uptrend (3+ bases) is more likely to fail than those early in the trend.
My suggestion is to add this tool to your toolbox of evaluation as a time entry signal.

Pivot mtf semaphore support&resistance [LM]Hello Traders,
I would like to introduce you pivot semaphore mtf support&resistance levels. The idea is the same as my other S/R scripts to have a look at the important levels. The Semaphore is used to spot future multi-level Supports and Resistance zones. It is also useful to spot HL or LL or HH or LH zones. The script is based on amazing work of @LucF so really big thanks for your work on mtf line offsetting.
It has three settings:
First two settings are for higher timeframes
Third setting is setting for pivots on current timeframe
!!!! Very important is there is limitation in pinescript how many candles you can look back(4999) if you choose timeframes that are very distant from each other there is a chance that those lines won't show up
Hopefully you will enjoy
Cheers, Lukas

PivotsSimply plots pivots found on any timeframe based on length specified.
Supports other timeframes, you choose to display gaps or not, with gaps on the labels may disappear so keep that in mind.

RSI Trend Veracity (RSI TV)The RSI only plots itself between a high and a low value. It does not show its bullish/bearish sentiment.
The RSI TV shows the sentiment and helps anticipate the RSI trend but not the price trend.
When the Trend Veracity Line is in green, there is bullish sentiment. When it is in red, there is bearish sentiment.
The closer the lines get to their extremities, the more the current trend of the RSI is exhausted.
It works quite well even in choppy markets. See notes in the picture for more details.

FREE PVT 2 [BELES]This indicator was created by using a pivot strategy for testing purposes, by making arrangements from a different open source software. 100% ineffective, do not perceive it as a buy-sell and investment recommendation, Bu indikatör test amacıyla pivot strateji kullanılarak açık kaynak kodlu farklı bir yazılımdan düzenlemeler yapılarak oluşturlulmuştur. %100 sonuç vermez al sat ve yatırım öneri olarak algılamayın

TrapointsAn indicator that has Camarilla Pivot Points with some preferred color settings and Fibonacci Pivot Points with some custom levels. This indicator was created to facilitate a "plug & play" version of these pivot points for a friend's community, and I like to share all the scripts I create so that they can potentially serve as helpful references for fellow authors in the community.
The main uses of the pivot points for this indicator are for reference as support/resistance levels.
Liquidity Heatmap (Nephew_Sam_)Liquidity Heatmap
This indicator plots a heatmap of resting liquidity above and below swing lows and multiple timeframes
The darker the color is or the larger the zone is, the more liquidity is lying there. If you think there are too many zones, you can increase the timeframes in the settings or just disable it.
Liquidity simply means orders such as stoplosses, buy/sell stops.
Disclaimer: You are free to use this code but your should be open source too

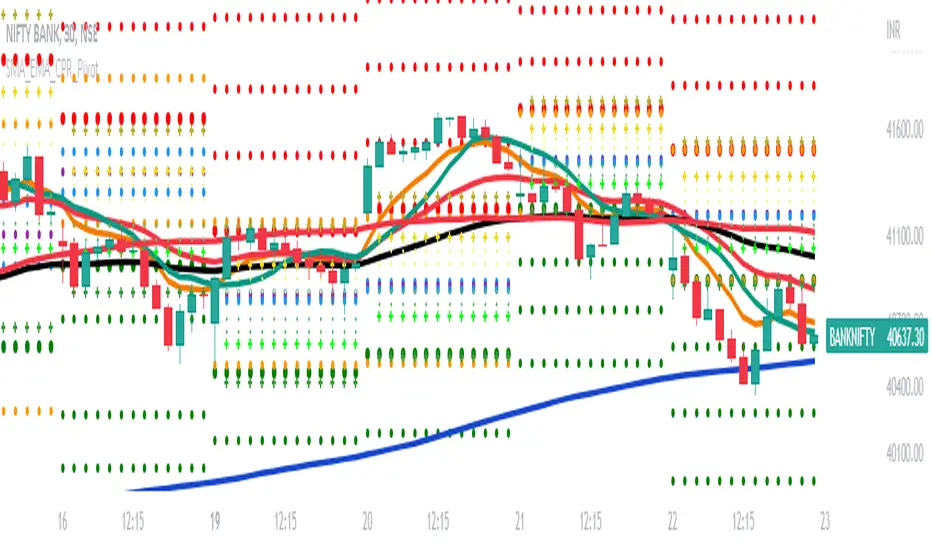
SMA_EMA_CPR_PivotThis Script can do multiple jobs in single indicator.
Like -:
Plot 3 SMA as per your inputs.
Plot 3 EMA as per your inputs.
Plot CPR Levels.
Plot Pivot Levels.
Plot Previous Day High Low.
Indicator can used in Intraday stock trading, Positional Trading and options trading.
Please Enjoy.
Liquidity Pools (Nephew_Sam_)This indicator makes use of Pivot Points to identify liquidity pools. This simply means, highs and lows that the price should eventually take out (go towards) before reacting.
In this current version (v1), I implemented multi timeframe pivot points, each with a custom line style and color.
The x left/right bars are used to identify swing points, the number provided will find the highest/lowest candle in the provided left/right bars.
Upcoming
In the next update(s) we will add more features like - identifying relative highs/lows, closest liquidity pools, extending lines, adding labels etc

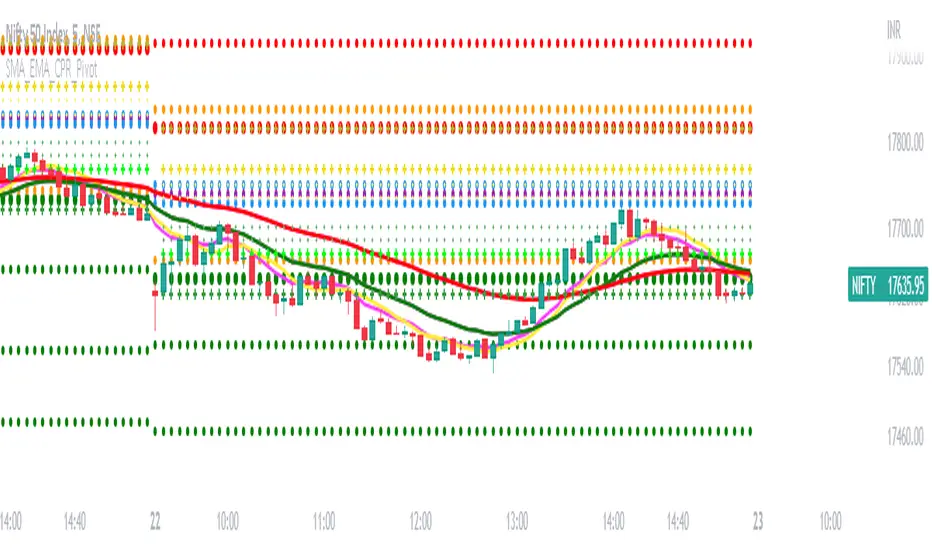
SMA_EMA_CPR_PivotThis Script can do multiple jobs in single indicator.
Like -:
Plot 3 SMA as per your inputs.
Plot 3 EMA as per your inputs.
Plot CPR Levels.
Plot Pivot Levels.
Plot Previous Day High Low.
Indicator can used in Intraday stock trading, Positional Trading and options trading.
Please Enjoy.
MTFT VWAPs Auto AnchoredMulti Time Frame Tools
Multi Time Frame Tools (MTFT) is a suite of scripts aimed to establish a standard timeframe-based color scheme. This can be utilized to overlay different timeframes calculations/values over a single timeframe. As one example, this would allow to observe the 5-month moving average, 5-week moving average, and 5-day moving average overlaid over each other. This would allow to study a chart, get accustomed to the color scheme and study all these at the same time much easier.
All indicators calculated using the below specific timeframes as input, will always use the color scheme outlined below. This is to get you in habit of recognizing the different timeframes overlaid in top of each other. These can be personalized.
Longer TF analysis.
Yearly - Black
Semi-Annual - Yellow
Quarterly - White
Monthly - Maroon
Weekly - Royal Blue
Daily - Lime
Shorter TF analysis.
4 hour - Fuchsia
1 hour - Orange
30 min - Red
15 min - Brown
10 min - Purple
5 min - Lilac
All color coordination is able to be modified in either the “Inputs” or “Style” section. If you need to make changes, make sure to select “Save as Default” on the bottom right of the settings menu.
Recommended Chart Color Layout
I played around with color coordination a lot. The final product was what worked best for me. I personally use the following chart settings to accent all available TF colors.
-> Click on the settings wheel on your chart. -> Click on “Appearance”.
Background - Solid -> On the top row pick the 6th color from the left.
Vert Grid Lines and Horz Grid Lines -> On the top row pick the 7th color from the left.
You may of course change these and the indicator line colors as you like.
Adding indicator to Chart
-> Open the TradingView “Indicators & Strategies” library, the icon has “ƒx”. -> All premium scripts will be located under “Invite-Only Scripts” -> Click indicator to add to your chart.
MTFT VWAPs Auto Anchored
The Anchored Volume-Weighted Average Price, Anchored VWAP, is a commonly discussed FinTwit tool. I personally found it through Brian Shannon on Twitter. I have seen big FinTwit accounts solely focus on this strategy alone and have seen other big FinTwit accounts mix with their other indicators. I will be providing very basic info to utilize this script; it is up to you to dive deep into learning this strategy. I am not an expert with the tool or a financial advisor. As with all aspects of life, I recommend you research, learn, discern and practice extensively in order to become a master.
The script has the following features.
1. Three user selected time frames auto anchored VWAPS. It will auto anchor to the start of the timeframe. Timeframes(TF) include: Yearly(Y), Semi-annually(S), Quarterly(Q), Monthly(M), Weekly(W), Daily(D), and 4 hour. Image below shows the D candlestick as the active timeframe, the anchored VWAPs for the Year, Quarter, and Month.
2. Auto hide lower timeframe calculations. Auto Hide feature will hide smaller TF calculations when a larger timeframe is selected as the display TF. Example, when the Daily timeframe candlestick selected the Weekly and Daily Anchored VWAPs are hidden because they produce very noisy results. If a lower TF is selected such as the 30 min candlestick, the previously hidden Daily and Weekly Open Anchored VWAPs are now displayed. Notice that this specific indicator calculates different with every different timeframe that is selected. The lower TF calculations are more accurate as they include additional information. Image below shows the 30 min timeframe selected with the Daily, Weekly, and Monthly Open Anchored VWAPs displayed.
3. Auto Anchor using Pivot High/Low locations. Script finds the pivot highs/lows with a user selected look back/forward period. Additionally, as new pivot highs/lows appear you can choose to keep up to 4 each previous pivot high/low anchored VWAPs displayed. Image below has a 40 look back/forward period selected, and 2 past AVWAPs enabled.
You may notice in the above image that there is a gap between the AVWAP plot and the marked pivot point. This is not something that can be avoided as the script has to look forward in order to verify the pivot. The calculation is still correct, this can be verified by manually adding an “Anchored VWAP” drawing and seeing the values align. Image below shows that they match. White lines are the manually added “Anchored VWAP” drawings. If you verify this for yourself, make sure to select the correct input source in the settings of the drawing.
4. Auto Anchored on IPO High/Low. Looks for the first available candlestick in a chart and anchors to the high and low. This is useful with newer companies with recent IPOs.
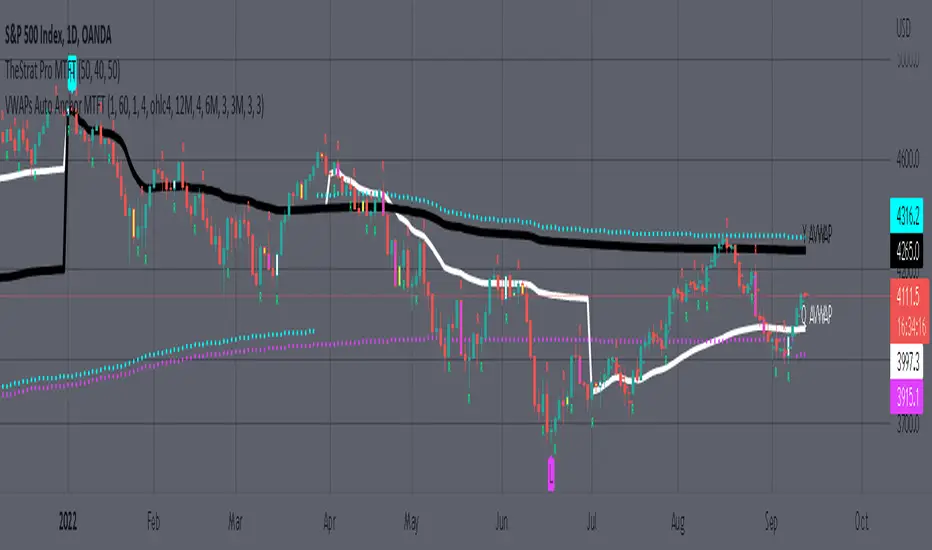
IMPORTANT NOTE to TradingView admin: One of the lessons I would consider most important in attaining clarity regarding trading, is “TheStrat” by Rob Smith. His lesson on “actionable signals” is something that can be applied to any strategy. For this reason, I am including “MTFT TheStrat Patterns Pro” script in all images that will depict confluence for a better trade selection.
Example using TheStrat Pro MTFT with this indicator.
Look for a “TheStrat actionable signal” or a “TheStrat Reversal signal” on a smaller timeframe that has an instance of this indicator on a larger timeframe calculation that is in range of the candlestick that formed your actionable signal. This means that the indicators plot you are observing must be above the low and below the high of the candlestick that is the actionable signal/reversal signal.
The Image below shows what this would look like with this indicator. The selected candlestick is the 2-day, it shows a 1-3-1 pattern and the Quarter Anchored VWAP in range. This actionable signal could be played in both directions. If the high is breached, you would enter a long position from the high of the inside candlestick. If the low is breached than you would enter a short. For targets you would look at the previous pivots, for this example all targets were hit. Note that the “Entry” and “Targets” line were added manually and are not part of the script. Setups won’t always play out so nice and clean, but given that there is so many stocks and so many signals this is just a thought to improve the quality of the signal as it has extra confluence. If you are interested in learning further, research ‘TheStrat’ by Rob Smith.
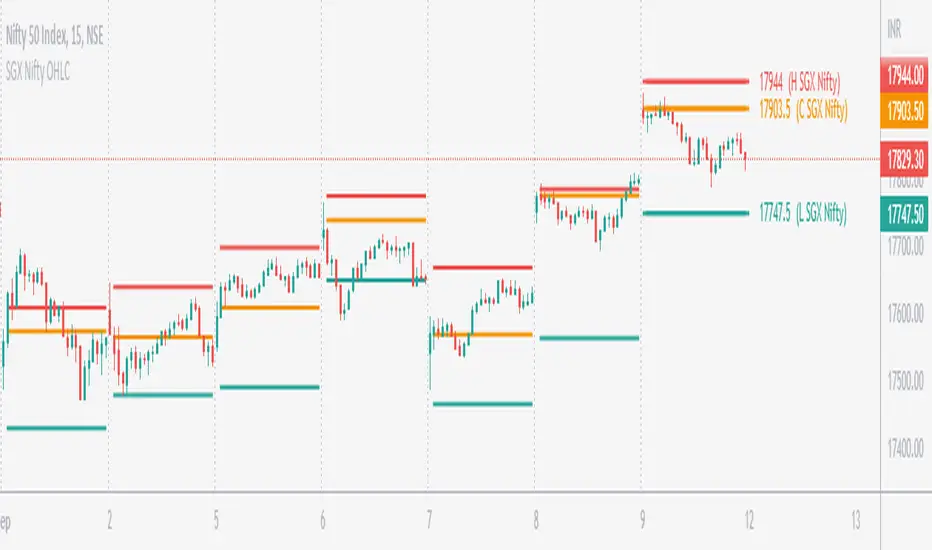
SGX Nifty OHLC for Nifty 50 IndexSGX Nifty OHLC for Nifty 50 Index
What is this Indicator?
• This indicator calculates the OHLC levels of SGX Nifty.
How does SGX Nifty impact NIFTY and the Indian Market?
• Helps in predicting NIFTY50 Index behavior.
• The closing price of today's 9.14 am (IST) SGX Nifty will be the Open of today's Nifty50 Open. This helps to determine the opening Gap of Nifty50.
• SGX Nifty OHLC levels can act as support and resistance in Nifty50.
Who to use?
• Beneficial for Day Traders, who trade in NIFTY Index.
What timeframe to use?
• Use 1 minute for better accuracy.
• Other timeframes will also work.
Important Note
• Use 1 min timeframe for accurate OHLC.
• In other timeframes OHLC will have negligible difference, it won't be huge.
• This indicator will appear only on NIFTY Index and Futures chart.
• To hide the warning label go to the indicator Menu.
SBS AlgoHello traders, I am here again with a new and improved indicator.
This indicator is based on a pivot breakout algorithm which gives buy and sell signals according to the breakout of trendline. This is an advanced version of another script. It also takes price action into consideration along with some basic indicators like MACD and ADX to give good entry signals.
NOTE: This indicator is not designed to take entries completely based on signals it gives. Please use it along with your trading strategy to add more confluence to your trading system and maximize your profits.
I hope you guys will like this one too .Enjoy 👍
In case you find any bug, please do report in comment section .Thank you.

Multi Timeframe Support & ResistanceAbout This Indicator
This indicator plots support (pivot low) and resistance (pivot high) using the chart timeframe and second editable timeframe.
How it can be useful
Having higher timeframe support and resistance plotted on a lower timeframe chart helps keep you grounded in the current range the price is in. This can be useful when wanting to avoid taking longs at resistance and shorts at support.
How to use
Adjusting the look back and look ahead will impact how frequently the support and resistance lines move. When Price breaks above resistance or below support, the lines will not move until a new pivot high and pivot low are detected.
Disclaimer: Not Financial Advice

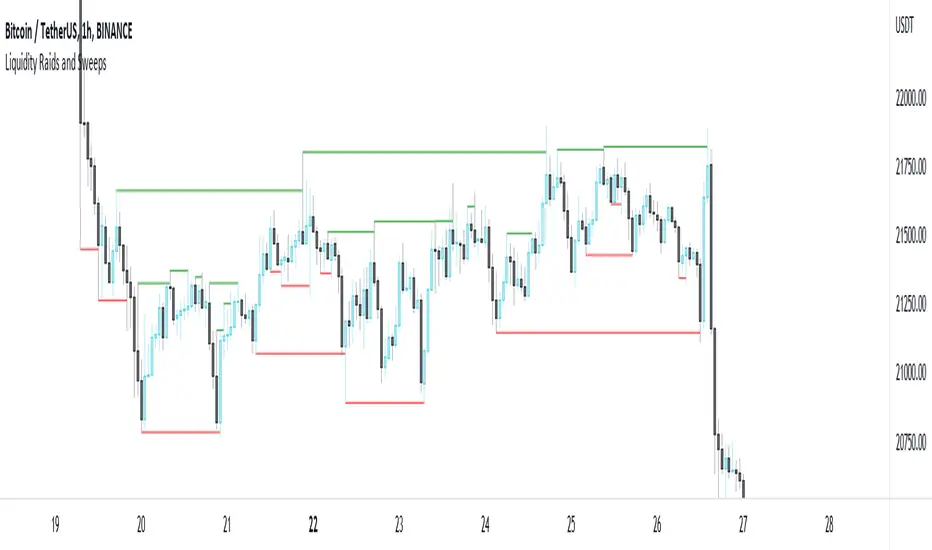
Liquidity Raids and Sweeps by TexmoonbeamLiquidity is a vital concept in trading. It gives us an indication of where buy / sell orders are in the market, and the direction price is likely to move once this liquidity has been taken.
The purpose of this indicator is to show you when and where there has been a 'raid' or 'sweep' of this liquidity, meaning a reversal might occur.
The indicator does this by looking for candle wicks, that go beyond a previous pivot high or low.
Settings:
Timeframe – This settings changes the timeframe that the indicator looks for raids/sweeps. Higher timeframes generally mean stronger moves.
Left bars – the number of bars gap higher/lower to the left of a pivot low/high. A higher number means the high or low was formed from a stronger move.
Right bars – the number of bars gap higher/lower to the right of a pivot low/high. A higher number means the high or low started a stronger move.
Max Gap – the maximum number of candles between a raid or sweep. Reduce this number on higher time frames if there are memory errors.
Min Gap – the minimum number of candles between a raid or sweep.
Alerts Wait For Close – If ticked, this means an alert will not be triggered by the current candle wick, overlapping a previous, until the close of that candle. Unticked you will be alerted as soon as the current candle crosses a previous high/low, though it might close far beyond that point and not actually turn out to be a raid/sweep.
Buy Side/Sell Side – line style and colour preferences for buy and sell side.
Strategy:
As seen in the example chart, the raid/sweep of liquidity, where only a wick reaches beyond a previous high or low, can be followed by a reversal of direction, often to seek other liquidity targets. This indicator could provide an opportunity to enter a trade at this point and the alert feature means you will be able to set up custom alerts on multiple charts or timeframes.
You should use other confluence and a lower time frame confirmation after a raid/sweep, to identify your entry, stop loss and targets. Familiarity with liquidity and smart money concepts are recommended.
Round NumbersThis is a variation of "Round numbers above and below" indicator by BitcoinJesus-Not-Roger-Ver. I've made it two sets of lines and round number range changeable. Defaults at 100 and 500 round numbers.

Pivot Average [Misu]█ This Indicator is based on Pivot Points.
It aggregates closed Pivot Points to determine a " Pivot Average " line.
Pivot Points here refer to highs and lows.
█ Usages:
Pivot Average can be used as resistance or breakout area.
It is also very usefull to find battle zones.
It can also be used as a trend indicator: when the price is below, trend is down, when price is above, trend is up.
Mixed with momentum/volatility indicator it is very powerfull.
█ Parameters:
Deviation: Parameter used to calculate pivots.
Depth: Parameter used to calculate pivots.
Length: History Lenght used to determine Pivot Average.
Smoothing MA Lenght: MA lenght used to smooth Pivot Average.
Close Range %: Define price percentage change required to determine close pivots.
Color: Color of the Pivot Average.
