RK's 04 - Lots of MA Types RibbonHello again,
I made this script to test what is the better Moving Average type to predict the market direction, so I put a function with All the MA I know.
To go beyond, this script have an option to increase the MA length as a Fibonacci Number or any other simple number to step.
If the drawing is too slow, just reduce the amount of MA lines in the input option ("Number of MA to Plot:") to 10 or less and it will be faster.
Hope you like, and if you know other Moving Average type, just tell me how can I get the formula and (if its good, not copyrighted and I have time) I can add here and update for all of us.
Obs: To avoid errors, the Maximum Nth Fibonacci Term to use in MA Length is 19 (4181)
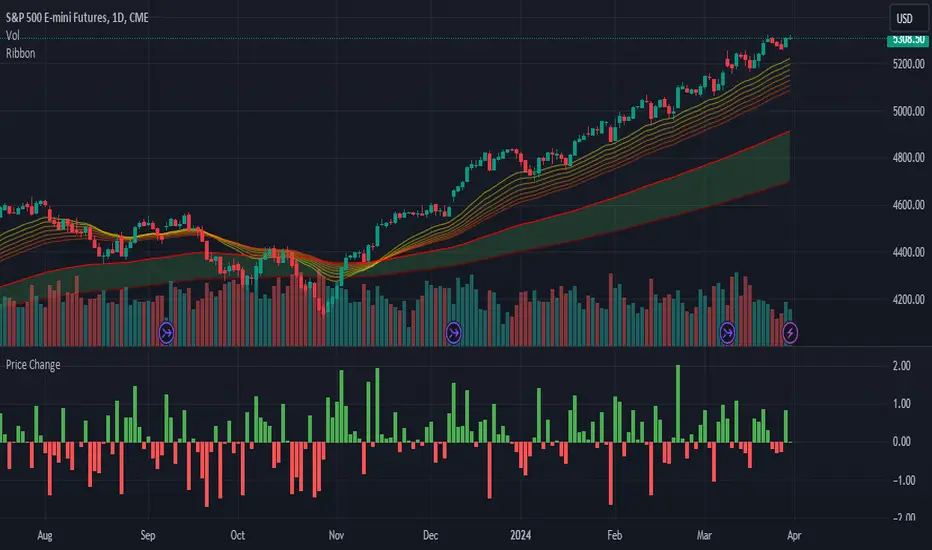
Ribbon
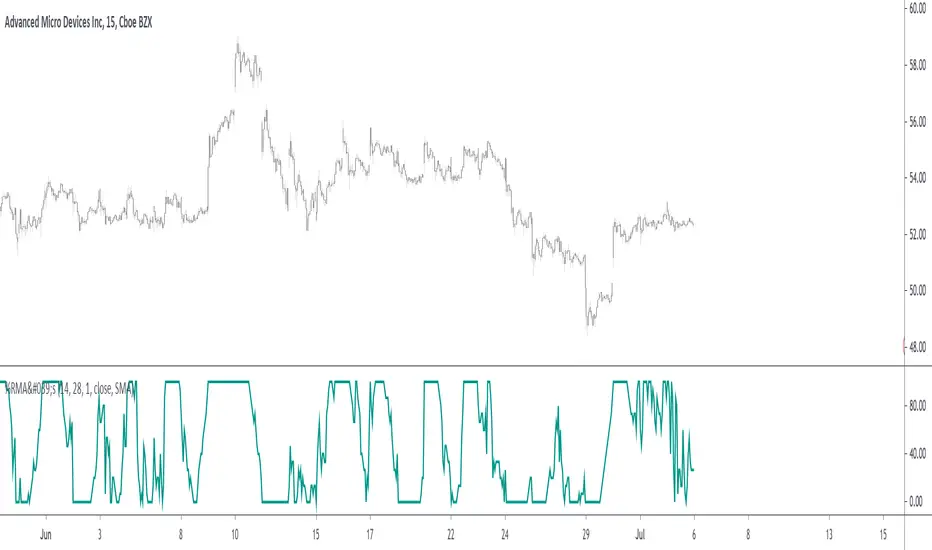
Percentage Of Rising MA'sReturn the percentage of rising moving averages with periods in a custom range from min to max , with the possibility of using different types of moving averages.
Settings
Minimum MA Length Value : minimum period of the moving average.
Maximum MA Length Value : maximum period of the moving average.
Smooth : determine the period of an EMA using the indicator as input, 1 (no smoothing) by default.
Src : source input for the moving averages.
Type : type of the moving averages to be analyzed, available options are "SMA", "WMA" and "TMA", by default "SMA".
Usages
The indicator can return information about the main direction of a trend as well as its overall strength. A value of the indicator above 50 implies that more than 50% of the moving averages from period min to max are rising, this would suggest an uptrend, while a value inferior to 50 would suggest a down-trend.
On the chart, a ribbon consisting of simple moving averages from period 14 to 19, with a color indicating their direction, below the indicator with min = 14 and max = 19
The strength of a trend can be determined by how close the indicator is to 0 or 100, a value of 100 would imply that 100% percent of the moving averages are rising, this indicates a strong up-trend, while a value of 0 would suggest a strong down-trend.
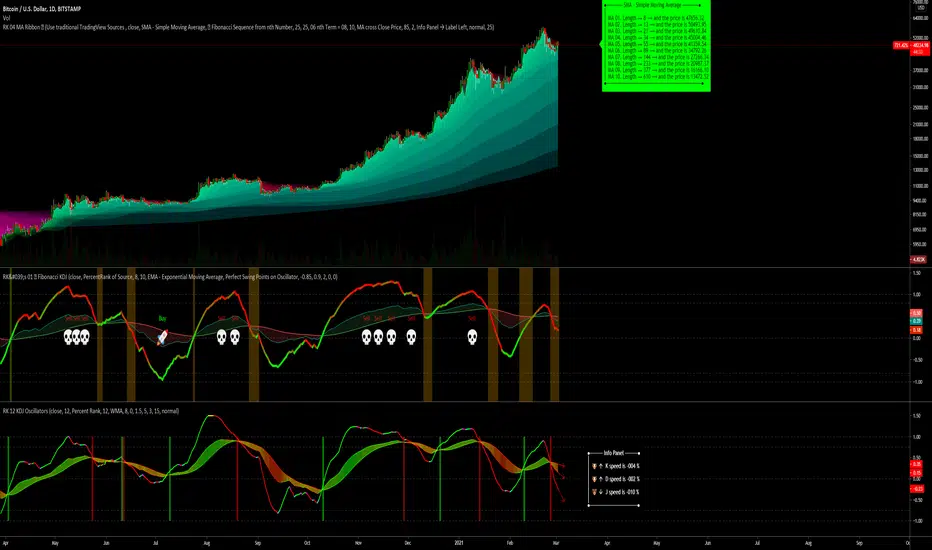
Using different types of moving averages can allow to have more reactive or on the contrary, less noisy results.
Here the type of moving average used by both the ribbon and the indicator is the WMA, the WMA is more reactive than the SMA at the cost of providing less amount of filtering. On the other hand, using a triangular moving average (TMA) provide more filtering at the cost of being less reactive.
Finally, irregularities in the indicator output can be removed by using the smooth setting.
Above smooth = 50.
Details
The indicator is based upon a for loop, this implies that both the sma, wma or change functions are not directly usable, fortunately for us, it is possible to get the first difference of both the SMA, WMA and TMA without relying on a loop by using simple calculations.
The first difference of an SMA of period p is simply a momentum oscillator of period p divided by p , there are two ways to explain why this is the case, first, simple math can prove this, the first difference of an SMA is given by:
(x + x + ... + x )/p - (x + x + ... + x )/p
The repeating terms cancel each other out, as such, we end up with
(x - x )/p
which is simply a momentum oscillator divided by p , since this division doesn't change the sign of the output we can leave it out. We can also use impulses responses to prove this, the impulse response of a simple moving average is rectangular, taking the first difference of this impulse response will give the impulse response of a momentum oscillator, with the only difference being that the non-zero values of the result will be equal to 1/p instead of 1.
The same thing applies to the WMA
above the impulse response of the first difference of a WMA, we can see it is extremely similar to the one of a high pass SMA, only 1 bar longer, as such we can have the first difference of a WMA quite easily. The TMA is simply a 2 pass SMA (the SMA of an SMA), as such the solution is also simple.
Trading With Colors7 hours ago
Hello friends. This is simply a moving average ribbon, per se. The values for the colored ribbon can have their length calculated to fit their chosen resolution on the current one. This solved problems for me, but it was my own solution. Maybe I'll learn something new from sharing this.
To everybody else who is learning as well, this script essentially serves to introduce other time-frame moving averages. This intends to helps traders find the scope of relevance and not get lost in the current time-frame.
Besides the colored moving averages (2 sets, different resolutions, great zoomed in our out), I included optional check-boxes to allow comparison of sets of moving averages at will, so that the most important to the individual trader can be compared and selected specifically.
I kept the default options set to keep it clean. It likely won't be the only indicator on one's chart, so it's naturally best to reduce indicator noise from one, as to not subtract from the benefit of the other indicators.
I integrated tons of acquired knowledge into this, so I hope somebody finds a missing piece to their collection or a solution to a coding problem within. I also hope this provides a new insight and helps others on their path to financial freedom.
Best wishes.
PS: I left some old code in comments in case it helps to understand the evolution of my code. I'll update this again once it works on the Daily. You might figure it out before I do, in wish case, do share :)

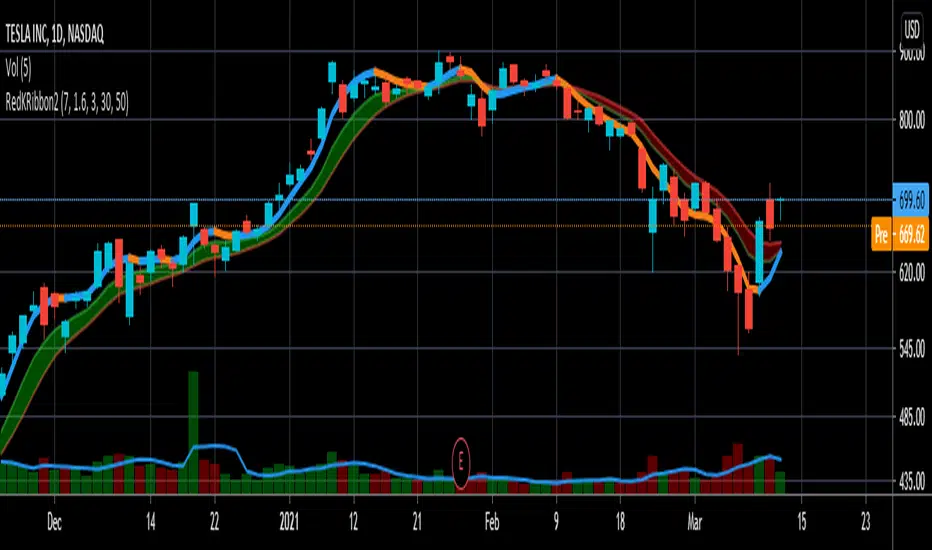
RedK Ribbon v2: Tracking Trend Made EasyThis is an update for the previously published RedK_Ribbon v1 -- and it adds some (hopefully) useful improvements:
1 - the Zero-Lag line is color-coded, to provide an early visual alert that momentum is fading, and the trend direction may change soon
2 - better colors for the ribbon :) - for the visually-oriented folks like me :)
3 - i added two optional EMAs that can be utilized as filters for the longer sentiment - to help a trader take positions only in the direction of the prevailing trends. note that these 2 EMA lines will be hidden by default until selected in the settings - to avoid clutter . Set to 30 and 50 by default but these lengths can be changed as needed
4 - code is open and commented
If you need to learn how we create the zero-lag moving average, pls refer to the "TA Basics" series - and if you need to learn more about how the Ribbon works, pls read the Ribbon v1 post
hope this is useful in your trading - and good luck!
Vwap Ribbon - JDThis indicator displays a custom timeframe VWAP line
together with several multiples of this timeframe
After a large price move, the price often tends to return to one of these multiples
JD.
#nottradingadvice
#DYOR

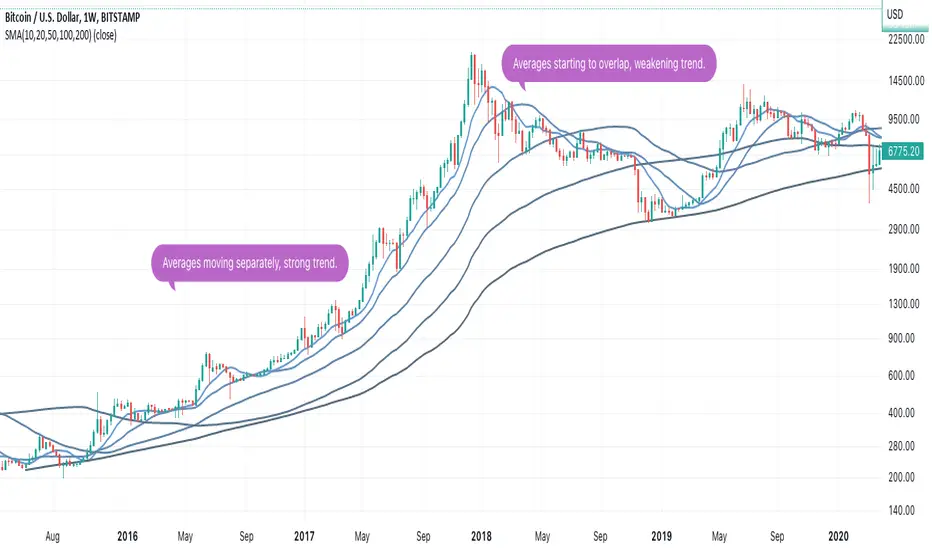
Moving Average RibbonMoving Average Ribbon:
-----------------------------------------------------------
A series of moving averages of different lengths to create a ribbon-like indicator. Traders can determine trend strength by the distance between the moving averages, the overall balance of the coloured lines and determine price points. Price movements through the ribbon can be used to identify trend changes.
SMA, EMA, WMA with user defined length, starting plot, number of plots to show, theme choice and colour calculation toggle.
Inputs:
-----------------------------------------------------------
Source: input value for MAs (close)
Type: moving average type (ema)
Theme: multiple colours/themes (theme 2)
Length: MA length (13)
Start: MA plot number to start ribbon on (1)
No. of MAs: number of plots to show; maximum 32 (32)
Colour option: unchecked then line colour is based on the source value crossing current MA otherwise the moving average below (false)
Example:
-----------------------------------------------------------
multiple MAs overlaid with different values give interesting results e.g.
Ribbon1 :
length: 13
start: 1
Ribbon2:
length:1
start: 26
Notes:
-----------------------------------------------------------
if increasing the length beyond around 150 results in "references too many candles in history" error then reduce the no. of MAs value to show less MA plots; the longer length MAs will go beyond the 5k max candle history..

Wave Ribbon [ChuckBanger]This is a very easy script to build. Indicators like this can be very nice to use to spot trends. I just wanted to share it if someone to trade with it or wants to build on it further. The oscillator is my TRIX script:
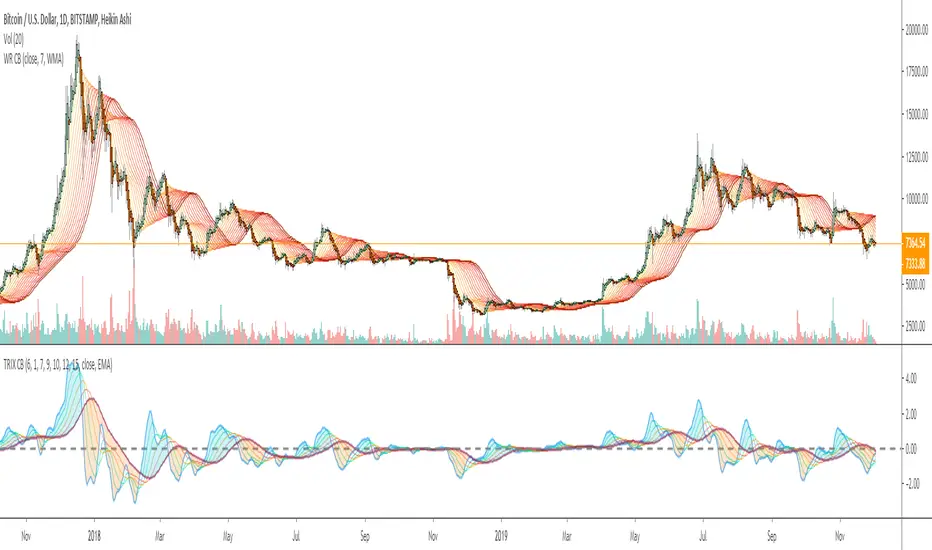
TRIX Ribbon [ChuckBanger]This is a TRIX indicator. You can read more about it here: www.investopedia.com
The trix indicator is usually only trix and a signal line. This indicator has 5 signal lines. The TRIX line has the color blue. The first has the color aqua and then lime, orange, red and the last is the maroon line. The first signal line is an EMA of the TRIX line, the second signal line a double smoothed EMA of the trix line and the third is triple smoothed TRIX line and so on.
Interpretation
TRIX is similar to MACD. As both is a momentum indicators that fluctuate above and below the zero line. Both have signal lines based on some sort of moving average (usually EMA). In this indicator the trader can set what moving average the trader prefer. The biggest difference between TRIX and MACD is that TRIX is the smoother of the two and are less jagged and tend to turn a bit later.
The most common signal is signal line crossover in the same manner as the MACD and its signal line. But this indicator has 5 signal lines. If this was a typical TRIX indicator it should only has the blue and aqua line (the line closest to the blue line). How you trade it is up to you. But for example you go long when the blue line crosses the aqua line. And because the all the is based on the TRIX line you can use the other crossovers as an confirmation signal.

Scripting Tutorial 8 - Triple Many Moving Averages RibbonsThis script is for a triple moving average indicator where the user can select from different types of moving averages, price sources, lookback periods and resolutions.
Features:
- 3 Moving Averages with variable MA types, periods, price sources, resolutions and the ability to disable each individually
- Crossovers are plotted on the chart with detailed information regarding the crossover (Ex: 50 SMA crossed over 200 SMA )
- Forecasting available for all three MAs. MA values are forecasted 5 values out and plotted as if a continuation to the MA.
- Forecast bias also applies to all forecasting. Bias means we can forecast based on an anticipated bullish, bearish or neutral direction in the market.
- To understand bias, please read the source code, or if you can't read the code just send me a message on here or Twitter. Twitter should be linked to my profile.
- Ribbons added and on by default. Optional setting to disable the ribbons. 5 ribbons between MA1 and MA2 and another 5 between MA2 and MA3.
- Ribbons are alpha-color coded based on their relation to their default MAs.
- Ribbons are only visible between MAs if the MAs being compared share the same Type, Resolution, and Source because there is no way to consolidate those three in a simple manner.
- Ribbon values are calculated based on calculated MA Periods between the MAs.
This script is meant as an educational script with well-formatted styling, and references for specific functions.

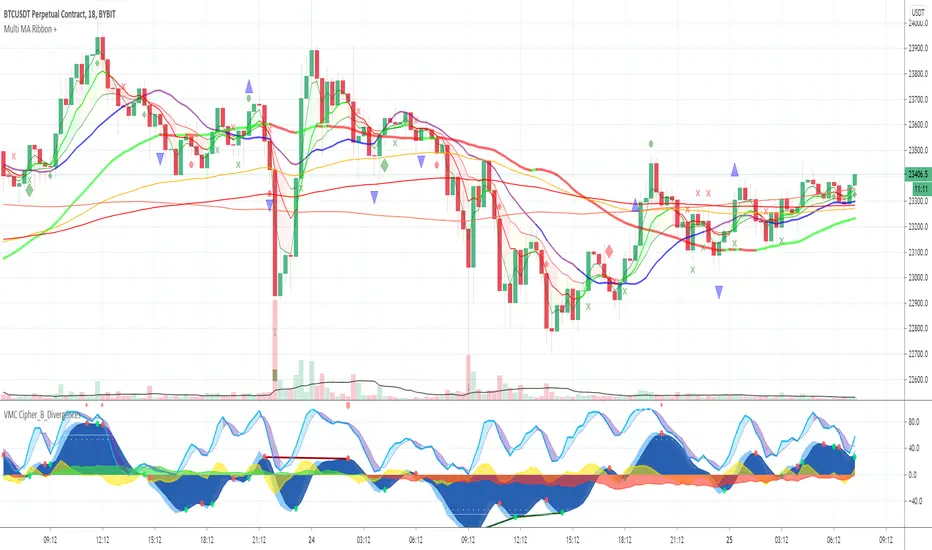
Multi MA Ribbon +Draws an MA Ribbon that highlights major MA's and for easier visibility separates them into different groups including Custom MA's, Baseline MA's, T Line MA's, Short Term MA's and Long Term MA's.
Choose between 11 different types of MA's thanks to JustUncleL and John F. Ehlers super smoother.
The + is for various signals and alerts derived from Market Cipher / Wave Trend indicators and TCG etc.
Happy Trading and remember just follow the flow of the river!
AntiRekt RibbonThis script is a fork of the Madrid Ribbon, the only difference is that you can color your bars depending on the trend.


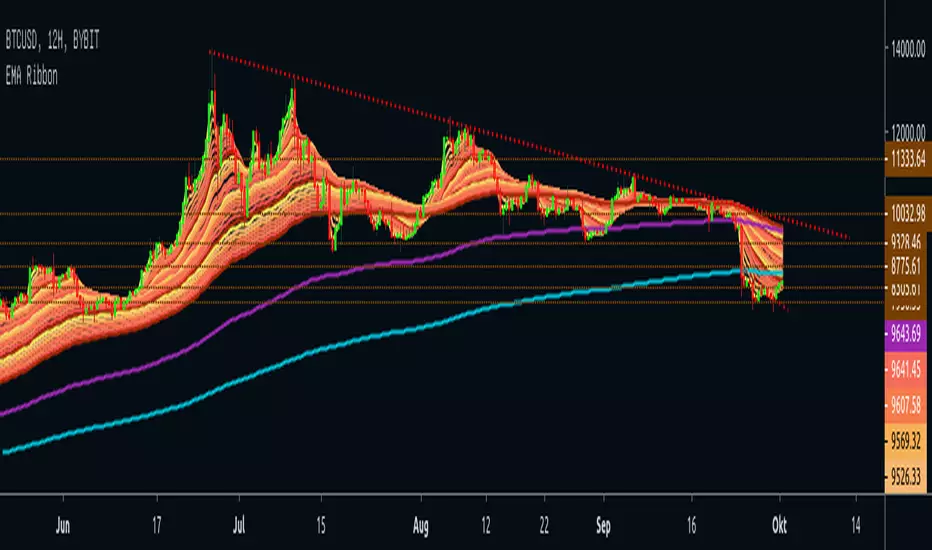
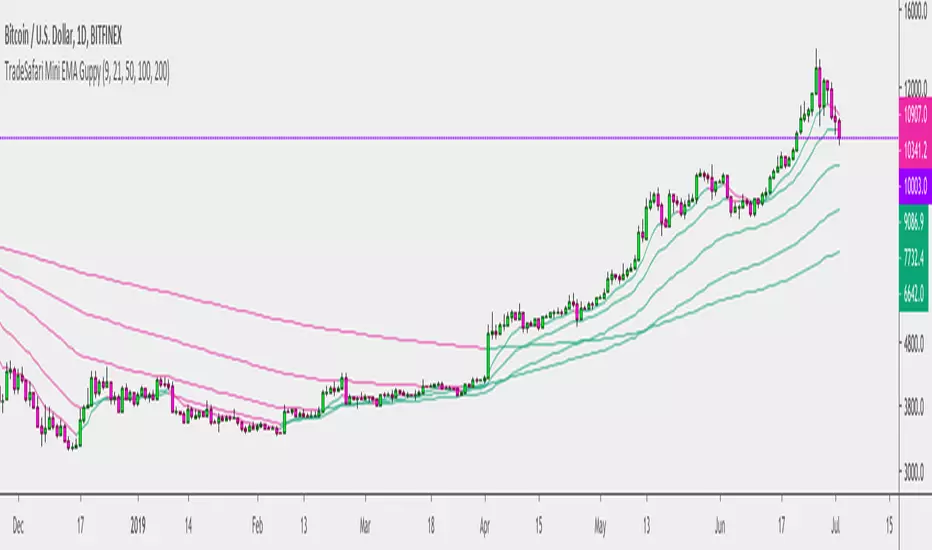
5 EMA Mini GuppyThis is a 5 EMA Ribbon, created to be a simplified version of the Super Guppy, which was used as a starting point.
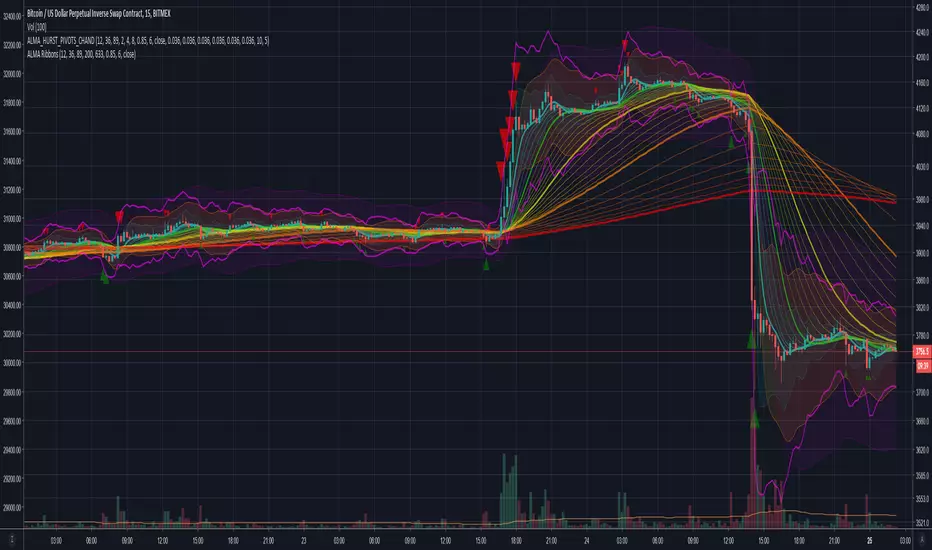
Volume Weighted ALMA RibbonsVolume weighted version of ALMA Ribbons script found here
-------------------------------------------------------
If you find it useful please consider a tip/donation to the rumpy liquidation recovery fund : BTC - 3BMEXEDyWJ58eXUEALYPadbn1wwWKmf6sA


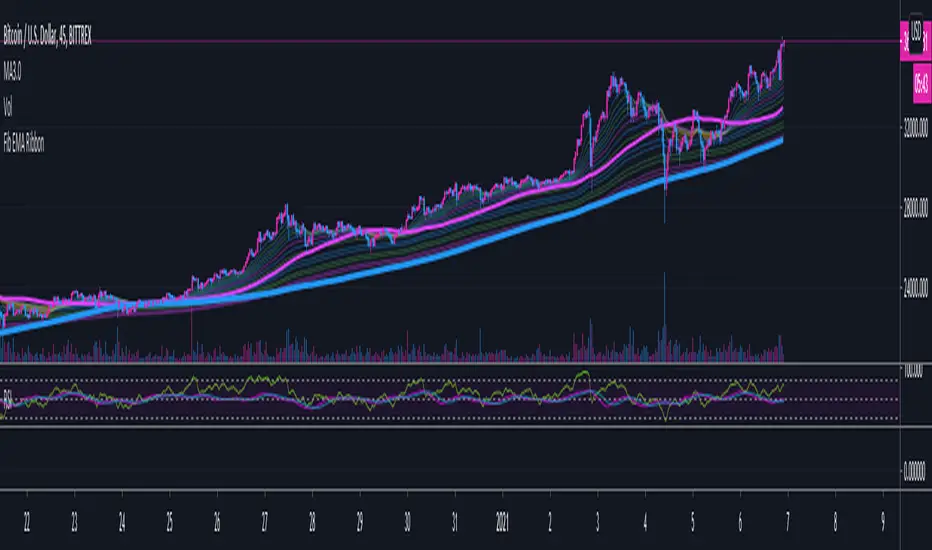
Fib EMA RibbonPretty weird and experimental fibonacci ribbon overlay, for visual use and fun only at the moment. Will update the script if i think of any other ways to use it, ideas welcome.
Meant for use with Heikin Ashi candles.
Biffy
MA Study: Different Types and More [NeoButane]A study of moving averages that utilizes different tricks I've learned to optimize them. Included is Bollinger Bands, Guppy (GMMA) and Super Guppy.
The method used to make it MtF should be more precise and smoother than regular MtF methods that use the security function. For intraday timeframes, each number represents each hour, with 24 equal to 1 day. For daily, 3 is 3 day, for weekly, 4 is the 4 weekly, etc. If you're on a higher timeframe than the one selected, the length will not change.
Log-space is used to make calculations work on many cryptos. The rules for color changing Guppy is changed to make it not as choppy on MAs other than EMA. Note that length does not affect SWMA and VWAP and source does not affect VWAP.
A short summary of each moving average can be found here: medium.com
List of included MAs:
ALMA: Arnaud Legoux
Double EMA
EMA: Exponential
Hull MA
KAMA: Kaufman Adaptive
Linear Regression Curve
LSMA: Least Squares
SMA: Simple
SMMA/RMA: Smoothed/Running
SWMA: Symm. Weighted
TMA: Triangular
Triple EMA
VWMA: Volume Weighted
WMA: Weighted
ZLEMA: Zero Lag
VWAP: Vol Weighted Average
Welles Wilder MA