Joel on Crypto - MACD ScalpingJoel on Crypto - MACD Scalping
This is a Scalping indicator primarily intended for the 5 minute time frame.
It is based on the Crypto Scalping YouTuber Joel on Crypto's popular 5 minute scalping strategy and this is the indicator he personally use when Scalping.
This is a Multi-timeframe indicator where if you use it on the 5 minute time frame, the MACD Histogram bars will be based on the 1 minute timeframe.
The purpose of this indicator is not to trade it like a bot. The purpose is to grab the traders attention a time where there COULD be a scalping opportunity.
Use this indicator at your own risk.
Scalping

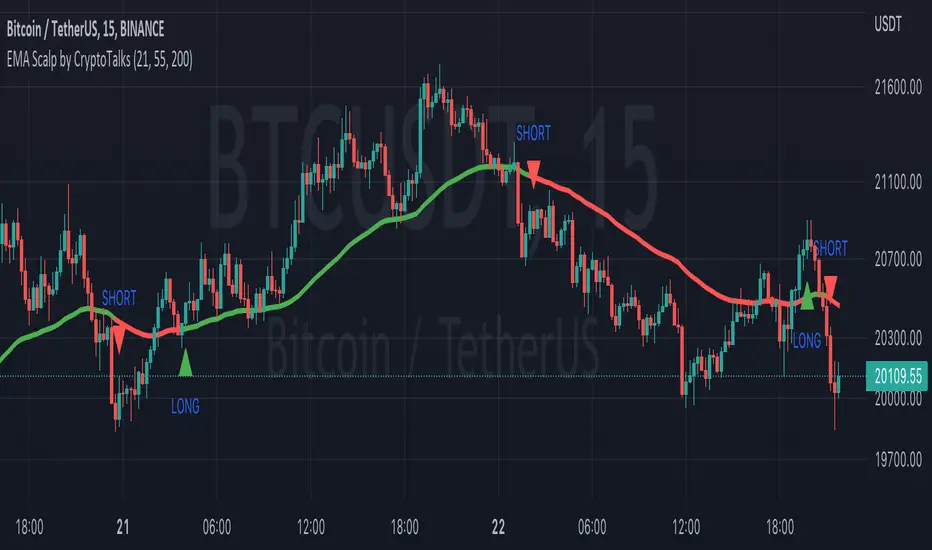
EMA Scalp by CryptoTalksEMA Scalp by Crypto Talks
EMA Scalp by Crypto Talks can be used Using Small Time Frame we Can use it in a better way and on every crossover of Two Moving Averages we can identify the trend for next 15-20 Mins. If you want to use the same for Large time frame even that is possible but you need to hold the call.
Two Different Signals are provided depending on the movement of Moving Averages Long and Short.
There are three Moving Averages used one is 21MA, Second is 55MA and Third one is 200MA where 21 & 55 decides the Market Trend and the third one 200 which confirms the trend and by using these three it makes this indicator Unique.
Thank you
*************
Budhil Vyas
Crypto Talks
(Data Scientist)
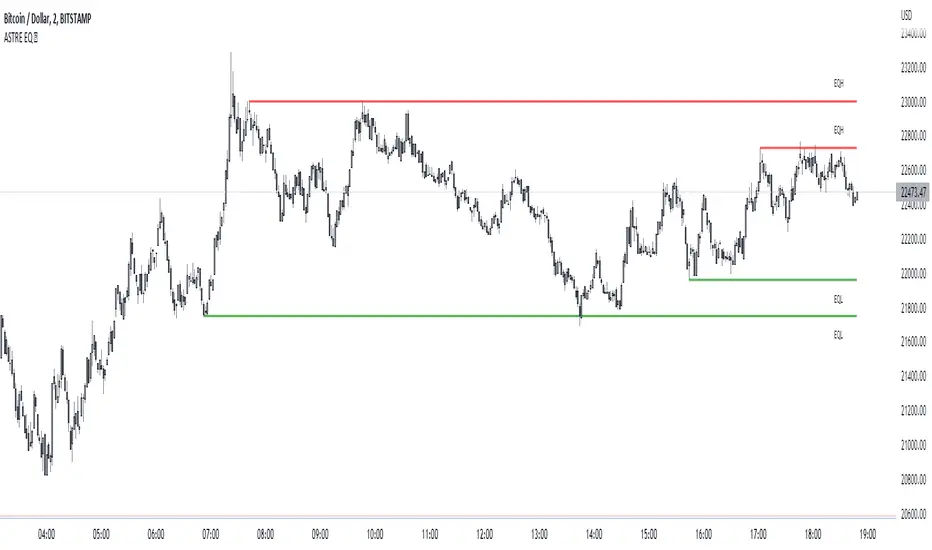
EqwhaleDisplay Equal high/ low, alert when liquidity is taken.. or created !
An innovation that flows a bit if you are an SMC trader and which was actually missing on TradingView: identification of equal high/low, alerts when liquidity is taken... or created!
Its choice in the design means that it gives more importance to the last identified pivots: that is to say that it will display more recently created liquidity than old one! Perfect for identifying market inducement mechanisms (SMC) under an area of interest. This is a typical pattern of induction and false breakout: 2 hits, the break, reintegration, and real move :
Quick exemple on BTC, you are alerted by liquidity created:
Then we grab, and deep. :)
You can display "old broken lines" for backtesting. Careful, it actually display lines when pivot is detected and broken at the same time : it's false. checks that the line has been touched twice :) So, some false lines in the backtest but it does not affect the indicator at all.
You can set number min of pivot at 1 to plot current high/low untested !
Custom GridIt's a simple little tool that enhances Tradingview's horizontal level grid. Set the range of up to 12 assets, you save your model, and the levels will show up automatically when you switch between graphs.
it is obvious to note that the market reacts on the round levels if it discovers its levels for a long time.
Where using notions of supports / resistances gives you level information once the level has been created, again you can correlate this indicator with other SMC and price action tools to identify areas of rejections or dips. institutional interventions.

Liquidity mapLocate institutional daily, weekly, and monthly liquidity intervention zones in an innovative format that allows you to fractalize the degree of trend reversal opportunity across multiple lengths!
Far from the traditional formats to tell you "where's the high/low", we display with this map the grab levels relating to the amplitudes of the measured period.
You can check "show old levels" to backtest these potential fractal reversal areas.
Use the levels that interest you according to your working UT (scalping, intraweek, swing, etc.), or take all the elements into consideration for your trading management :
Confluence the information to optimize your entry and shelter your stop loss under strong levels rejections !
Default parameters are: display high/low weekly & monthly, display liquidities levels in daily.

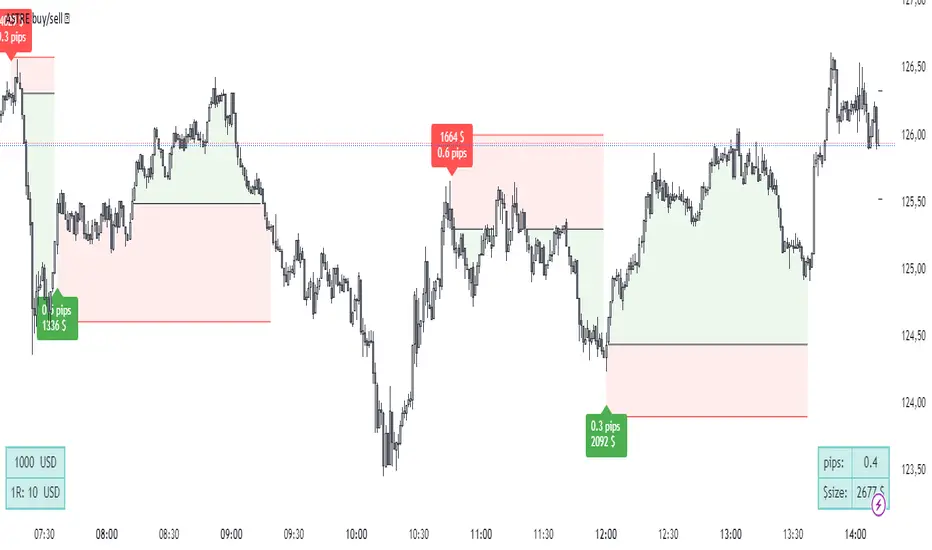
ASTRE Buy/SellWe have designed one of the best buy /sell indicators ! based on our "Reversal score" indicator, a set of strict conditions based on dynamic divergences and fisher's transformation allows to trigger buy signals. The idea is that at a certain level of technical pressure from the indicator, the market has a high probability of changing direction !
(always with the objective of capturing the best top/bottom :) )
Did you miss your trade entry? No problem! The "Barcolor retest" feature allows you to identify a perfect entry on a retest once the structure has been confirmed after a signal:
Exemple on 30s chart :
Using advice :
Use an ATR-type stop loss, or shelter behind bollinger, a short, fixed distance in pips at a minimum below the last local high/low. Your stop loss must be tight and relevant!
For take profit, I recommend that you trail stop part of your position, exit on a contrary signal, or exit part of the position at 5:1 for example.
it is recommended to lower your risk for each identical consecutive signal: 3 buy signals in a row, take a risk for example of $100 on the first, $70 on the second, $40 on the third. The idea is not to be suffocated by the multiple bad signals within the framework of a bad time frame compared to the amplitude of the trend that we seek to take against the trend!
SOON: Easier configuration for 3 commas, backtests. Stay tuned !
astre_ts can in no way be held responsible if your trading account is liquidated after having followed a buy/sell signal and used a large leverage. The signals are reversals: so many are false before having a (very) good trade. Be sure to have strict risk management, or to use a complete strategy so that your results are faithful to the backtests.
Intraday rejection levels3 supports, 3 resistances and an equilibrium price per day displayed at 9am (GMT+2), calculated on the dynamic study of the market at its opening over a certain period that we could qualify as "first opening interventions"
Method: We are interested in the first reaction of the market when it discovers one of the levels.
The red and green zones (from levels R2 to R3) are the zones of rejections/daily overextensions with large RRs of which we will appreciate a rejection for the US opening (where the zones are more opaque, the Killzone!), because the session US is known to either accompany the London session or completely break the trend.
Equilibrium, on the other hand, is a retest zone that can be traded in several directions, ideal for capturing the first retracement / retest of a recently broken structure:
Activate "EL" to display an ideally early morning rejection area so levels can be scalped! They correspond to opportunistic areas above the high and below the low of a custom Asian session ignoring part of the London open - which I consider to be liquidity :):
FIRST SETUP: Confluence R1/R2 with the EL!
SECOND SETUP: The price does not frequent the R2/R3 zone during London but only during the killzone:
Anticipate rejection zones, put them in confluence to find the best opportunity!
Tips:
I'm only interested in the first reaction on these levels
You can measure the difference between R1 and EQ: on average on the EURUSD it must be 20 to 30 pips! Apart from these values, I deduce that the market is unbalanced: I lower my risk on my scalps and I am more cautious.
It is possible to use the previous day's levels to look for correlations
Ideally, the Asia range Custom should not take the high/low of the day before (see "LIquidity maps" indicator on our profile for optimal use)
As an option you can display the standard pivot, and activate the "crypto" mode to be able to use it on your favorite crypto :)

Reversal scoreDynamic divergence indicator on 3 indicators, without delays or repaints
Technological choices have been made so as not to lie to you about the signals, and so that the backtesting is perfectly faithful to reality. The market is analyzed and looks for a dynamic status of divergence on the Fisher transformation, the Money Flow Index and the MACD: if the status is "divergence", it is quantified by a divergence score to assess its potential and whose parameters are multiple (including market structure during divergence status).
At the top Reversal score, at the bottom the divergence indicator integrated in Tradingview. On this last candle, there will indeed be an RSI divergence but which will only be displayed 5 candles later, where ASTRE displays it to you in real time:
You will notice how certain spikes trigger sharp divergence – an anomaly between the movement of the price and that of the indicators is a good sign of an instant reversal, and in m2, a way to take a 2:1 TP in seconds:
Usage tip: Follow the signals in the direction of the main trend! They are much less numerous but very effective! :
Waddah Attar RSI Levels [Loxx]Waddah Attar RSI levels is an indicator created Ahmad Waddah Attar that draws a daily RSI over onto the current lower timeframe chart.
Wilders' RSI:
The Relative Strength Index ( RSI ) is a well versed momentum based oscillator which is used to measure the speed (velocity) as well as the change (magnitude) of directional price movements. Essentially RSI , when graphed, provides a visual mean to monitor both the current, as well as historical, strength and weakness of a particular market. The strength or weakness is based on closing prices over the duration of a specified trading period creating a reliable metric of price and momentum changes. Given the popularity of cash settled instruments (stock indexes) and leveraged financial products (the entire field of derivatives); RSI has proven to be a viable indicator of price movements.
Rapid RSI:
Rapid RSI Indicator, from Ian Copsey's article in the October 2006 issue of Stocks & Commodities magazine. RapidRSI resembles Wilder's RSI , but uses a SMA instead of a WilderMA for internal smoothing of price change accumulators.
Details
-Used for intraday trading, restricted to timeframes 1 hour and below
-Best Time Frames 15, 30, 60 minutes

Waddah Attar Hidden Levels [Loxx]Waddah Attar Hidden Levels is a dynamic indicator of support of resistance built by Ahmad Waddah Attar
Details
-Uses data from the Daily time frame only
-Used for intraday trading, restricted to timeframes 1 hour and below
-Best Time Frames 15, 30, 60 minutes
-Draws support and resistance lines on chart inside a boundary of fibonacci levels
How to use Waddah Attar Hidden Levels
-Breakout trading indicator
-Buy at the broken red line, or insert pending buy order
-Sell at the broken green line, or insert pending buy order
-Take profit/Stop-loss at blue lines
Breakout Finder Strategy by The Accumulation ZoneThe Breakout Strategy:
Indicators used:
Least Squared Moving Average by Tradingview
Smoothed Moving Average by Tradingview
MACD Support Resistance by venkatachari_n
About this Strategy:
This strategy is based on spotting a particular activity pattern involving the above listed indicators:
A fast moving average that will track closely with price while still smoothing out some price chop
A slower least squared moving average to help gauge short-term momentum
MACD Support and Resistance to help identify longer-term trends and potentially serve to also guide directional bias
If all entry conditions are met, the strategy enters a position. As well as sending an alert message for the Entry, TP/SL Signals
Long Condition:
Price close above MACD S/R Line
SMMA crossed MACD S/R Line to the upside
LSMA crossed MACD S/R Line to the upside
Short Condition:
Price close below MACD S/R Line
SMMA crossed MACD S/R Line to the downside
LSMA crossed MACD S/R Line to the downside
Strategy Settings
SL based on ATR Bands (0.9 ATR Multiplier recommended*)
TP based on RR (1.5 RR recommended*)
Optional EMA Filter (If set to 0 -> disabled)
Session Filter
Custom Strategy Backtesting Dashboard (Risk = 5%*)
*Recommended for a Daily BTC/USDT Chart

JVC_scalp_v1How to use this strategie :
Usable and optimised on a 5-minute chart.
Red background color for short.
Green background color for long.
JVC_SCALP_V1 is a strategy based on the strategy posted by 5mScalpingStrat.
This script uses the following indicators
- L2 Perry Kaufman Adaptative MA ( KAMA )
- Willy 21e13 fixed tsmmob
- EMA 200
- Supertrend M15 to filter false positives
Red background color (sell signal) when the following conditions are met:
- Sell signal blackcat
- Sell zone supertrend M15
- Price < EMA 200 (2 candle close)
- Willy 21e13 output < -90 ou Willy 21e13 EMA < -80
Green background color (buy signal) when the following conditions are met:
- Buy signal blackcat
- Buy zone supertrend M15
- Price > EMA 200 (2 candle close)
- Willy 21e13 output > -10 ou Willy 21e13 EMA > -20
Two levels of colour are proposed according to the value of the output and the EMA.
You can change the settings in the script parameters.
If you find more relevant settings, don't hesitate to contact me so that I can apply an update in the code.

Directional ExpectancyThe Directional Expectancy tool is a volatility based indicator, It is a Directional Correlation to the Volatility given by the Historical Volatility Percentile.
We calculate this correlation function then visually color plot it across a moving average of the HVP.
Use this tool to not only gauge the Historical Volatility that is present as well as the Directional Expectancy of the volatility and price!
Customizable Non-Repainting HTF MACD MFI Scalper Bot StrategyThis script was originally shared by Wunderbit as a free open source script for the community to work with.
WHAT THIS SCRIPT DOES:
It is intended for use on an algorithmic bot trading platform but can be used for scalping and manual trading.
This strategy is based on the trend-following momentum indicator . It includes the Money Flow index as an additional point for entry.
HOW IT DOES IT:
It uses a combination of MACD and MFI indicators to create entry signals. Parameters for each indicator have been surfaced for user configurability.
Take profits are fixed, but stop loss uses ATR configuration to minimize losses and close profitably.
HOW IS MY VERSION ORIGINAL:
I started trying to deploy this script myself in my algorithmic trading but ran into some issues which I have tried to address in this version.
Delayed Signals : The script has been refactored to use a time frame drop down. The higher time frame can be run on a faster chart (recommended on one minute chart for fastest signal confirmation and relay to algotrading platform.)
Repainting Issues : All indicators have been recoded to use the security function that checks to see if the current calculation is in realtime, if it is, then it uses the previous bar for calculation. If you are still experiencing repainting issues based on intended (or non intended use), please provide a report with screenshot and explanation so I can try to address.
Filtering : I have added to additional filters an ABOVE EMA Filter and a BELOW RSI Filter (both can be turned on and off)
Customizable Long and Close Messages : This allows someone to use the script for algorithmic trading without having to alter code. It also means you can use one indicator for all of your different alterts required for your bots.
HOW TO USE IT:
It is intended to be used in the 5-30 minute time frames, but you might be able to get a good configuration for higher time frames. I welcome feedback from other users on what they have found.
Find a pair with high volatility (example KUCOIN:ETH3LUSDT ) - I have found it works particularly well with 3L and 3S tokens for crypto. although it the limitation is that confrigurations I have found to work typically have low R/R ratio, but very high win rate and profit factor.
Ideally set one minute chart for bots, but you can use other charts for manual trading. The signal will be delayed by one bar but I have found configurations that still test well.
Select a time frame in configuration for your indicator calculations.
Select the strategy config for time frame. I like to use 5 and 15 minutes for scalping scenarios, but I am interested in hearing back from other community memebers.
Optimize your indicator without filters (trendFilter and RSI Filter)
Use the TrendFilter and RSI Filter to further refine your signals for entry. You will get less entries but you can increase your win ratio.
I will add screenshots and possibly a video provided that it passes community standards.
Limitations: this works rather well for short term, and does some good forward testing but back testing large data sets is a problem when switching from very small time frame to large time frame. For instance, finding a configuration that works on a one minute chart but then changing to a 1 hour chart means you lose some of your intra bar calclulations. There are some new features in pine script which might be able to address, this, but I have not had a chance to work on that issue.

Scalping Support Resistance StrategyScalping strategy for BTC using one line: Support Resistance.
The strategy draws a line based on the minimum value of the average of High, Low, and Close for a given bar. The entries are carried out on the breakdown of this line. Exits are managed by the specified in the script's inputs take-profit and stop-loss percentages.
From Stream:
www.tradingview.com

The Impossible TraderTHE IMPOSSIBLE TRADER
A simple, but effective High Freq Strategy script based on MACD or RSI trend, with extra customizable Alert Messages for Bots.
WHAT IT DOES
This script (works best at lower TimeFrames) just follow the trend of MACD or RSI on your asset.
Why it should work? Because in an upper trend, there are more chance of green candles than reds. And in dump trend there are more chance of red candles than greens.
While trend is positive, it will try to open Long orders as fast as possible at market price.
While trend is negative, it will try to open Short orders as fast as possible at market price.
HOW TO SETUP YOUR PREFERENCES
Capital : Insert a % of Margin you want to use for your positions (usually 30% is quite good)
Leverage : Choose leverage based on your plans
Trail Tick @ : This value (in Tick) tell the script "when" the "Trail Stop" order must be activated (from the Entry price)
Offset Tick @ : This is the price (in Tick) from the Trail Stop Price activated. Basically it is a Stop Loss that follow the price at a fixed distance.
SL Tick @ : Set a Stop Loss at amount Tick distance from the Entry Price. (Let's call it a Safety Stop Loss for bad decisions...)
TP Tick @ : Set a Take Profit at amount Tick distance from the Entry Price. Sometimes is better to exit in full Gain than keep positions.
Strategy : You can choose a Only Long, Only Short or Long+Short sametime strategy.
with MACD or RSI : You can try the strategy applied on MACD or applied on customizable RSI EMA
EMA : If you choosed RSI EMA, you can set any value for your testing (usually 80-120 works very nice)
Exit order after bars : Some Exchanges / Brokers apply fixed cost, and a strategy too fast could not be productive. This set will let you to delay the Exit Order on already Opened positions.
Keep Stop Loss active : If you are planning a delay for Exit Orders, sometime could be useful to keep activated Stop Loss.
Strategy Preset : Some preset I've found interesting, with good results.
BackTest Days : If there are too many results and script doesn't work, you can choose a closer range to show results.
EXTRA FEATURES
On Screen Display : OSD will show you some realtime stats about your strategy, like Asset Tick, Trading Period Range, Drawdown, Gains and not closed trade.
Alert Message : You can enter custom Long Entry/Exit and Short Entry/Exit message for your Bots (like AutoView, WunderBit, etc...). When alert is triggered, you can send custom message with {{strategy.order.comment}} in the text field
AutoView Alert Message : If you are user of AutoView, you can generate your calls. Those are tested only on Oanda with index like Sp500, US100, Us30.
TIPS ON USE
Some asset on TradingView require an higher initial capital. Go to this Script Settings -> Properties and rise Initial Capital.
Be aware of commissions and spread when evalutating a strategy. Go to this Script Settings -> Properties and set Commission and Slippage
Trail Stop and Ticks could be difficult to understand, but very profitable. Please take your time and study how it works.
Consider Tick like the minimum movement your asset can do. Ticks occurs "intra-bar", so some of your positions could be closed almost instantly.
Consider Trail Stop like a Stop Loss that keep always the same distance from your positions, but never came back . If you are in gain, say of 10 Ticks, and your Trail have 5 Ticks, this means for sure a close at minimum 5 Ticks from Entry Price.
On Screen Display will show you Ticks for your asset. This will help you on strategy settings, because not all asset responds on the same way.
ONLY LONG EXAMPLE
ONLY SHORT EXAMPLE

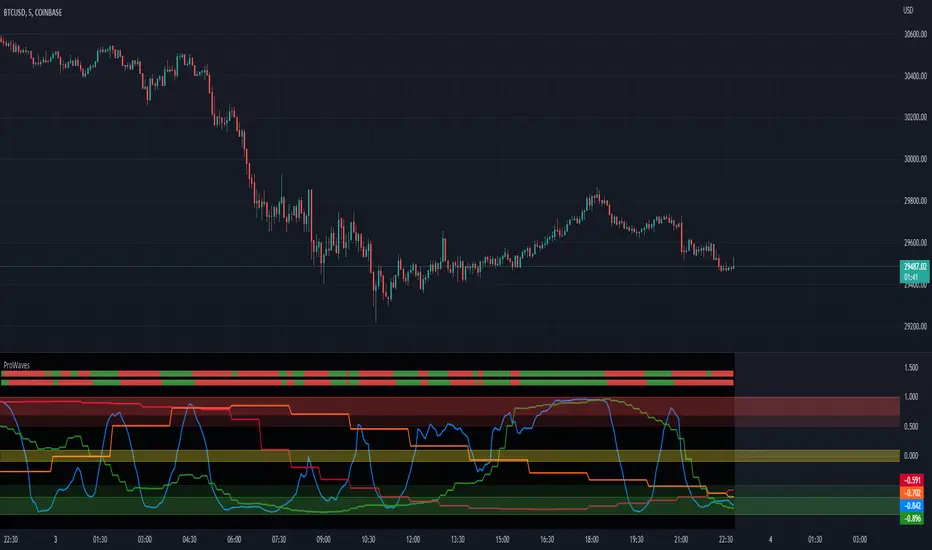
ProWaves - [Soldi]ProWaves
Introducing the latest and greatest tool in the DynaPro Trading Tools! ProWaves is a multi timeframe precision trend tool to help traders identify the waves of the market and trade the convergence, exhaustion points, continuation points of multiple timeframes.
By default you will have a 15m, 1h and 2h Wave on your indicator - this is completely customizable by the user! You can choose up to 3 higher timeframes to display the underlaying wave trend.
How Do I Enter Trades?
To bring ProWaves into a full trading system someone could easily use we have to make a trade trigger system for potential entries - an original and unique Trend Bar system to easily signal a trader that there is an entry present. These trend bars use 2 sensitive weighted moving averages based off the HL2 of the candle, we offset them to create a ribbon like effect to help eliminate any false signals
Include this in your own trading strategy or compile it with DynaPro's other institutional caliber tools!
To use ProWaves effectively you will want to understand wave theory first
This indicator is based off the idea of Elliot wave and fractal cycles of the market, to really understand what this indicator is reading you will need to understand what Elliot Wave is along with fractal cycles in the markets.
What Are The Waves Based On
The waves are primarily a Correlation function to make an oscillated value of "trend", by doing so and measuring this across multiple timeframes we are able to gain a sense of clarity on the tops and bottoms of the markets as well as the trends that take place in between!
NOTE
When the Waves are above/below - 0.5/-0.5 then the wave is in an area of significance for either a reversal or to influence a trend - couple this with the precision of the Trend Bars system then you have a great trading system!
SP IndicatorSP Indicator - One of the best indicators for scalping trading on any timeframes. The best readings are given on 5, 15 and 30 minute frames.
For readings, several indicators are combined into one, which allows you to get a more accurate forecast, which is more than 90%.
Instruction.
The indicator is easy to use. Just install it and follow the arrows to go long or short. Stop loss set small, about 1-2%. In most cases, this is sufficient.
Good luck in bidding!
Scalping Alice 3/5INTRO
Scalping Alice is a work in progress. I made it to help with my Scalping Long strategy as a helper for entrances.
This instance of the indicator is for 3min and 5min chart analysis only.
It still needs to further adopt and calibrate multi-frame data, but for the moment it takes from the Daily, the Hourly and the 15min.
It is meant to be used WITHOUT candles. This is because, one of the goals I'm trying to achieve is to compress data and leave out unwanted noise.
The 3min and 5min candles are very dynamic (specially in the crypto market), so I don't need to know the whole OHLC, but I do need a range.
COMPONENTS
Small Blob
The first component is the current time-frame Price Blob. The top line is the candle Highs and the bottom line is the candle Lows.
The Price Blob's Color changes according to a Double RSI which you can modify the values for.
The default is 13 for the Fast RSI and 34 for the Slow RSI.
When the Fast RSI is on top it turns Green. When the Slow RSI is on top it turns Red.
Big Blob
The Outer Blob is the same as the inner blob, but in the 15min time-frame. It changes color the exact same way, but with 15min values.
WMA Line
The closest line to the blob is the WMA line. You can change the default value, which is 21.
The color changes according to a complex modifier, that I will try to explain, but most likely fail.
It takes a sort of Tenkan (see Ichimoku Cloud if you don't know what a Tenkan is) value from the 15min chart and the Hourly chart.
It then compares the difference from these Tenkans and adds it to the 15min mid price.
And finally tries to find a fast Trend of the movement of the price for the last 3 candles.
The Tenkan value can be changed from it's default 3. Be wary, this changes the Tenkans for all the timeframes.
Blue Tenkan
The slower line is an Hourly Tenkan but with a value of 9.
Saturation Clouds
The last piece are the orange Saturation Clouds. These appear in bigger price movements and work weirdly.
They are differences between Hourly Tenkan and current frame Tenkan, along added to the mid point of the price and a little bit of Bollinger math.
Again, hard to explain, but they are very useful. Maybe one of the most useful parts of Alice.
BULL AND BEAR
Bullish :
- Green Small Blob
- Green Big Blob
- Green WMA
- Small Price Blob Above WMA
- Small Price Blob Above Blue Tenkan
- Small Price Blob Inside Upper Saturation Cloud
- Lower Saturation Cloud appears but DOES NOT touch Small Price Blob
Bearish
- Red Small Blob
- Red Big Blob
- Red WMA
- Small Price Blob Below WMA
- Small Price Blob Below Blue Tenkan
- Small Price Blob Inside Lower Saturation Cloud
- Upper Saturation Cloud appears but DOES NOT touch Small Price Blob
SMALL TIPS
Saturation Clouds
When the Saturation Clouds appear, it is an indication of strong price decision.
If it appears but it is far from the Small Blob then this indicates Price Reversal.
Most likely a nice moment to enter an opposite trend trade.
If the cloud appears touching the Small Blob and the Small Blob enters the cloud, this is Trend Confirmation.
The price is going to go strongly towards the Trend is is on.
Most likely a nice moment to enter an accompanying trend trade.
Price Bounce
The Small Blob bounces inside the Big Blob. This is very useful for numerous short plays.
You have better chances opening longs when the price is on the Lower parts of the Blobs.
The same goes for shorts on the Upper Parts.
Slow and Fast
The color of the WMA is a very fast indicator, it's the least reliable one.
Then comes the Small Blob color, then comes the WMA itself.
Following that you have the Big Blob color, then the blue Tenkan.
And finally the Saturation Clouds are the most reliable part.
FINAL THOUGHTS
This is a publishable version of this strategy. I hope to keep working on these types of strategies, maybe even upgrading this one.
Enjoy, share and leave comments!

MY_SCALP strategyThe MY_SCALP strategy is designed to work with any instrument (cryptocurrency, stocks, forex).
The working timeframe for scalping is small from 1 to 15 minutes, and for trend trading from 30 minutes.
Signals are generated based on the price range (channel) within which the price of the instrument moves.
When the price of the channel breaks up, we expect an upward movement, and when it breaks down, we expect a downward movement.
To avoid manipulations in the market, the algorithm monitors the level of the price relative to the global trend and thus filters out a large part of the false signals.
In addition, in the settings it is possible to show additional inputs - these are the moments of rebound from the edge of the channel inwards, also with filtering applied.
-------------------------------------
💹 SETUP SETUP:
-------------------------------------
To adjust, you should change the value of the CHANNEL multiplier - this depends on the sensitivity and flexibility of the range.
For TF 5m it will be about 8-9, and for TF 1H about 4-5. That is, the higher the TF, the lower the value of the CHANNEL multiplier.
-------------------------------------
🟢 TAKE SETUP:
-------------------------------------
The strategy has 2 takes
You can choose the type of take - FIX or CHANNEL
FIX - fixed targets in %.
CHANNEL - channel takes (The width of the channel at the moment the signal appears is multiplied by the specified multiplier and thus the size of the take is calculated.).
Important: the 1st take cannot be more than the 2nd!
-------------------------------------
⛔️ STOP SETUP:
-------------------------------------
Stop type is also selectable:
FIX - fixed stop in %.
CHANNEL - channel stop (set % of the price for the offset from the opposite side of the trading channel. For additional entries, the stop uses the value of half the channel width + the specified offset from the position entry price).
You have the opportunity to activate the stop line tightening when the 1st tp1 take breakeven is reached.
-------------------------------------
💡 OTHER USEFUL FEATURES
-------------------------------------
✅ In the strategy, you can enable / disable the display of takes and stop lines.
✅ In the strategy, you can enable / disable the display of points of probable price rebounds.
✅ You can choose the direction of trading: long, short or any.
✅ You can choose the percentage of the position to close on the 1st take.
✅ It is possible to enable background highlighting of the current trend. This background does not stretch to the entire screen, but is limited to the calculated extremes, within which the asset price moves.
✅ The screen has a compact display of a table with the current strategy settings and the current state (position, takes, stop).
For the convenience of saving your settings, use the standard PrintScreen function.
✅ You can sign the strategy in the Notes field - this is convenient if you place several versions of the MY_SCALP strategy on the chart with different settings (for different pairs or for different timeframes).
✅ 👉 In the strategy settings, each field has hints , to do this, hover over the ⓘ sign
-------------------------------------
MY_SCALP strategy is closed! You can get test access to it for 48 hours.
👉 In order to gain access or ask questions, write to me in private messages or at the contacts indicated in my signature.
-------------------------------------
========================================================================================================
Стратегия MY_SCALP предназначена для работы с любым инструментом (криптовалюта, акции, форекс).
Рабочий таймфрейм для скальпинга - малый от 1 до 15 минут, а для трендовой торговли от 30 минут.
В основе формирования сигналов лежит ценовой рейндж (канал), внутри которого движется цена инструмента.
При пробитии ценой канала вверх, мы ожидаем восходящее движение, а при пробитии вниз - нисходящее.
Чтобы избежать манипуляций на рынке, алгоритм отслеживает уровень нахождения цены относительно глобального тренда и тем самым фильтрует немалую часть ложных сигналов.
Кроме этого в настройках есть возможность показать дополнительные входы - это моменты отскока от края канала внутрь, также с применением фильтрации.
-------------------------------------
💹 НАСТРОЙКА СЕТАПА:
-------------------------------------
Для настройки следует ищменять значение множителя канала CHANNEL - это этого зависит чувствительность и гибкость рейнджа.
Для ТФ 5м это будет примерно 8-9, а для ТФ 1Ч примерно 4-5. То есть, чем выше ТФ, тем ниже значение множителя CHANNEL.
-------------------------------------
🟢 НАСТРОЙКА ТЕЙКОВ:
-------------------------------------
Стратегия имеет 2 тейка
Тип тейка можно выбрать - FIX или CHANNEL
FIX - фиксированные тейки в %.
CHANNEL - канальные тейки (Ширина канала в момент появления сигнала умножается на заданный множитель и таким образом высчитывается размер тейка.).
Важно: 1-й тейк не может быть больше 2-го!
-------------------------------------
⛔️ НАСТРОЙКА СТОПА:
-------------------------------------
Тип стопа также выбирается:
FIX - фиксированный стоп в %.
CHANNEL - канальный стоп (задаётся % цены для отступа от противоположной стороны торгового канала. Для дополнительных входов стоп использует значение половины ширины канала + заданный отступ от цены входа в позицию).
У Вас есть возможность активировать подтяжку стоп-линии при достижении 1-го тейка tp1 в безубыток.
-------------------------------------
💡 ПРОЧИЕ ПОЛЕЗНЫЕ ФУНКЦИИ
-------------------------------------
✅ В стратегии можно включить/отключить отображение тейков и стоп-линии.
✅ В стратегии можно включить/отключить отображение точек вероятных отскоков цены.
✅ Можно выбрать направление торговли: лонг, шорт или любое.
✅ Можно выбрать процент позиции для закрытия на 1-м тейке.
✅ Есть возможность включения фоновой подкраски текущего тренда. Данный фон не растягивается на весь экран, а ограничивается расчётными экстремумами, в рамках которых двигается цена актива.
✅ На экране есть компактное отображение таблицы с текущими настройками стратегии и текущим состоянием (позиция, тейки, стоп).
Для удобства сохранения своих настроек - воспользуйтесь стандартной функцией PrintScreen.
✅ Вы можете подписать стратегию в поле Notes - это удобно, если Вы размещаете на графике несколько версий стратегии MY_SCALP с разными настройками (для разных пар или для разных ТФ).
✅ 👉 В настройках стратегии у каждого поля есть подсказки , для этого наведите курсор на знак ⓘ
-------------------------------------
Стратегия MY_SCALP является закрытой! Вы можете получить к ней тестовый доступ на 48 часов.
👉 Для того, чтобы получить доступ или задать вопросы пишите мне в личные сообщения или по контактам, указанным в моей подписи.
-------------------------------------

Bollinger Bands + EMA 9A 1 minute scalping strategy.
Uses Bollinger Bands (no basis line) and a 9 period EMA.
Waits for price to close below the lower Bollinger Band and the next candle to close bullish above the lower Bollinger Band but below the 9 Period EMA.
If all conditions are met, the script enters a long position with TP at the 9 Period EMA.

SIVE 2.0 - [Soldi]SIVE 2.0 IS FINALLY HERE, after the long awaited update we are finally able to bring to you SIVE 2.0!
SIVE 1.0 (Systematic Institutional Volatility Expansion) brought a whole new approach to the algorithm and retail trading game on TradingView. Never before have you had access to a quantitative institutional approach like this, after years in development and testing we finally brought SIVE 1.0 to market. With very very high demand, support and so much positive feedback we knew that what we've created really hit the mark for so many traders!
What is SIVE?
SIVE as stated above stands for, Systematic Institutional Volatility Expansion. What this means is we have a highly effective system that reads what institutional algorithms are proven to be looking at. While only providing alerts during periods where Volatility is Expanding
We don't shy away from volatility here, that is where the bread and butter lays. volatility is a double edged sword that not many people know how to effectively use to their advantage. Simply put, because they are told in their retail trading that volatility is risky, and that you should stay away from volatile products. I say embrace it with the right tools.
What Has Changed?
At the core, SIVE 2.0 brings more efficient calculations to the volatility modelling as well as the triggering of trades!
Trend Scalper - This is a sub-set strategy we have included, what it measures is 'Super Trend' with a deviation of 7 and the MTI ribbon crosses. This is to be used as a way to scalp and trade the momentum of the market. I am aware that another brand/community has put this out as a paid feature to their algorithm. Since they didn't want to credit me for my contribution I decided to release it for free and also add it here. This is listed in my scripts as a free to use access.
Volatility Confluence - We have now also added a feature where you can choose how many volatility models you want to be aligned before SIVE calls an alert. There are a total of 9 models we have included, example. You choose 3 'Volatility Confluence', this means that SIVE will only call alerts when 3 of those 9 models agree. This can be very effective if you want to have more refined volatility trades, giving you more confidence that an expansion will take place.
Low Volatility Flashes - You now have the ability to control the low volatility back ground flash feature that was included with SIVE 1.0
Volatility Candles - You can now plot the volatility strength as candles! before you weren't able to see the actual underlaying volatility . Till now, turn this on and watch it turn you candles into a colourful array of the rainbow based on the volatility . Note - You will either need to *bring to front* or turn off the price data to see it
Take Profit System (beta) - Before on SIVE 1.0 and in the beta versions we had an early version of the money management. Where based on the ATR on the trade it would give you a suggested Stop Loss and Take Profit area. Now we have completely over hauled that and re calculated how we approach this also giving the trader 2 different options to choose from for suggested Stop Loss placement. We also included a 'Dynamic Take Profit' system that's based on the MTI to give you momentum based Take Profits. These are still in beta stages so any feedback is much appreciated and as always will be reviewed and considered.
RSI bands - Reverse plot the RSI onto your chart. Plot the over sold and over Bought static lines to price!
Moving Average Filter ( Multi Time Frame ) - Introducing a way further refine the trade alerts and give more power into the traders hands. We know that many many traders like to only trade if example. price is Greater Than 200 EMA. We wanted to give traders a choice to refine the trade alerts based on this information. You can choose between 'Price vs MA' - which is explained in that example just provided. The other option is 'MA vs MA', this allows you to filter out trades based on if a Moving Average of your choice(MA1) is Greater than MA2. With all this we also provided Multi Time Frame accessibility to just further give the trader more control and range. You also have the ability to just plot the Moving averages and not filter the trades at all!
Kill Zone / Time Sessions - Including another free script that has already been posted to my account. This script is also unique as it plots the specified time zones 24 hours in advanced . If you trade example. 'New York Session', Instead of using an indicator that only shows you after the fact it happens. You can now plot that time zone 24 Hours in advanced and watch how price trades to it and interacts with it. It has 4 completely customizable Time Zone slots. Please adjust to your time zone and desired sessions.
Here are some examples of SIVE working across various charts with the different features
USDCAD - 1 Hour
Take Profit System
XAUUSD ( Gold ) - 15 min
Trend Scalper System
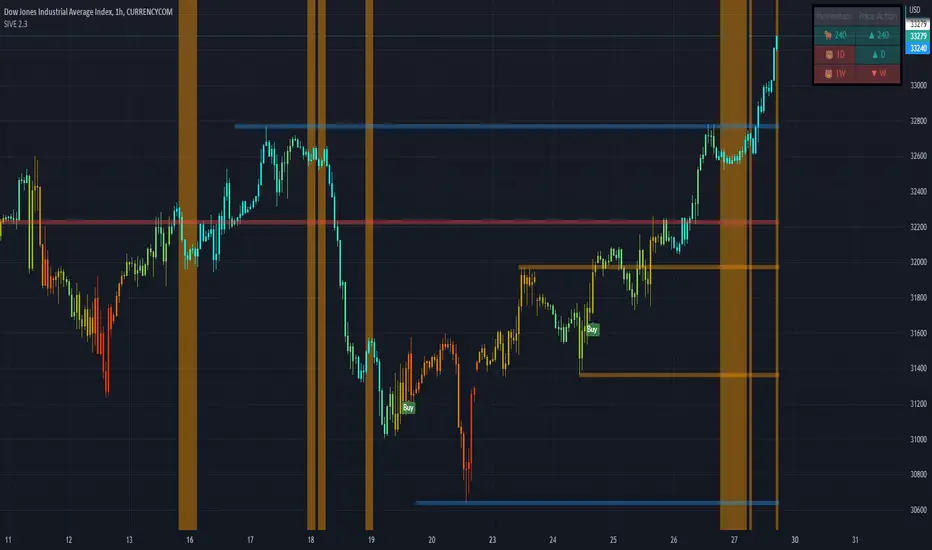
US30(Dow Jones) - 15 min
Volatility Candles + Low Volatility Flashes
BTCUSD ( Bitcoin ) - 1 hour
Support / Resistance + Dashboard + Multi Time Frame MTI
USOIL (WTI Crude Oil ) - 5m
Kill Zones + Moving Average Filter
APPL( Apple ) - 1 hour
Moving Average Filter
SIVE 1.0 [Soldi]SIVE 1.0
What is SIVE?
SIVE stands for Systematic Institutional Volatility Expansion, SIVE uses a variety of different statistical indicators to gauge volatility along with trend correlation and other measures to filter and define a price move. This system was originally set out to redefine what a 'Trend Following System' could be; we achieved more than just that. We had created what is considered to be one of the first retail quantitative trading system, that incorporates trend following mechanics as well as trend reversal techniques. All while being aligned/correlated to trend and volatility . Something truly powerful to put into the hands of the every day trader, demystifying what quant trading can be while easily presenting it in a way where even your mom could learn how to use the system without being overwhelmed.
What makes this different from any other trading system?
SIVE raises the bar on what traditional indicators and trading systems can do, traditionally you have lagging indicators that only tell you what happened in the past with no correlation to the market or what can happen in the future. Really providing little to no statistical value, yet completely idolized by the retail world. Where SIVE exceeds these systems is all in the math and the application of those formulas to the time/price, finding the synchronicities to exploit for profits as well as exploiting the high probabilities of non-random events. How we do it? well that's in the secret crabby patty formula.
Where we are now, and where we plan to go
SIVE as it stands right now is the very first iteration of the retail quantitative trading system, it is performing exceptionally well but we aren't take that as our standard as we want to always raise the bar. as it stands, we are already working on the updates to come that will dwarf anything we've done in the past.
Our goal with SIVE is to be able to provide an easy to learn and easy to profit trading system that will provide the retail public with a trust worthy system to use. In the future our updates will carry heavier weight on key aspects like Risk to Reward, Win rates and capturing those big parabolic movements that everyone dreams of. Far fetched? for the traditional indicator junkies, but for a Quant it is just a matter of time.
What does it perform best on?
Simply put, yes... We set out to create this to be used for any trading instrument and any timeframe. Intraday timeframes have been shown to give more trades and typically higher reward trades as your able to execute with a high degree of accuracy 1:2 is very modest and can easily be achieved but we have also seen so so many trades run higher than 1:10 and even 1:20!! but as you already may know the market doesn't always give those favorable conditions to trade that high of a Risk to Reward all the time.
Stocks, Crypto, Forex, Metals, Energies, Indices, etc. are all tradeable with SIVE
