RCI-CCI-Stochastics SmoothRCI-CCI-Stochastics Smooth - (日本語解説は下記)
Overview:
The RCI-CCI-Stochastics Smooth indicator combines three popular oscillators—RCI (Rank Correlation Index), CCI (Commodity Channel Index), and Stochastics—into a single, smoothed, and performance-optimized tool. Due to the complexity of RCI calculations, adding multiple lines or applying smoothing can often slow down the display or even cause errors. This indicator overcomes these challenges by limiting the display area based on the current timeframe, ensuring smooth performance without sacrificing functionality.
Key Features:
1. Rank Correlation Index (RCI)
Multiple Periods with Smoothing: Calculates RCI for six different periods—8, 10, 20, 30, 52, and 60—providing both short-term and long-term trend analysis.
Double Smoothing: Applies double exponential moving averages (EMAs) to smooth the RCI lines, making them more readable and reducing noise.
Adaptive Display Limitation: To prevent performance issues, the indicator limits the display area based on the current timeframe, ensuring that calculations remain efficient even with multiple smoothed lines.
2. Commodity Channel Index (CCI)
Fixed Source and EMA Period: Calculates the CCI using a fixed source (close price) and a fixed EMA period (3), ensuring consistency in the smoothing process.
Smoothed Output: Applies an EMA to the CCI to produce a smoother line that is easier to interpret.
3. Stochastics Oscillator
Customizable Parameters: Allows you to set the %K, %D, and EMA smoothing periods.
Scaled Display: Adjusts the Stochastics values to align with the -100 to 100 scale used by the RCI and CCI for easier comparison.
Gradient Fill: Provides a visual gradient fill between overbought and oversold levels, enhancing the visual appeal and interpretability.
How It Works:
Performance Optimization:
Display Limitation: The indicator calculates a dynamic display limit (adjusted_limit) based on the current timeframe. This limit reduces the number of bars for which the indicator performs calculations, significantly improving performance.
Time-Based Calculation: Only computes values if the current time is within the calculated start_time, ensuring that the script doesn't waste resources on unnecessary calculations.
Smoothing Techniques:
Double EMA Smoothing: Applies a double EMA to the RCI lines, which helps in reducing volatility and making the trends more apparent.
Consistent Smoothing: Uses fixed EMA lengths for smoothing the CCI and Stochastics, providing a consistent smoothing effect across different oscillators.
How to Use:
Setup:
Add the Indicator: Apply the "RCI-CCI-Stochastics Smooth" indicator to your chart.
Configure Periods: Adjust the periods for RCI, CCI, and Stochastics according to your trading strategy.
Understand Display Limitations: Be aware that the indicator limits the display area to enhance performance. You can adjust the 表示制限値 (Display Limit) parameter if needed.
Interpretation:
RCI Lines: Use the multiple RCI lines to assess market trends across different timeframes. The smoothed lines make it easier to spot trend changes.
CCI Line: Monitor the smoothed CCI line for identifying overbought and oversold conditions.
Stochastics: Utilize the scaled Stochastics oscillator to confirm momentum and potential reversal points.
Tips:
Adjust Display Limit Carefully: Increasing the display limit may impact performance. Find a balance that suits your needs without overloading the system.
Combine with Other Indicators: Use this indicator in conjunction with price action and other technical indicators for more robust analysis.
Cautions and Disclaimer:
Indicator Limitations:
Performance Trade-Off: While the indicator optimizes performance through display limitations, extremely high settings may still cause slowdowns or errors.
Data Accuracy: Ensure that your data source is reliable to maintain the accuracy of the indicator.
Trading Responsibility:
Self-Responsibility: This indicator is a tool to assist in trading decisions. The final investment decision should be made at your own risk.
Risk Management: Trading involves risks, and losses may occur. Please perform appropriate risk management.
Summary:
The RCI-CCI-Stochastics Smooth indicator offers a comprehensive view of market momentum and trends by combining multiple oscillators into a single, smoothed display. Its performance optimization ensures that you can use advanced smoothing techniques and multiple lines without compromising your system's speed or encountering errors. This makes it a valuable tool for traders seeking detailed technical analysis without the usual performance drawbacks.
日本語解説
概要:
RCI-CCI-Stochastics Smoothインジケーターは、RCI(順位相関指数)、CCI(商品チャンネル指数)、ストキャスティクスという3つの人気オシレーターを一つにまとめ、スムーズかつパフォーマンス最適化されたツールとして提供します。RCIの計算は複雑で、通常はラインを増やしたりスムージングを適用すると表示が遅くなったり、エラーが発生することがあります。このインジケーターでは、表示領域を時間軸に基づいて制限することで、機能性を損なうことなくスムーズなパフォーマンスを実現しています。
主な機能:
1. RCI(順位相関指数)
・複数期間の計算とスムージング: 8、10、20、30、52、60という6つの異なる期間のRCIを計算し、短期から長期までのトレンド分析が可能です。
・ダブルスムージング: RCIラインにダブルの指数移動平均(EMA)を適用し、ノイズを減らし読みやすくしています。
・動的な表示制限: パフォーマンス問題を防ぐため、現在の時間軸に基づいて表示領域を制限し、複数のスムーズなラインでも効率的な計算を可能にします。
2. CCI(商品チャンネル指数)
・固定ソースとEMA期間: CCIの計算には固定されたソース(終値)と固定されたEMA期間(3)を使用し、一貫性のあるスムージングを実現します。
・スムーズな出力: CCIにEMAを適用し、読み取りやすい滑らかなラインを生成します。
3. ストキャスティクス・オシレーター
・カスタマイズ可能なパラメータ: %K、%D、EMAスムージング期間を設定できます。
・スケーリング表示: ストキャスティクスの値をRCIやCCIで使用される-100から100のスケールに合わせ、比較しやすくしています。
・グラデーション塗りつぶし: 買われすぎ・売られすぎのレベル間にグラデーションの塗りつぶしを提供し、視覚的な解釈を強化します。
動作の仕組み:
パフォーマンスの最適化:
・表示制限: インジケーターは現在の時間軸に基づいて動的な表示制限(adjusted_limit)を計算します。この制限により、計算を行うバーの数を減らし、パフォーマンスを大幅に向上させます。
・時間ベースの計算: 現在の時間が計算されたstart_time内にある場合にのみ値を計算し、不要な計算でリソースを無駄にしないようにします。
スムージング技術:
・ダブルEMAスムージング: RCIラインにダブルのEMAを適用し、ボラティリティを減少させ、トレンドを明確にします。
・一貫したスムージング: CCIやストキャスティクスに固定されたEMA長を使用し、オシレーター間で一貫したスムージング効果を提供します。
使い方:
セットアップ:
インジケーターの追加: チャートに「RCI-CCI-Stochastics Smooth」インジケーターを適用します。
期間の設定: ご自身のトレード戦略に合わせて、RCI、CCI、ストキャスティクスの期間を調整します。
表示制限の理解: パフォーマンスを向上させるため、インジケーターは表示領域を制限しています。必要に応じて表示制限値パラメータを調整できます。
解釈:
・RCIライン: 複数のRCIラインを使用して、さまざまな時間枠での市場トレンドを評価します。スムーズなラインにより、トレンドの変化を見つけやすくなります。
・CCIライン: スムーズなCCIラインを監視し、買われすぎや売られすぎの状態を特定します。
・ストキャスティクス: スケーリングされたストキャスティクス・オシレーターを利用して、モメンタムや潜在的な反転ポイントを確認します。
ヒント:
・表示制限は慎重に調整: 表示制限を増やすとパフォーマンスに影響を与える可能性があります。ニーズに合ったバランスを見つけ、システムに負荷をかけないようにしましょう。
・他のインジケーターと組み合わせる: このインジケーターを価格アクションや他のテクニカル指標と組み合わせて、より堅牢な分析を行います。
注意事項と免責事項:
インジケーターの制限:
・パフォーマンスのトレードオフ: インジケーターは表示制限によってパフォーマンスを最適化していますが、極端に高い設定では依然として遅延やエラーが発生する可能性があります。
・データの正確性: データソースが信頼できることを確認し、インジケーターの精度を維持してください。
トレード責任:
・自己責任: このインジケーターはトレードの補助ツールであり、最終的な投資判断はご自身の責任で行ってください。
・リスク管理: 市場にはリスクが伴い、損失が発生する可能性があります。適切なリスク管理を行ってください。
まとめ:
RCI-CCI-Stochastics Smoothインジケーターは、複数のオシレーターを一つにまとめ、滑らかな表示で市場のモメンタムやトレンドを包括的に把握できます。パフォーマンスの最適化により、高度なスムージング技術や複数のラインを使用しても、システムの速度を損なったりエラーが発生したりしません。これは、通常のパフォーマンス上の欠点なしに詳細なテクニカル分析を求めるトレーダーにとって、貴重なツールとなります。
ابحث في النصوص البرمجية عن "CCI"

RSI-CCI Fusion StrategyRSI-CCI Fusion Strategy: Harnessing the Power of RSI and CCI
The "RSI-CCI Fusion Strategy" is a powerful trading approach that combines the strengths of the Relative Strength Index (RSI) and the Commodity Channel Index (CCI) to provide enhanced trading insights. This strategy is based on the popular "RSI & CCI Fusion + Alerts" indicator, which utilizes the RSI and CCI indicators from TradingView .
1. Overview of RSI and CCI:
The Relative Strength Index (RSI) is a widely used momentum oscillator that measures the speed and change of price movements. It helps traders identify overbought and oversold conditions in the market. On the other hand, the Commodity Channel Index (CCI) is a versatile indicator that identifies cyclical trends and provides insights into overbought and oversold levels.
2. The RSI-CCI Fusion Strategy:
The RSI-CCI Fusion Strategy harnesses the combined power of the RSI and CCI indicators to generate robust trading signals. By blending the RSI and CCI, this strategy captures both momentum and cyclical trend dynamics, offering a more comprehensive view of the market.
3. Utilizing the RSI-CCI Fusion Indicator + Alerts:
The "RSI & CCI Fusion + Alerts" indicator serves as the backbone of the RSI-CCI Fusion Strategy. It integrates the RSI and CCI indicators from TradingView, providing traders with a clear and actionable trading signal.
4. How it Works:
- The indicator calculates the RSI and CCI values, standardizes them using z-score, and combines them with a weighted fusion approach.
- The resulting RSI-CCI Fusion indicator is plotted on the chart, accompanied by dynamic upper and lower bands, which help identify potential overbought and oversold conditions.
- Traders can customize alerts based on their preferred thresholds and timeframes, enabling them to receive timely notifications for potential buy and sell signals.
5. Implementing the RSI-CCI Fusion Strategy:
Traders following the RSI-CCI Fusion Strategy can utilize the buy and sell signals generated by the RSI-CCI Fusion indicator. When the indicator crosses below the upper band, it may signal a potential selling opportunity. Conversely, when it crosses above the lower band, it may indicate a potential buying opportunity. Traders can also consider additional factors and technical analysis tools to validate the signals before making trading decisions.
Conclusion: The RSI-CCI Fusion Strategy provides traders with a robust approach to analyze the market and make well-informed trading decisions. By incorporating the RSI and CCI indicators through the "RSI & CCI Fusion + Alerts" indicator, traders can take advantage of the combined strengths of these indicators. However, it is important to remember that no strategy guarantees success, and traders should always practice risk management and conduct thorough analysis before executing trades using this strategy.
Disclaimer: Trading involves risks, and it is important to conduct your own research and consult with a financial advisor before making any investment decisions.
Note: The RSI-CCI Fusion Strategy serves as a general guide, and individual traders may have different preferences and trading styles.

Composite Indicator (CCI + ATR)Composite Indicator (CCI + ATR)
The Composite Indicator (CCI + ATR) combines the Commodity Channel Index (CCI) with the Average True Range (ATR) , providing traders with a dynamic tool for identifying entry and exit points based on momentum and volatility. This indicator is particularly useful for markets like cryptocurrencies, which often exhibit sharp sell-offs and gradual upward trends.
Key Features
Momentum Analysis with CCI: The CCI calculates price momentum by comparing the current price level to its average over a specific period. The indicator generates signals when CCI crosses predefined thresholds.
- Buy Signal: Triggered when CCI crosses above the lower threshold (e.g., -100).
- Sell Signal: Triggered when CCI crosses below the upper threshold (e.g., +100).
Volatility Filtering with ATR: The ATR measures market volatility, ensuring signals occur only during significant price movements.
Separate multipliers for buy and sell signals allow tailored filtering based on market behavior.
Stop Loss Calculation: Dynamic stop loss levels are calculated using the ATR multiplier to adapt to market volatility, offering better risk management.
How It Works
CCI Calculation: The CCI is calculated using the typical price ((High + Low + Close) / 3) and a user-defined length. It detects momentum changes by measuring deviations from the average price.
ATR Calculation: The ATR determines the average price range over a specified period, identifying the market’s volatility. The ATR SMA acts as a baseline to filter signals.
Buy Signal: A buy signal is triggered when:
- CCI crosses above the lower threshold (e.g., -100).
- ATR exceeds its SMA multiplied by the buy multiplier (e.g., 1.0).
Sell Signal: A sell signal is triggered when:
- CCI crosses below the upper threshold (e.g., +100).
- ATR exceeds its SMA multiplied by the sell multiplier (e.g., 0.95).
Stop Loss Integration:
- Long positions: Stop loss = Low – (ATR * ATR Multiplier)
- Short positions: Stop loss = High + (ATR * ATR Multiplier)
Advantages
Combines momentum (CCI) and volatility (ATR) for precise signal generation.
Customizable thresholds and multipliers for different market conditions.
Dynamic stop loss ensures better risk management in volatile markets.
Suggested Parameter Settings
CCI Length: 20 (default). Adjust as follows:
- 10–15: Shorter timeframes (e.g., 5-15 minutes).
- 20: General use for 1-hour timeframes.
- 30–50: Longer timeframes (e.g., 4-hour or daily charts).
CCI Threshold: 100 (default). Adjust as follows:
- 50–75: For more frequent signals in ranging markets.
- 100: Balanced for most trading conditions.
- 150–200: For strong trends to reduce noise.
ATR Length: 14 (default). Adjust as follows:
- 10–14: For assets with moderate volatility.
- 20: For assets with lower volatility.
ATR Buy Multiplier: 1.0 (default). Adjust as follows:
- 0.9–1.0: For gradual uptrends in crypto markets.
- 1.1–1.2: For stronger trend filtering.
ATR Sell Multiplier: 0.95 (default). Adjust as follows:
- 0.8–0.95: For sharp sell-offs.
- 1.0–1.1: For stable downward trends.
ATR Multiplier (Stop Loss): 1.5 (default). Adjust as follows:
- 1.0–1.2: For shorter timeframes or less volatile markets.
- 2.0–2.5: For highly volatile markets like cryptocurrencies.
Example Use Cases
Scalping (5-15 minute charts): Use CCI Length = 10, CCI Threshold = 75, ATR Buy Multiplier = 0.9, ATR Sell Multiplier = 0.8.
Day Trading (1-hour charts): Use CCI Length = 20, CCI Threshold = 100, ATR Buy Multiplier = 1.0, ATR Sell Multiplier = 0.95.
Swing Trading (4-hour or daily charts): Use CCI Length = 30, CCI Threshold = 150, ATR Buy Multiplier = 1.2, ATR Sell Multiplier = 1.0.
Final Thoughts The Composite Indicator (CCI + ATR) is a versatile tool designed to enhance trading decisions by combining momentum analysis with volatility filtering. Whether scalping or swing trading, this indicator provides actionable insights and robust risk management to navigate complex markets effectively.

Triple CCI Strategy MFI Confirmed [Skyrexio]Overview
Triple CCI Strategy MFI Confirmed leverages 3 different periods Commodity Channel Index (CCI) indicator in conjunction Money Flow Index (MFI) and Exponential Moving Average (EMA) to obtain the high probability setups. Fast period CCI is used for having the high probability to enter in the direction of short term trend, middle and slow period CCI are used for confirmation, if market now likely in the mid and long-term uptrend. MFI is used to confirm trade with the money inflow/outflow with the high probability. EMA is used as an additional trend filter. Moreover, strategy uses exponential moving average (EMA) to trail the price when it reaches the specific level. More information in "Methodology" and "Justification of Methodology" paragraphs. The strategy opens only long trades.
Unique Features
Dynamic stop-loss system: Instead of fixed stop-loss level strategy utilizes average true range (ATR) multiplied by user given number subtracted from the position entry price as a dynamic stop loss level.
Configurable Trading Periods: Users can tailor the strategy to specific market windows, adapting to different market conditions.
Four layers trade filtering system: Strategy utilizes two different period CCI indicators, MFI and EMA indicators to confirm the signals produced by fast period CCI.
Trailing take profit level: After reaching the trailing profit activation level scrip activate the trailing of long trade using EMA. More information in methodology.
Methodology
The strategy opens long trade when the following price met the conditions:
Fast period CCI shall crossover the zero-line.
Slow and Middle period CCI shall be above zero-lines.
Price shall close above the EMA. Crossover is not obligatory
MFI shall be above 50
When long trade is executed, strategy set the stop-loss level at the price ATR multiplied by user-given value below the entry price. This level is recalculated on every next candle close, adjusting to the current market volatility.
At the same time strategy set up the trailing stop validation level. When the price crosses the level equals entry price plus ATR multiplied by user-given value script starts to trail the price with EMA. If price closes below EMA long trade is closed. When the trailing starts, script prints the label “Trailing Activated”.
Strategy settings
In the inputs window user can setup the following strategy settings:
ATR Stop Loss (by default = 1.75)
ATR Trailing Profit Activation Level (by default = 2.25)
CCI Fast Length (by default = 14, used for calculation short term period CCI)
CCI Middle Length (by default = 25, used for calculation short term period CCI)
CCI Slow Length (by default = 50, used for calculation long term period CCI)
MFI Length (by default = 14, used for calculation MFI
EMA Length (by default = 50, period of EMA, used for trend filtering EMA calculation)
Trailing EMA Length (by default = 20)
User can choose the optimal parameters during backtesting on certain price chart.
Justification of Methodology
Before understanding why this particular combination of indicator has been chosen let's briefly explain what is CCI, MFI and EMA.
The Commodity Channel Index (CCI) is a momentum-based technical indicator that measures the deviation of a security's price from its average price over a specific period. It helps traders identify overbought or oversold conditions and potential trend reversals.
The CCI formula is:
CCI = (Typical Price − SMA) / (0.015 × Mean Deviation)
Typical Price (TP): This is calculated as the average of the high, low, and closing prices for the period.
Simple Moving Average (SMA): This is the average of the Typical Prices over a specific number of periods.
Mean Deviation: This is the average of the absolute differences between the Typical Price and the SMA.
The result is a value that typically fluctuates between +100 and -100, though it is not bounded and can go higher or lower depending on the price movement.
The Money Flow Index (MFI) is a technical indicator that measures the strength of money flowing into and out of a security. It combines price and volume data to assess buying and selling pressure and is often used to identify overbought or oversold conditions. The formula for MFI involves several steps:
1. Calculate the Typical Price (TP):
TP = (high + low + close) / 3
2. Calculate the Raw Money Flow (RMF):
Raw Money Flow = TP × Volume
3. Determine Positive and Negative Money Flow:
If the current TP is greater than the previous TP, it's Positive Money Flow.
If the current TP is less than the previous TP, it's Negative Money Flow.
4. Calculate the Money Flow Ratio (MFR):
Money Flow Ratio = Sum of Positive Money Flow (over n periods) / Sum of Negative Money Flow (over n periods)
5. Calculate the Money Flow Index (MFI):
MFI = 100 − (100 / (1 + Money Flow Ratio))
MFI above 80 can be considered as overbought, below 20 - oversold.
The Exponential Moving Average (EMA) is a type of moving average that places greater weight and significance on the most recent data points. It is widely used in technical analysis to smooth price data and identify trends more quickly than the Simple Moving Average (SMA).
Formula:
1. Calculate the multiplier
Multiplier = 2 / (n + 1) , Where n is the number of periods.
2. EMA Calculation
EMA = (Current Price) × Multiplier + (Previous EMA) × (1 − Multiplier)
This strategy leverages Fast period CCI, which shall break the zero line to the upside to say that probability of short term trend change to the upside increased. This zero line crossover shall be confirmed by the Middle and Slow periods CCI Indicators. At the moment of breakout these two CCIs shall be above 0, indicating that there is a high probability that price is in middle and long term uptrend. This approach increases chances to have a long trade setup in the direction of mid-term and long-term trends when the short-term trend starts to reverse to the upside.
Additionally strategy uses MFI to have a greater probability that fast CCI breakout is confirmed by this indicator. We consider the values of MFI above 50 as a higher probability that trend change from downtrend to the uptrend is real. Script opens long trades only if MFI is above 50. As you already know from the MFI description, it incorporates volume in its calculation, therefore we have another one confirmation factor.
Finally, strategy uses EMA an additional trend filter. It allows to open long trades only if price close above EMA (by default 50 period). It increases the probability of taking long trades only in the direction of the trend.
ATR is used to adjust the strategy risk management to the current market volatility. If volatility is low, we don’t need the large stop loss to understand the there is a high probability that we made a mistake opening the trade. User can setup the settings ATR Stop Loss and ATR Trailing Profit Activation Level to realize his own risk to reward preferences, but the unique feature of a strategy is that after reaching trailing profit activation level strategy is trying to follow the trend until it is likely to be finished instead of using fixed risk management settings. It allows sometimes to be involved in the large movements. It’s also important to make a note, that script uses another one EMA (by default = 20 period) as a trailing profit level.
Backtest Results
Operating window: Date range of backtests is 2022.04.01 - 2024.11.25. It is chosen to let the strategy to close all opened positions.
Commission and Slippage: Includes a standard Binance commission of 0.1% and accounts for possible slippage over 5 ticks.
Initial capital: 10000 USDT
Percent of capital used in every trade: 50%
Maximum Single Position Loss: -4.13%
Maximum Single Profit: +19.66%
Net Profit: +5421.21 USDT (+54.21%)
Total Trades: 108 (44.44% win rate)
Profit Factor: 2.006
Maximum Accumulated Loss: 777.40 USDT (-7.77%)
Average Profit per Trade: 50.20 USDT (+0.85%)
Average Trade Duration: 44 hours
These results are obtained with realistic parameters representing trading conditions observed at major exchanges such as Binance and with realistic trading portfolio usage parameters.
How to Use
Add the script to favorites for easy access.
Apply to the desired timeframe and chart (optimal performance observed on 2h BTC/USDT).
Configure settings using the dropdown choice list in the built-in menu.
Set up alerts to automate strategy positions through web hook with the text: {{strategy.order.alert_message}}
Disclaimer:
Educational and informational tool reflecting Skyrex commitment to informed trading. Past performance does not guarantee future results. Test strategies in a simulated environment before live implementation

Trend CCITrend CCI (TCCI) Indicator
Description:
The Trend CCI (TCCI) indicator is a unique combination of the Commodity Channel Index (CCI) and the Average True Range (ATR), designed to identify trends and market reversals with a refined sensitivity to price volatility. The indicator plots the CCI, adjusted by an ATR filter, and color-codes the trendline to signal uptrends and downtrends.
How It Works:
This indicator uses the CCI to measure price momentum and an ATR-based filter to smooth out market noise, making it easier to detect significant shifts in the market trend. Key parameters such as the ATR Period, ATR Multiplier, and CCI Period have been carefully chosen to optimize the indicator's performance:
1. ATR Period (default: 18)
The ATR Period determines the number of periods used to calculate the **Average True Range**, which reflects market volatility. In this case, an **ATR Period of 18** has been selected for several reasons:
Balance between responsiveness and noise reduction : A period of 18 strikes a balance between being responsive to recent price movements and filtering out minor fluctuations. Shorter ATR periods might be too reactive, creating false signals, while longer periods might miss shorter-term trends.
Adaptable to various market conditions : An 18-period ATR is suitable for both intraday and swing trading strategies, making it versatile across different time frames.
Standard industry practice : Many traders use ATR settings between 14 and 20 periods as a convention for detecting reliable volatility levels.
2. ATR Multiplier (default: 1.5)
The ATR Multiplier is applied to the ATR value to define how sensitive the indicator is to volatility. In this case, a multiplier of 1.5 has been chosen:
Avoiding whipsaws in low volatility markets: By setting the multiplier to 1.5, the indicator filters out smaller, less significant price movements, reducing the likelihood of whipsaw signals (i.e., false trend reversals during periods of low volatility).
Optimizing signal accuracy: A moderate multiplier like 1.5 ensures that the indicator only generates signals when the price moves a significant distance from the average range. Higher multipliers (e.g., 2.0) may ignore valid opportunities, while lower multipliers (e.g., 1.0) might create too many signals.
Enhancing trend clarity : The multiplier’s role in widening the range allows the indicator to respond more clearly during periods of strong trends, reducing signal noise and false positives.
3. CCI Period (default: 63)
The CCI Period defines the number of periods used to calculate the Commodity Channel Index. A 63-period CCI is selected based on the following considerations:
Smoothing the momentum calculation: A longer period, such as 63, is used to smooth out the CCI and reduce the effects of short-term price fluctuations. This period captures longer-term momentum, making it ideal for identifying more significant market trends.
-Filtering out short-term noise: While shorter CCI periods (e.g., 14 or 20) may be more reactive, they tend to produce more signals, some of which may be false. A 63-period CCI focuses on stronger and more sustained price movements, providing fewer but higher-quality signals.
Adapted to intermediate trading: A 63-period CCI aligns well with traders looking for medium-term trend-following strategies, striking a balance between long-term trend identification and responsiveness to significant price shifts.
How to Use:
Green Area: When the trendline turns green, it signals that the CCI is positive, reflecting upward momentum. This can be interpreted as a buy signal, indicating the potential for long positions or continuing bullish trades.
Red Area: When the trendline turns red, it signals that the CCI is negative, reflecting downward momentum. This can be interpreted as a sell signal, indicating potential short positions or bearish trades.
ATR Filter: The ATR helps reduce false signals by ignoring minor price movements. Traders can adjust the ATR Multiplier to make the indicator more or less sensitive based on market conditions. A lower multiplier (e.g., 1.2) may increase signal frequency, while a higher multiplier (e.g., 2.0) reduces it.
Originality:
The Trend CCI (TCCI) stands out due to its combination of the CCI and ATR. While many indicators simply plot raw CCI values, this script enhances the CCI’s effectiveness by incorporating an ATR-based volatility filter. This ensures that only significant trends trigger signals, making it a more reliable tool in volatile markets. The choice of the ATR period, multiplier, and CCI period ensures a refined balance between trend detection and noise reduction, distinguishing it as a powerful trend-following indicator.
Additionally, the visual aspect—using color-coded trendlines that dynamically shift between green and red—simplifies the interpretation of market trends, offering traders a clear and immediate understanding of trend direction and momentum strength.
Final Recommendations:
Use in Trending Markets The TCCI is most effective in trending markets, where its signals align with broader market momentum. In sideways or low-volatility markets, consider adjusting the ATR multiplier or using other complementary indicators to confirm the signals.
Risk Management: Always integrate robust risk management practices, such as using stop-loss orders and position sizing, to protect against sudden market reversals or periods of heightened volatility.
Adjust for Volatility: Consider the volatility of the asset being traded. In highly volatile assets, a higher ATR multiplier (e.g., 2.0) may be necessary to filter out noise, while in more stable assets, a lower multiplier (e.g., 1.2) might generate earlier signals.
By using the Trend CCI (TCCI) indicator with a deeper understanding of its key parameters, traders can better identify trends, reduce noise, and improve their overall decision-making in the markets.
Good Profits!

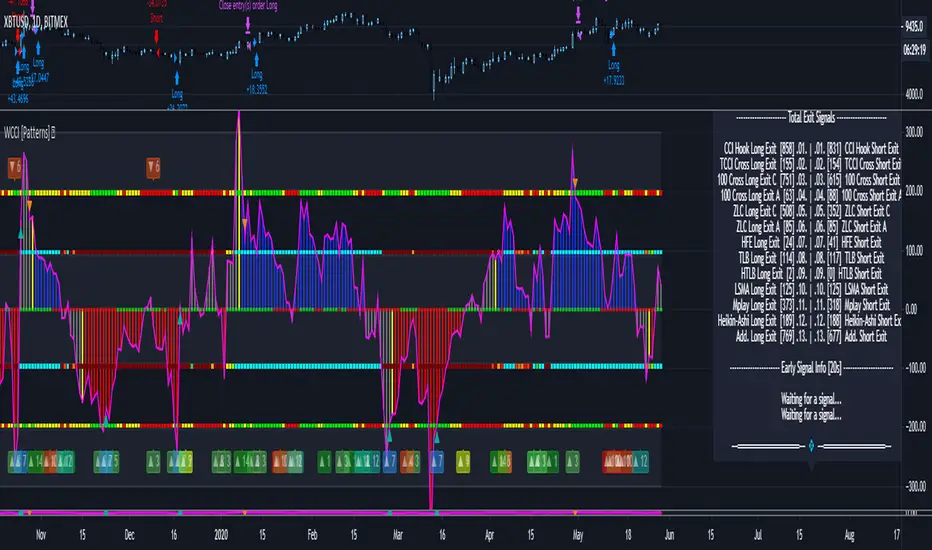
Woodies CCI Trading System - Patterns - Strategy TesterWoodies CCI Trading System - Patterns (Strategy Tester Mode) .
The Woodies CCI was initially designed for trading Stocks, Options and the Future Market.
However, different styles of traders can make use of it in various markets and any chart timeframes.
The Woodies CCI Trading System - Patterns takes a Strategy Builder like approach and can be easily configured to scan simultaneously for any available pattern.
The purpose of this tool is to compress everything down to 1 alert to warn of any opportunities, and it can also be automated .
To further improve the success rate , the patterns' performance can be studied with the help of the Strategy Tester .
The Strategy Tester Mode allows for instant backtesting on historical data.
It can assist in determining the right combination of patterns and exit rules , and it can help decide which patterns are better for which market.
The Alert Mode can be found on this page Woodies-CCI Trading System - Patterns (Alert Mode) .
This trading system contains all the particular features as described by Woodie, and more.
▪ Pattern Recognition (entry signals based on well-defined patterns)
- Trade patterns that are in agreement with the established trend
1. Zero-Line Reject (ZLR)
2. Trend Line Break (TLB) - with the trend
3. Horizontal Trend Line Break (HTLB) - with the trend
4. Tony Trade (TT)
5. GB100 (GB)
6. Reverse Divergence (RD)
- Trade patterns that are against the trend (these patterns indicate the possibility of a change in trend direction and are recommended for experienced traders)
1. Shamu Trade (ST)
2. The Famir Trade (FT)
3. Vegas Trade (VT)
4. Ghost Trade (GT)
5. Hook From Extreme (HFE)
6. Trend Line Break (TLB) - counter-trend
7. Horizontal Trend Line Break (HTLB) - counter-trend
▪ Exit rules
1. CCI Trend Line Breaks
2. CCI crossing back through the 100 lines
3. TCCI hooking or going flat, not moving, or no progress
4. CCI hook from extremes
5. Profit target hit
6. CCI forming a flat top formation
7. CCI crossing a Horizontal Trend Line
8. When the LSMA disagrees with the trade
9. CCI crossing the Zero-Line (ZL)
▪ WCCI Histogram coloring based on Woodie's trend definition
- Blue for Uptrend
- Red for Downtrend
- Gray for No Trend
- Yellow for trend establishment
▪ The LSMA is on the Zero-Line - it is the 25 period Least Squares Moving Average (it shows the ZL as a series of red and green segments)
- Red segments - the market price is below LSMA
- Green segments - the market price is above LSMA
▪ Chop Zone Indicator (CZI) - Positioned on the levels +100 and -100 (it shows market direction)
- Cyan shows up market
- Brown shows down market
- Multiple colors show market in a sideways mode
▪ Sidewinder Indicator (SI) - Positioned on the levels +200 and -200
- Red shows a flat or non-trending market
- Yellow shows a trending market
- Green shows a strong trending market
▪ The Woodies CCI (14) is indicated with the fuchsia color
▪ WCCI length auto-change to 20 on 1-hour chart intervals and higher
▪ The Turbo CCI (6) has a dark red color
▪ TWCCI auto-hide on 1-hour chart intervals and higher
▪ Early Alert Functionality available (eg 20 seconds before the signal is considered valid)
▪ Simplified Alerts
- An all in one alert
- Alerts for entry triggers
- Alerts for exit conditions
▪ Some Pattern Statistics are available on the chart in a panel
Simple Steps to set it up:
1 - Choose at least 1 pattern ( with-the-trend patterns are friendlier than the counter-trend ones)
2 - Choose at least 1 exit condition
3 - Set the alerts (1 for Entry and 1 for Exit, or 1 alert running for both Entry and Exit)
For Beginners:
For the new trader, the trend continuation patterns are easier to manage.
Newcomers should stick to trend-following patterns until they feel very confident!
Here are Three Entry Choices:
1 - Conservative -
Wait until the bar closes to enter - This is the easiest to execute.
2 - Conservative to Aggressive -
Woodie would like the beginner to enter the market if, with 20 seconds left in the bar, a valid CCI pattern presents itself.
3 - Very Aggressive -
Enter trade as soon as the bar indicates a signal during price bar formation. This is for experienced traders, as the signal conditions are final at the close of the bar and the intra-bar changes are not recorded.
Your implicit learned skills are put to the test here. Be fair to yourself and allow yourself time to grow and improve your skills.
You are strongly urged to follow the Option 2.
Money Management: Apply an Initial Protective Stop; Use Trade Exits; Study the past performance - Statistics (Strategy Tester Mode).
Related Tools:
Woodies-CCI Trading System - Patterns - Alerts
Risk Management System (Stop Loss, Take Profit, Trailing Stop Loss, Trailing Take Profit) - it can be connected to the Woodies-CCI Trading System - Patterns - Alerts
Early/Delayed Signal Explained
RSI-CCI Fusion + AlertsThe "RSI-CCI Fusion" indicator combines the Relative Strength Index (RSI) and Commodity Channel Index (CCI) from TradingView.
RSI-CCI Fusion: Unlocking Synergies in Technical Analysis
Technical analysis plays a crucial role in understanding market dynamics and making informed trading decisions. I often rely on a combination of indicators to gain insights into price movements and identify potential trade opportunities. In the lines below, I will explore the "RSI-CCI Fusion" indicator, a powerful tool that combines the strengths of the Relative Strength Index (RSI) and the Commodity Channel Index (CCI) to provide enhanced trading insights.
1. Understanding the RSI and CCI Indicators
Before delving into the fusion of these indicators, let's briefly review their individual characteristics. The RSI is a widely used momentum oscillator that measures the speed and change of price movements. It oscillates between 0 and 100, with readings above 70 indicating overbought conditions and readings below 30 indicating oversold conditions.
On the other hand, the CCI is a versatile indicator designed to identify cyclical trends in prices. It measures the distance between the price and its statistical average, thereby providing valuable insights into overbought and oversold levels.
2. The Concept of RSI-CCI Fusion
The RSI-CCI Fusion indicator is born out of my desire to harness the collective power of the RSI and CCI. By combining these indicators, I can benefit from a more comprehensive trading signal that captures both momentum and cyclical trend dynamics.
The fusion process involves assigning weights to the RSI and CCI, creating a blended indicator that reflects their relative importance. The weighted combination ensures that both indicators contribute meaningfully to the final result.
To maintain consistency, the RSI and CCI values are standardized using the z-score technique. This normalization process brings the values to a common scale, making them directly comparable. Rescaling is then applied to bring the combined indicator back to its original scale, facilitating intuitive interpretation.
3. Interpreting the RSI-CCI Fusion Indicator
When plotting the RSI-CCI Fusion indicator on a chart, I gain valuable insights into market dynamics and potential trading opportunities. The indicator's plot typically includes dynamic upper and lower bands, which are calculated based on the indicator's standard deviation. These bands provide boundaries for evaluating overbought and oversold conditions.
When the RSI-CCI Fusion indicator crosses above the lower band, it suggests oversold conditions and potential buying opportunities. Conversely, when the indicator crosses below the upper band, it indicates overbought conditions and potential selling opportunities. I also pay attention to the baseline, which represents the neutral level and may signal potential trend reversals.
4. Utilizing Alerts for Trading Decisions
The RSI-CCI Fusion indicator can be further enhanced by incorporating alerts. These alerts notify me when the indicator generates buy or sell signals, enabling me to take prompt action. I can customize the alerts based on my preferred thresholds and timeframes.
However, it is crucial to remember that the RSI-CCI Fusion indicator should not be relied upon in isolation. To increase the robustness of my trading decisions, it is recommended to combine the indicator with other analysis techniques such as trend lines, support and resistance levels, or additional indicators. This convergence of analysis methodologies enhances the overall accuracy of my trade signals.
Conclusion: The RSI-CCI Fusion indicator represents a compelling approach to technical analysis by synergizing the strengths of the RSI and CCI. By combining momentum and cyclical trend dynamics, I gain a more comprehensive view of market conditions. The fusion of these indicators, accompanied by timely alerts, equips me with valuable insights and facilitates well-informed trading decisions.
As with any technical analysis tool, it is essential for me to backtest the RSI-CCI Fusion indicator to evaluate its performance across different market conditions and timeframes. Additionally, applying proper risk management strategies is crucial to ensure consistent and disciplined trading practices.

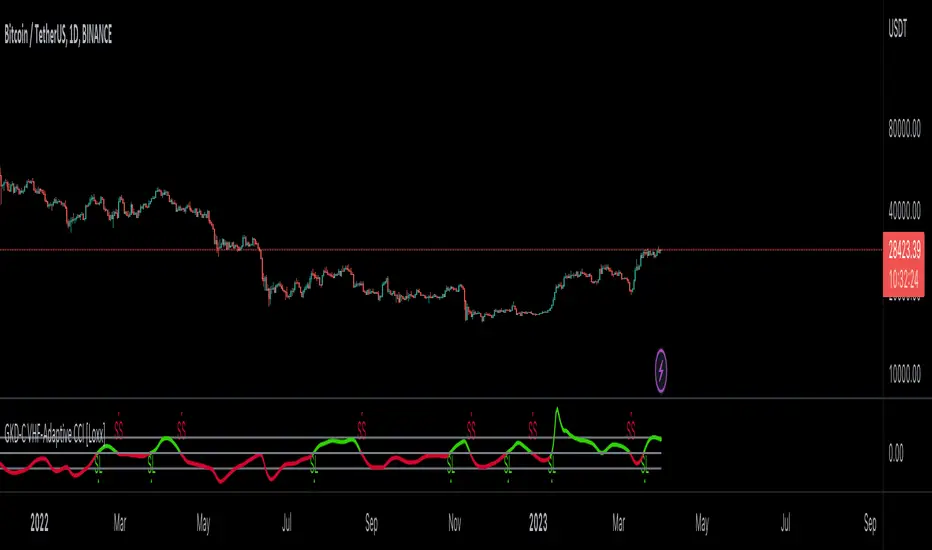
GKD-C VHF-Adaptive CCI [Loxx]Giga Kaleidoscope GKD-C VHF-Adaptive CCI is a Confirmation module included in Loxx's "Giga Kaleidoscope Modularized Trading System".
█ Giga Kaleidoscope Modularized Trading System
What is Loxx's "Giga Kaleidoscope Modularized Trading System"?
The Giga Kaleidoscope Modularized Trading System is a trading system built on the philosophy of the NNFX (No Nonsense Forex) algorithmic trading.
What is the NNFX algorithmic trading strategy?
The NNFX (No-Nonsense Forex) trading system is a comprehensive approach to Forex trading that is designed to simplify the process and remove the confusion and complexity that often surrounds trading. The system was developed by a Forex trader who goes by the pseudonym "VP" and has gained a significant following in the Forex community.
The NNFX trading system is based on a set of rules and guidelines that help traders make objective and informed decisions. These rules cover all aspects of trading, including market analysis, trade entry, stop loss placement, and trade management.
Here are the main components of the NNFX trading system:
1. Trading Philosophy: The NNFX trading system is based on the idea that successful trading requires a comprehensive understanding of the market, objective analysis, and strict risk management. The system aims to remove subjective elements from trading and focuses on objective rules and guidelines.
2. Technical Analysis: The NNFX trading system relies heavily on technical analysis and uses a range of indicators to identify high-probability trading opportunities. The system uses a combination of trend-following and mean-reverting strategies to identify trades.
3. Market Structure: The NNFX trading system emphasizes the importance of understanding the market structure, including price action, support and resistance levels, and market cycles. The system uses a range of tools to identify the market structure, including trend lines, channels, and moving averages.
4. Trade Entry: The NNFX trading system has strict rules for trade entry. The system uses a combination of technical indicators to identify high-probability trades, and traders must meet specific criteria to enter a trade.
5. Stop Loss Placement: The NNFX trading system places a significant emphasis on risk management and requires traders to place a stop loss order on every trade. The system uses a combination of technical analysis and market structure to determine the appropriate stop loss level.
6. Trade Management: The NNFX trading system has specific rules for managing open trades. The system aims to minimize risk and maximize profit by using a combination of trailing stops, take profit levels, and position sizing.
Overall, the NNFX trading system is designed to be a straightforward and easy-to-follow approach to Forex trading that can be applied by traders of all skill levels.
Core components of an NNFX algorithmic trading strategy
The NNFX algorithm is built on the principles of trend, momentum, and volatility. There are six core components in the NNFX trading algorithm:
1. Volatility - price volatility; e.g., Average True Range, True Range Double, Close-to-Close, etc.
2. Baseline - a moving average to identify price trend
3. Confirmation 1 - a technical indicator used to identify trends
4. Confirmation 2 - a technical indicator used to identify trends
5. Continuation - a technical indicator used to identify trends
6. Volatility/Volume - a technical indicator used to identify volatility/volume breakouts/breakdown
7. Exit - a technical indicator used to determine when a trend is exhausted
What is Volatility in the NNFX trading system?
In the NNFX (No Nonsense Forex) trading system, ATR (Average True Range) is typically used to measure the volatility of an asset. It is used as a part of the system to help determine the appropriate stop loss and take profit levels for a trade. ATR is calculated by taking the average of the true range values over a specified period.
True range is calculated as the maximum of the following values:
-Current high minus the current low
-Absolute value of the current high minus the previous close
-Absolute value of the current low minus the previous close
ATR is a dynamic indicator that changes with changes in volatility. As volatility increases, the value of ATR increases, and as volatility decreases, the value of ATR decreases. By using ATR in NNFX system, traders can adjust their stop loss and take profit levels according to the volatility of the asset being traded. This helps to ensure that the trade is given enough room to move, while also minimizing potential losses.
Other types of volatility include True Range Double (TRD), Close-to-Close, and Garman-Klass
What is a Baseline indicator?
The baseline is essentially a moving average, and is used to determine the overall direction of the market.
The baseline in the NNFX system is used to filter out trades that are not in line with the long-term trend of the market. The baseline is plotted on the chart along with other indicators, such as the Moving Average (MA), the Relative Strength Index (RSI), and the Average True Range (ATR).
Trades are only taken when the price is in the same direction as the baseline. For example, if the baseline is sloping upwards, only long trades are taken, and if the baseline is sloping downwards, only short trades are taken. This approach helps to ensure that trades are in line with the overall trend of the market, and reduces the risk of entering trades that are likely to fail.
By using a baseline in the NNFX system, traders can have a clear reference point for determining the overall trend of the market, and can make more informed trading decisions. The baseline helps to filter out noise and false signals, and ensures that trades are taken in the direction of the long-term trend.
What is a Confirmation indicator?
Confirmation indicators are technical indicators that are used to confirm the signals generated by primary indicators. Primary indicators are the core indicators used in the NNFX system, such as the Average True Range (ATR), the Moving Average (MA), and the Relative Strength Index (RSI).
The purpose of the confirmation indicators is to reduce false signals and improve the accuracy of the trading system. They are designed to confirm the signals generated by the primary indicators by providing additional information about the strength and direction of the trend.
Some examples of confirmation indicators that may be used in the NNFX system include the Bollinger Bands, the MACD (Moving Average Convergence Divergence), and the Stochastic Oscillator. These indicators can provide information about the volatility, momentum, and trend strength of the market, and can be used to confirm the signals generated by the primary indicators.
In the NNFX system, confirmation indicators are used in combination with primary indicators and other filters to create a trading system that is robust and reliable. By using multiple indicators to confirm trading signals, the system aims to reduce the risk of false signals and improve the overall profitability of the trades.
What is a Continuation indicator?
In the NNFX (No Nonsense Forex) trading system, a continuation indicator is a technical indicator that is used to confirm a current trend and predict that the trend is likely to continue in the same direction. A continuation indicator is typically used in conjunction with other indicators in the system, such as a baseline indicator, to provide a comprehensive trading strategy.
What is a Volatility/Volume indicator?
Volume indicators, such as the On Balance Volume (OBV), the Chaikin Money Flow (CMF), or the Volume Price Trend (VPT), are used to measure the amount of buying and selling activity in a market. They are based on the trading volume of the market, and can provide information about the strength of the trend. In the NNFX system, volume indicators are used to confirm trading signals generated by the Moving Average and the Relative Strength Index. Volatility indicators include Average Direction Index, Waddah Attar, and Volatility Ratio. In the NNFX trading system, volatility is a proxy for volume and vice versa.
By using volume indicators as confirmation tools, the NNFX trading system aims to reduce the risk of false signals and improve the overall profitability of trades. These indicators can provide additional information about the market that is not captured by the primary indicators, and can help traders to make more informed trading decisions. In addition, volume indicators can be used to identify potential changes in market trends and to confirm the strength of price movements.
What is an Exit indicator?
The exit indicator is used in conjunction with other indicators in the system, such as the Moving Average (MA), the Relative Strength Index (RSI), and the Average True Range (ATR), to provide a comprehensive trading strategy.
The exit indicator in the NNFX system can be any technical indicator that is deemed effective at identifying optimal exit points. Examples of exit indicators that are commonly used include the Parabolic SAR, the Average Directional Index (ADX), and the Chandelier Exit.
The purpose of the exit indicator is to identify when a trend is likely to reverse or when the market conditions have changed, signaling the need to exit a trade. By using an exit indicator, traders can manage their risk and prevent significant losses.
In the NNFX system, the exit indicator is used in conjunction with a stop loss and a take profit order to maximize profits and minimize losses. The stop loss order is used to limit the amount of loss that can be incurred if the trade goes against the trader, while the take profit order is used to lock in profits when the trade is moving in the trader's favor.
Overall, the use of an exit indicator in the NNFX trading system is an important component of a comprehensive trading strategy. It allows traders to manage their risk effectively and improve the profitability of their trades by exiting at the right time.
How does Loxx's GKD (Giga Kaleidoscope Modularized Trading System) implement the NNFX algorithm outlined above?
Loxx's GKD v1.0 system has five types of modules (indicators/strategies). These modules are:
1. GKD-BT - Backtesting module (Volatility, Number 1 in the NNFX algorithm)
2. GKD-B - Baseline module (Baseline and Volatility/Volume, Numbers 1 and 2 in the NNFX algorithm)
3. GKD-C - Confirmation 1/2 and Continuation module (Confirmation 1/2 and Continuation, Numbers 3, 4, and 5 in the NNFX algorithm)
4. GKD-V - Volatility/Volume module (Confirmation 1/2, Number 6 in the NNFX algorithm)
5. GKD-E - Exit module (Exit, Number 7 in the NNFX algorithm)
(additional module types will added in future releases)
Each module interacts with every module by passing data between modules. Data is passed between each module as described below:
GKD-B => GKD-V => GKD-C(1) => GKD-C(2) => GKD-C(Continuation) => GKD-E => GKD-BT
That is, the Baseline indicator passes its data to Volatility/Volume. The Volatility/Volume indicator passes its values to the Confirmation 1 indicator. The Confirmation 1 indicator passes its values to the Confirmation 2 indicator. The Confirmation 2 indicator passes its values to the Continuation indicator. The Continuation indicator passes its values to the Exit indicator, and finally, the Exit indicator passes its values to the Backtest strategy.
This chaining of indicators requires that each module conform to Loxx's GKD protocol, therefore allowing for the testing of every possible combination of technical indicators that make up the six components of the NNFX algorithm.
What does the application of the GKD trading system look like?
Example trading system:
Backtest: Strategy with 1-3 take profits, trailing stop loss, multiple types of PnL volatility, and 2 backtesting styles
Baseline: Hull Moving Average
Volatility/Volume: Hurst Exponent
Confirmation 1: VHF-Adaptive CCI as shown on the chart above
Confirmation 2: Williams Percent Range
Continuation: Fisher Transform
Exit: Rex Oscillator
Each GKD indicator is denoted with a module identifier of either: GKD-BT, GKD-B, GKD-C, GKD-V, or GKD-E. This allows traders to understand to which module each indicator belongs and where each indicator fits into the GKD protocol chain.
Giga Kaleidoscope Modularized Trading System Signals (based on the NNFX algorithm)
Standard Entry
1. GKD-C Confirmation 1 Signal
2. GKD-B Baseline agrees
3. Price is within a range of 0.2x Volatility and 1.0x Volatility of the Goldie Locks Mean
4. GKD-C Confirmation 2 agrees
5. GKD-V Volatility/Volume agrees
Baseline Entry
1. GKD-B Baseline signal
2. GKD-C Confirmation 1 agrees
3. Price is within a range of 0.2x Volatility and 1.0x Volatility of the Goldie Locks Mean
4. GKD-C Confirmation 2 agrees
5. GKD-V Volatility/Volume agrees
6. GKD-C Confirmation 1 signal was less than 7 candles prior
Continuation Entry
1. Standard Entry, Baseline Entry, or Pullback; entry triggered previously
2. GKD-B Baseline hasn't crossed since entry signal trigger
3. GKD-C Confirmation Continuation Indicator signals
4. GKD-C Confirmation 1 agrees
5. GKD-B Baseline agrees
6. GKD-C Confirmation 2 agrees
1-Candle Rule Standard Entry
1. GKD-C Confirmation 1 signal
2. GKD-B Baseline agrees
3. Price is within a range of 0.2x Volatility and 1.0x Volatility of the Goldie Locks Mean
Next Candle:
1. Price retraced (Long: close < close or Short: close > close )
2. GKD-B Baseline agrees
3. GKD-C Confirmation 1 agrees
4. GKD-C Confirmation 2 agrees
5. GKD-V Volatility/Volume agrees
1-Candle Rule Baseline Entry
1. GKD-B Baseline signal
2. GKD-C Confirmation 1 agrees
3. Price is within a range of 0.2x Volatility and 1.0x Volatility of the Goldie Locks Mean
4. GKD-C Confirmation 1 signal was less than 7 candles prior
Next Candle:
1. Price retraced (Long: close < close or Short: close > close )
2. GKD-B Baseline agrees
3. GKD-C Confirmation 1 agrees
4. GKD-C Confirmation 2 agrees
5. GKD-V Volatility/Volume Agrees
PullBack Entry
1. GKD-B Baseline signal
2. GKD-C Confirmation 1 agrees
3. Price is beyond 1.0x Volatility of Baseline
Next Candle:
1. Price is within a range of 0.2x Volatility and 1.0x Volatility of the Goldie Locks Mean
3. GKD-C Confirmation 1 agrees
4. GKD-C Confirmation 2 agrees
5. GKD-V Volatility/Volume Agrees
█ GKD-C VHF-Adaptive CCI
What is CCI?
CCI (Commodity Channel Index) is a popular technical analysis tool used by traders to identify potential trend reversals, overbought and oversold conditions, and trading opportunities in various financial markets such as stocks, commodities, currencies, and bonds.
The CCI indicator is a momentum oscillator that measures the difference between the current price of an asset and its historical average price over a given period of time. The CCI calculation involves subtracting the typical price of an asset from its simple moving average (SMA), and then dividing the result by a multiple of the mean absolute deviation (MAD) of the typical price.
The formula for CCI can be written as:
CCI = (Typical Price - SMA) / (0.015 x MAD)
Where:
Typical Price = (High + Low + Close) / 3
SMA = Simple Moving Average of Typical Price over a specified period (usually 20)
MAD = Mean Absolute Deviation of Typical Price over the same period
The CCI values range between -100 and +100. When the CCI value is above +100, it indicates that the asset is overbought, and there is a possibility of a trend reversal or price correction. Conversely, when the CCI value is below -100, it indicates that the asset is oversold, and there is a potential for a trend reversal or price increase.
Traders use CCI in various ways, such as identifying divergences between price and CCI, looking for bullish or bearish crossovers of the CCI line, and using the CCI in conjunction with other technical indicators to confirm trading signals.
Overall, CCI is a useful tool for traders and investors to analyze market trends, identify potential reversals, and make informed trading decisions. However, it is important to remember that no single indicator can predict the future market movements with certainty, and traders should always consider other factors such as fundamental analysis, news events, and risk management strategies when making trading decisions.
What is a Vertical Horizontal Filter?
The Vertical Horizontal Filter (VHF) is a technical indicator used in trading to identify whether a market is trending or in a sideways trading range. It was developed by Adam White, and is based on the concept that markets tend to exhibit more volatility when they are trending, and less volatility when they are in a sideways range.
The VHF is calculated by taking the ratio of the range of the high and low prices over a specified period to the total range of prices over the same period. The resulting ratio is then multiplied by 100 to create a percentage value.
If the VHF is above a certain threshold, typically 60, it is considered to be indicating a trending market. If it is below the threshold, it is indicating a sideways trading range.
Traders use the VHF to help identify market conditions and to adjust their trading strategies accordingly. In a trending market, traders may look for opportunities to enter or exit positions based on the direction of the trend, while in a sideways trading range, traders may look for opportunities to buy at the bottom of the range and sell at the top.
The VHF can also be used in conjunction with other technical indicators, such as moving averages or momentum indicators, to help confirm trading signals. For example, if the VHF is indicating a trending market and the moving average is also indicating a trend, this may provide a stronger signal to enter or exit a trade.
One potential limitation of the VHF is that it can be less effective in markets that are transitioning between trending and sideways trading ranges. During these periods, the VHF may not accurately reflect the current market conditions, and traders may need to use other indicators or methods to help identify the current trend.
In summary, the Vertical Horizontal Filter (VHF) is a technical indicator used in trading to identify whether a market is trending or in a sideways trading range. It is based on the concept that markets exhibit more volatility when they are trending, and less volatility when they are in a sideways range. Traders use the VHF to help identify market conditions and adjust their trading strategies accordingly.
What is VHF-Adaptive CCI?
This indicator adapts to a VHF filter output. This is done by calculating a period output from the VHF filter. This value is then used to calculate CCI. This adaptivity allows CCI to adjust to price movement more accurately thereby reducing noise and improving signal quality.
Requirements
Inputs
Confirmation 1 and Solo Confirmation: GKD-V Volatility / Volume indicator
Confirmation 2: GKD-C Confirmation indicator
Outputs
Confirmation 2 and Solo Confirmation Complex: GKD-E Exit indicator
Confirmation 1: GKD-C Confirmation indicator
Continuation: GKD-E Exit indicator
Solo Confirmation Simple: GKD-BT Backtest strategy
Additional features will be added in future releases.
Woodies CCI Trading System - Patterns - AlertsWoodies CCI Trading System - Patterns (Alert Mode) .
The Woodies CCI was initially designed for trading Stocks, Options and the Future Market.
However, different styles of traders can make use of it in various markets and any chart timeframes.
The Woodies CCI Trading System - Patterns takes a Strategy Builder like approach and can be easily configured to scan simultaneously for any available pattern.
The purpose of this tool is to compress everything down to 1 alert to warn of any opportunities, and it can also be automated .
To further improve the success rate , the patterns' performance can be studied with the help of the Strategy Tester .
The Strategy Tester Mode allows for instant backtesting on historical data.
It can assist in determining the right combination of patterns and exit rules , and it can help decide which patterns are better for which market.
This trading system contains all the particular features as described by Woodie, and more.
▪ Pattern Recognition (entry signals based on well-defined patterns)
- Trade patterns that are in agreement with the established trend
1. Zero-Line Reject (ZLR)
2. Trend Line Break (TLB) - with the trend
3. Horizontal Trend Line Break (HTLB) - with the trend
4. Tony Trade (TT)
5. GB100 (GB)
6. Reverse Divergence (RD)
- Trade patterns that are against the trend (these patterns indicate the possibility of a change in trend direction and are recommended for experienced traders)
1. Shamu Trade (ST)
2. The Famir Trade (FT)
3. Vegas Trade (VT)
4. Ghost Trade (GT)
5. Hook From Extreme (HFE)
6. Trend Line Break (TLB) - counter-trend
7. Horizontal Trend Line Break (HTLB) - counter-trend
▪ Exit rules
1. CCI Trend Line Breaks
2. CCI crossing back through the 100 lines
3. TCCI hooking or going flat, not moving, or no progress
4. CCI hook from extremes
5. Profit target hit
6. CCI forming a flat top formation
7. CCI crossing a Horizontal Trend Line
8. When the LSMA disagrees with the trade
9. CCI crossing the Zero-Line (ZL)
▪ WCCI Histogram coloring based on Woodie's trend definition
- Blue for Uptrend
- Red for Downtrend
- Gray for No Trend
- Yellow for trend establishment
▪ The LSMA is on the Zero-Line - it is the 25 period Least Squares Moving Average (it shows the ZL as a series of red and green segments)
- Red segments - the market price is below LSMA
- Green segments - the market price is above LSMA
▪ Chop Zone Indicator (CZI) - Positioned on the levels +100 and -100 (it shows market direction)
- Cyan shows up market
- Brown shows down market
- Multiple colors show market in a sideways mode
▪ Sidewinder Indicator (SI) - Positioned on the levels +200 and -200
- Red shows a flat or non-trending market
- Yellow shows a trending market
- Green shows a strong trending market
▪ The Woodies CCI (14) is indicated with the fuchsia color
▪ WCCI length auto-change to 20 on 1-hour chart intervals and higher
▪ The Turbo CCI (6) has a dark red color
▪ TWCCI auto-hide on 1-hour chart intervals and higher
▪ Early Alert Functionality available (eg 20 seconds before the signal is considered valid)
▪ Simplified Alerts
- An all in one alert
- Alerts for entry triggers
- Alerts for exit conditions
▪ Some Pattern Statistics are available on the chart in a panel
Simple Steps to set it up:
1 - Choose at least 1 pattern ( with-the-trend patterns are friendlier than the counter-trend ones)
2 - Choose at least 1 exit condition
3 - Set the alerts (1 for Entry and 1 for Exit, or 1 alert running for both Entry and Exit)
For Beginners:
For the new trader, the trend continuation patterns are easier to manage.
Newcomers should stick to trend-following patterns until they feel very confident!
Here are Three Entry Choices:
1 - Conservative -
Wait until the bar closes to enter - This is the easiest to execute.
2 - Conservative to Aggressive -
Woodie would like the beginner to enter the market if, with 20 seconds left in the bar, a valid CCI pattern presents itself.
3 - Very Aggressive -
Enter trade as soon as the bar indicates a signal during price bar formation. This is for experienced traders, as the signal conditions are final at the close of the bar and the intra-bar changes are not recorded.
Your implicit learned skills are put to the test here. Be fair to yourself and allow yourself time to grow and improve your skills.
You are strongly urged to follow the Option 2.
Money Management: Apply an Initial Protective Stop; Use Trade Exits; Study the past performance - Statistics (Strategy Tester Mode).
Related Tools:
Woodies-CCI Trading System - Patterns - Strategy Tester
Risk Management System (Stop Loss, Take Profit, Trailing Stop Loss, Trailing Take Profit) - it can be connected to the Woodies-CCI Trading System - Patterns - Alerts
Early/Delayed Signal Explained

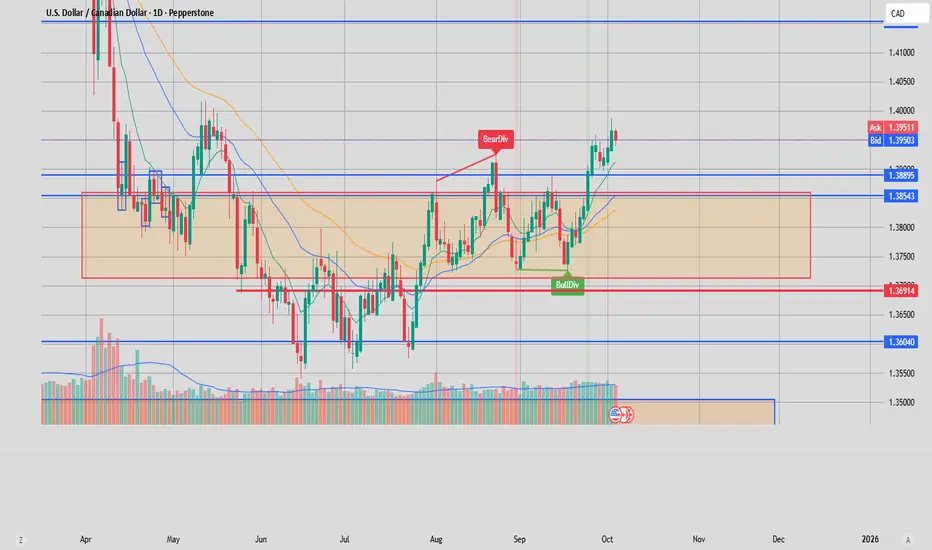
Kornél CCI Divergence — Price Overlay (All levels + EMA50) v6English/Hungarian
🔎 Overview
This is a CCI divergence indicator that looks for discrepancies (divergences) between the price and the CCI (Commodity Channel Index) and plots them on the chart with lines and labels.
⚙️ How it works
It searches for pivot points in the price:
Pivot High (local high)
Pivot Low (local low)
It uses the ta.pivothigh() and ta.pivotlow() functions for this.
For these pivots, it checks the CCI value on the same candle.
Then it compares two consecutive pivots:
Bullish divergence (green):
Price makes a lower low (LL)
CCI makes a higher low (HL)
Price is above the EMA50 (uptrend)
Bearish divergence (red):
Price makes a higher high (HH)
CCI makes a lower high (LH)
Price is below the EMA50 (downtrend)
If a divergence is detected:
Draws a line connecting the two pivots
Adds a label (“BullDiv” or “BearDiv”)
Sets an alert to notify the user
EMA50 trend filter:
Accepts bullish divergences only if price is above EMA50
Accepts bearish divergences only if price is below EMA50
This filters out “false” signals
Keeping the chart clean:
Stores a maximum of X lines and labels at a time (maxLines), deleting older ones
📈 Practical meaning
If the price makes a new low but the CCI does not → Bullish Divergence (price weakness, potential upward reversal)
If the price makes a new high but the CCI does not → Bearish Divergence (trend exhaustion, potential drop)
So it tries to provide reversal signals.
Thanks to the EMA50, it only highlights divergences that align with the current trend → a trend-following divergence filter.
👉 In short:
This indicator plots pivot-based divergences between CCI and price, and only signals when the divergence aligns with the trend indicated by the EMA50.
Magyar:
🔎 Áttekintés
Ez egy CCI divergencia indikátor, amely a CCI (Commodity Channel Index) és az ár közötti eltéréseket (divergenciákat) keresi, és vonalakkal és címkékkel ábrázolja a grafikonon.
⚙️ Hogyan működik
Keresi a pivot pontokat az árban:
Pivot High (helyi csúcs)
Pivot Low (helyi mélypont)
Ehhez a ta.pivothigh() és ta.pivotlow() függvényeket használja.
Ezeknél a pivot pontoknál megnézi a CCI értékét ugyanazon a gyertyán.
Ezután összehasonlít két egymást követő pivotot:
Bullish divergencia (zöld):
Az ár alacsonyabb mélypontot (LL) csinál
A CCI magasabb mélypontot (HL) csinál
Az ár az EMA50 fölött van (emelkedő trend)
Bearish divergencia (piros):
Az ár magasabb csúcsot (HH) csinál
A CCI alacsonyabb csúcsot (LH) csinál
Az ár az EMA50 alatt van (csökkenő trend)
Ha divergencia történik:
Vonalat húz a két pivot pont között
Címkét ad hozzá („BullDiv” vagy „BearDiv”)
Értesítést (alertet) állít be a felhasználónak
EMA50 trend szűrő:
Bullish divergenciát csak akkor fogad el, ha az ár EMA50 fölött van
Bearish divergenciát csak akkor fogad el, ha az ár EMA50 alatt van
Ez kiszűri a „hamis” jeleket
A grafikon tisztán tartása:
Egyszerre maximum X vonalat és címkét tárol (maxLines), a régebbieket törli
📈 Gyakorlati jelentés
Ha az ár új mélypontot ér el, de a CCI nem → Bullish Divergence (árgyengülés, potenciális emelkedés)
Ha az ár új csúcsot ér el, de a CCI nem → Bearish Divergence (trend kifulladása, potenciális csökkenés)
Tehát az indikátor fordulós jeleket próbál adni.
Az EMA50 segítségével csak az aktuális trenddel összhangban lévő divergenciákat emeli ki → trendkövető divergencia szűrő.
👉 Röviden:
Ez az indikátor a CCI és az ár pivot pontjai közötti divergenciákat ábrázolja, és csak akkor jelez, ha a divergencia összhangban van az EMA50 által jelzett trenddel.
RSI and CCICombined RSI and CCI Indicator for MetaTrader
The Combined RSI and CCI Indicator is a powerful hybrid momentum oscillator designed to merge the strengths of two popular indicators—the Relative Strength Index (RSI) and the Commodity Channel Index (CCI)—into a single, visually intuitive chart window. This tool enhances traders’ ability to identify overbought and oversold conditions, divergences, trend strength, and potential reversal zones with improved precision.
Purpose
By integrating RSI and CCI, this indicator helps filter out false signals that often occur when using each tool independently. It is especially useful for swing trading, trend confirmation, and spotting high-probability entry/exit zones. This dual-oscillator approach combines RSI’s relative momentum insights with CCI’s deviation-based analysis to produce a more reliable signal structure.
Key Features
Dual Oscillator Display: Plots both RSI and CCI on the same subwindow for easy comparison and correlation analysis.
Customizable Parameters:
RSI Period and Level (default: 14)
CCI Period and Typical Price Type (default: 20, TP)
Overbought/Oversold Levels for both indicators
Color-Coded Zones:
Background highlights when both RSI and CCI enter overbought/oversold territory, signaling high potential reversal zones.
Combined Signal Logic (Optional Feature):
Buy Signal: RSI < 30 and CCI < -100
Sell Signal: RSI > 70 and CCI > 100
These can be visualized as arrows or plotted as signal markers.
Trend Filter Overlay (Optional):
Can be combined with a moving average or price action filter to confirm trend direction before accepting signals.
Divergence Detection (Advanced Option):
Optional plotting of bullish or bearish divergence where both indicators diverge from price action.
Multi-Timeframe Compatibility:
Allows the use of higher timeframe RSI/CCI values to confirm signals on lower timeframes.
Benefits
Improved Signal Accuracy: Using both RSI and CCI together helps avoid false breakouts and whipsaws.
More Informed Decision-Making: Correlating momentum (RSI) with deviation (CCI) provides a well-rounded picture of market behavior.
Efficient Charting: Saves screen space and cognitive load by combining two indicators into one clean panel.
Scalable Strategy Integration: Can be used in discretionary trading or coded into automated strategies/alerts.
Use Case Example
In a ranging market, the indicator highlights zones where both RSI and CCI are oversold, alerting traders to potential bounce opportunities.
In trending markets, it confirms trend strength when RSI and CCI are both aligned with trend direction.
When RSI is diverging from price but CCI isn’t, it can be a clue of weakening momentum, helping traders scale out or avoid traps.
This combined indicator offers a versatile, high-performance toolset for traders looking to elevate their technical analysis by leveraging multiple momentum perspectives simultaneously.

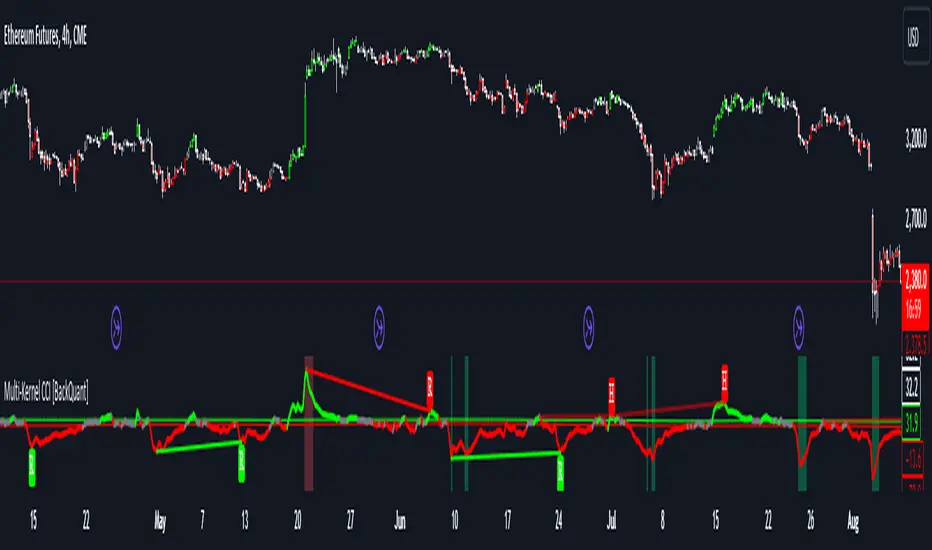
Multi-Kernel CCI [BackQuant]Multi-Kernel CCI
Conceptual Foundation and Innovation
It offers a fresh take on the Commodity Channel Index (CCI) by integrating three distinct kernel functions—Exponential Decay, Gaussian Decay, and Cosine Decay—to create a more robust and adaptive momentum indicator. The use of these kernel functions allows the CCI calculation to be more responsive to price changes while smoothing out noise, providing traders with clearer trend signals and reducing false alerts in varying market conditions.
Technical Composition and Calculation
The core of this indicator is a multi-kernel approach to calculating the CCI, where three different decay kernels are applied to the price source. Each kernel provides a unique weighting mechanism for price data over a user-defined lookback period. The result is an average of these three kernel calculations, which serves as the foundation for the CCI calculation. This innovative approach makes the Multi-Kernel CCI more adaptive to different market conditions compared to traditional CCI calculations.
Exponential Decay Kernel: Applies an exponential weighting to recent price data, giving more importance to recent values while smoothing out older data.
Gaussian Decay Kernel: Weights data using a Gaussian function, ensuring smooth transitions between price points and reducing outliers' impact.
Cosine Decay Kernel: Utilizes a cosine function to apply a unique oscillating weight to the data, capturing cyclical market movements more effectively.
Adaptive Thresholding: Like the Adaptive Momentum Oscillator, this indicator adjusts its long and short thresholds dynamically using percentile-based calculations over historical CCI values.
Features and User Inputs The Multi-Kernel CCI offers a wide range of customization options for traders:
Kernel Calculation Length & Alpha: Traders can fine-tune the sensitivity of the CCI by adjusting the length of the kernel calculation and the alpha parameter for the Exponential Decay Kernel.
Adaptive Thresholds: The indicator provides percentile-based thresholds for both long and short signals, allowing traders to dynamically adjust their signals based on historical data.
Extreme Value Detection: This feature highlights extreme overbought and oversold conditions with customizable thresholds and background hues, visually aiding in identifying high-probability reversal zones.
Divergence Detection: The script includes a divergence detection feature, identifying regular and hidden bullish or bearish divergences to help traders spot potential trend reversals.
Practical Applications The Multi-Kernel CCI excels in markets where adaptive trend detection and momentum confirmation are critical. Traders can leverage this tool in several ways:
Adaptive Trend Following: The dynamically adjusting thresholds allow traders to capture trends more effectively while avoiding false signals during consolidations or choppy markets.
Reversal Detection: The multi-kernel approach ensures that reversals are detected with greater precision, particularly in volatile markets where traditional indicators might fail.
Divergence Identification: With built-in divergence detection, the indicator provides traders with an early warning of potential trend reversals, helping to time their entries and exits more effectively.
Advantages and Strategic Value The Multi-Kernel CCI offers several strategic advantages over traditional CCI indicators:
Multi-Kernel Smoothing:
By using multiple decay kernels, this CCI calculation is better suited to detect subtle changes in market momentum, reducing the impact of noise and providing clearer trend signals.
Dynamic Thresholds:
The adaptive percentile-based thresholds ensure that the indicator remains relevant across different market conditions, enhancing signal accuracy.
Visual and Analytical Aids:
With features like extreme value detection and divergence spotting, this indicator equips traders with powerful tools to confirm trend strength and identify potential reversals.
Summary and Usage Tips
The Multi-Kernel CCI is a highly versatile tool for traders seeking a more adaptive and robust momentum indicator. Its multi-kernel foundation provides smoother, more reliable signals, while the adaptive thresholds and divergence detection features help traders refine their entries and exits. The dynamic nature of this indicator makes it ideal for both trend-following and reversal strategies in volatile markets.
Traders should experiment with the kernel calculation length and alpha parameter to align the indicator's sensitivity with their specific trading style and market conditions. Additionally, the adaptive thresholds can be fine-tuned to ensure the CCI captures the most significant trend changes without being overly reactive to short-term fluctuations.
Thus following all of the key points here are some sample backtests on the 1D Chart
Disclaimer: Backtests are based off past results, and are not indicative of the future.
INDEX:BTCUSD
INDEX:ETHUSD
BINANCE:SOLUSD
Double CCI Confirmed Hull Moving Average Reversal StrategyOverview
The Double CCI Confirmed Hull Moving Average Strategy utilizes hull moving average (HMA) in conjunction with two commodity channel index (CCI) indicators: the slow and fast to increase the probability of entering when the short and mid-term uptrend confirmed. The main idea is to wait until the price breaks the HMA while both CCI are showing that the uptrend has likely been already started. Moreover, strategy uses exponential moving average (EMA) to trail the price when it reaches the specific level. The strategy opens only long trades.
Unique Features
Dynamic stop-loss system: Instead of fixed stop-loss level strategy utilizes average true range (ATR) multiplied by user given number subtracted from the position entry price as a dynamic stop loss level.
Configurable Trading Periods: Users can tailor the strategy to specific market windows, adapting to different market conditions.
Double trade setup confirmation: Strategy utilizes two different period CCI indicators to confirm the breakouts of HMA.
Trailing take profit level: After reaching the trailing profit activation level scrip activate the trailing of long trade using EMA. More information in methodology.
Methodology
The strategy opens long trade when the following price met the conditions:
Short-term period CCI indicator shall be above 0.
Long-term period CCI indicator shall be above 0.
Price shall cross the HMA and candle close above it with the same candle
When long trade is executed, strategy set the stop-loss level at the price ATR multiplied by user-given value below the entry price. This level is recalculated on every next candle close, adjusting to the current market volatility.
At the same time strategy set up the trailing stop validation level. When the price crosses the level equals entry price plus ATR multiplied by user-given value script starts to trail the price with EMA. If price closes below EMA long trade is closed. When the trailing starts, script prints the label “Trailing Activated”.
Strategy settings
In the inputs window user can setup the following strategy settings:
ATR Stop Loss (by default = 1.75)
ATR Trailing Profit Activation Level (by default = 2.25)
CCI Fast Length (by default = 25, used for calculation short term period CCI
CCI Slow Length (by default = 50, used for calculation long term period CCI)
Hull MA Length (by default = 34, period of HMA, which shall be broken to open trade)
Trailing EMA Length (by default = 20)
User can choose the optimal parameters during backtesting on certain price chart.
Justification of Methodology
Before understanding why this particular combination of indicator has been chosen let's briefly explain what is CCI and HMA.
The Commodity Channel Index (CCI) is a momentum-based technical indicator used in trading to measure a security's price relative to its average price over a given period. Developed by Donald Lambert in 1980, the CCI is primarily used to identify cyclical trends in a security, helping traders to spot potential buying or selling opportunities.
The CCI formula is:
CCI = (Typical Price − SMA) / (0.015 × Mean Deviation)
Typical Price (TP): This is calculated as the average of the high, low, and closing prices for the period.
Simple Moving Average (SMA): This is the average of the Typical Prices over a specific number of periods.
Mean Deviation: This is the average of the absolute differences between the Typical Price and the SMA.
The result is a value that typically fluctuates between +100 and -100, though it is not bounded and can go higher or lower depending on the price movement.
The Hull Moving Average (HMA) is a type of moving average that was developed by Alan Hull to improve upon the traditional moving averages by reducing lag while maintaining smoothness. The goal of the HMA is to create an indicator that is both quick to respond to price changes and less prone to whipsaws (false signals).
How the Hull Moving Average is Calculated?
The Hull Moving Average is calculated using the following steps:
Weighted Moving Average (WMA): The HMA starts by calculating the Weighted Moving Average (WMA) of the price data over a period square root of n (sqrt(n))
Speed Adjustment: A WMA is then calculated for half of the period n/2, and this is multiplied by 2 to give more weight to recent prices.
Lag Reduction: The WMA of the full period n is subtracted from the doubled n/2 WMA.
Final Smoothing: To smooth the result and reduce noise, a WMA is calculated for the square root of the period n.
The formula can be represented as:
HMA(n) = WMA(WMA(n/2) × 2 − WMA(n), sqrt(n))
The Weighted Moving Average (WMA) is a type of moving average that gives more weight to recent data points, making it more responsive to recent price changes than a Simple Moving Average (SMA). In a WMA, each data point within the selected period is multiplied by a weight, with the most recent data receiving the highest weight. The sum of these weighted values is then divided by the sum of the weights to produce the WMA.
This strategy leverages HMA of user given period as a critical level which shall be broken to say that probability of trend change to the upside increased. HMA reacts faster than EMA or SMA to the price change, that’s why it increases chances to enter new trade earlier. Long-term period CCI helps to have an approximation of mid-term trend. If it’s above 0 the probability of uptrend increases. Short-period CCI allows to have an approximation of short-term trend reversal from down to uptrend. This approach increases chances to have a long trade setup in the direction of mid-term trend when the short-term trend starts to reverse.
ATR is used to adjust the strategy risk management to the current market volatility. If volatility is low, we don’t need the large stop loss to understand the there is a high probability that we made a mistake opening the trade. User can setup the settings ATR Stop Loss and ATR Trailing Profit Activation Level to realize his own risk to reward preferences, but the unique feature of a strategy is that after reaching trailing profit activation level strategy is trying to follow the trend until it is likely to be finished instead of using fixed risk management settings. It allows sometimes to be involved in the large movements. It’s also important to make a note, that script uses HMA to enter the trade, but for trailing it leverages EMA. It’s used because EMA has no such fast reaction to price move which increases probability not to be stopped out from any significant uptrend move.
Backtest Results
Operating window: Date range of backtests is 2022.07.01 - 2024.08.01. It is chosen to let the strategy to close all opened positions.
Commission and Slippage: Includes a standard Binance commission of 0.1% and accounts for possible slippage over 5 ticks.
Initial capital: 10000 USDT
Percent of capital used in every trade: 100%
Maximum Single Position Loss: -4.67%
Maximum Single Profit: +19.66%
Net Profit: +14897.94 USDT (+148.98%)
Total Trades: 104 (36.54% win rate)
Profit Factor: 2.312
Maximum Accumulated Loss: 1302.66 USDT (-9.58%)
Average Profit per Trade: 143.25 USDT (+0.96%)
Average Trade Duration: 34 hours
These results are obtained with realistic parameters representing trading conditions observed at major exchanges such as Binance and with realistic trading portfolio usage parameters.
How to Use
Add the script to favorites for easy access.
Apply to the desired timeframe and chart (optimal performance observed on 2h BTC/USDT).
Configure settings using the dropdown choice list in the built-in menu.
Set up alerts to automate strategy positions through web hook with the text: {{strategy.order.alert_message}}
Disclaimer:
Educational and informational tool reflecting Skyrex commitment to informed trading. Past performance does not guarantee future results. Test strategies in a simulated environment before live implementation

GKD-C Stepped Moving Average of CCI [Loxx]Giga Kaleidoscope GKD-C Stepped Moving Average of CCI is a Confirmation module included in Loxx's "Giga Kaleidoscope Modularized Trading System".
█ Giga Kaleidoscope Modularized Trading System
What is Loxx's "Giga Kaleidoscope Modularized Trading System"?
The Giga Kaleidoscope Modularized Trading System is a trading system built on the philosophy of the NNFX (No Nonsense Forex) algorithmic trading.
What is the NNFX algorithmic trading strategy?
The NNFX (No-Nonsense Forex) trading system is a comprehensive approach to Forex trading that is designed to simplify the process and remove the confusion and complexity that often surrounds trading. The system was developed by a Forex trader who goes by the pseudonym "VP" and has gained a significant following in the Forex community.
The NNFX trading system is based on a set of rules and guidelines that help traders make objective and informed decisions. These rules cover all aspects of trading, including market analysis, trade entry, stop loss placement, and trade management.
Here are the main components of the NNFX trading system:
1. Trading Philosophy: The NNFX trading system is based on the idea that successful trading requires a comprehensive understanding of the market, objective analysis, and strict risk management. The system aims to remove subjective elements from trading and focuses on objective rules and guidelines.
2. Technical Analysis: The NNFX trading system relies heavily on technical analysis and uses a range of indicators to identify high-probability trading opportunities. The system uses a combination of trend-following and mean-reverting strategies to identify trades.
3. Market Structure: The NNFX trading system emphasizes the importance of understanding the market structure, including price action, support and resistance levels, and market cycles. The system uses a range of tools to identify the market structure, including trend lines, channels, and moving averages.
4. Trade Entry: The NNFX trading system has strict rules for trade entry. The system uses a combination of technical indicators to identify high-probability trades, and traders must meet specific criteria to enter a trade.
5. Stop Loss Placement: The NNFX trading system places a significant emphasis on risk management and requires traders to place a stop loss order on every trade. The system uses a combination of technical analysis and market structure to determine the appropriate stop loss level.
6. Trade Management: The NNFX trading system has specific rules for managing open trades. The system aims to minimize risk and maximize profit by using a combination of trailing stops, take profit levels, and position sizing.
Overall, the NNFX trading system is designed to be a straightforward and easy-to-follow approach to Forex trading that can be applied by traders of all skill levels.
Core components of an NNFX algorithmic trading strategy
The NNFX algorithm is built on the principles of trend, momentum, and volatility. There are six core components in the NNFX trading algorithm:
1. Volatility - price volatility; e.g., Average True Range, True Range Double, Close-to-Close, etc.
2. Baseline - a moving average to identify price trend
3. Confirmation 1 - a technical indicator used to identify trends
4. Confirmation 2 - a technical indicator used to identify trends
5. Continuation - a technical indicator used to identify trends
6. Volatility/Volume - a technical indicator used to identify volatility/volume breakouts/breakdown
7. Exit - a technical indicator used to determine when a trend is exhausted
What is Volatility in the NNFX trading system?
In the NNFX (No Nonsense Forex) trading system, ATR (Average True Range) is typically used to measure the volatility of an asset. It is used as a part of the system to help determine the appropriate stop loss and take profit levels for a trade. ATR is calculated by taking the average of the true range values over a specified period.
True range is calculated as the maximum of the following values:
-Current high minus the current low
-Absolute value of the current high minus the previous close
-Absolute value of the current low minus the previous close
ATR is a dynamic indicator that changes with changes in volatility. As volatility increases, the value of ATR increases, and as volatility decreases, the value of ATR decreases. By using ATR in NNFX system, traders can adjust their stop loss and take profit levels according to the volatility of the asset being traded. This helps to ensure that the trade is given enough room to move, while also minimizing potential losses.
Other types of volatility include True Range Double (TRD), Close-to-Close, and Garman-Klass
What is a Baseline indicator?
The baseline is essentially a moving average, and is used to determine the overall direction of the market.
The baseline in the NNFX system is used to filter out trades that are not in line with the long-term trend of the market. The baseline is plotted on the chart along with other indicators, such as the Moving Average (MA), the Relative Strength Index (RSI), and the Average True Range (ATR).
Trades are only taken when the price is in the same direction as the baseline. For example, if the baseline is sloping upwards, only long trades are taken, and if the baseline is sloping downwards, only short trades are taken. This approach helps to ensure that trades are in line with the overall trend of the market, and reduces the risk of entering trades that are likely to fail.
By using a baseline in the NNFX system, traders can have a clear reference point for determining the overall trend of the market, and can make more informed trading decisions. The baseline helps to filter out noise and false signals, and ensures that trades are taken in the direction of the long-term trend.
What is a Confirmation indicator?
Confirmation indicators are technical indicators that are used to confirm the signals generated by primary indicators. Primary indicators are the core indicators used in the NNFX system, such as the Average True Range (ATR), the Moving Average (MA), and the Relative Strength Index (RSI).
The purpose of the confirmation indicators is to reduce false signals and improve the accuracy of the trading system. They are designed to confirm the signals generated by the primary indicators by providing additional information about the strength and direction of the trend.
Some examples of confirmation indicators that may be used in the NNFX system include the Bollinger Bands, the MACD (Moving Average Convergence Divergence), and the MACD Oscillator. These indicators can provide information about the volatility, momentum, and trend strength of the market, and can be used to confirm the signals generated by the primary indicators.
In the NNFX system, confirmation indicators are used in combination with primary indicators and other filters to create a trading system that is robust and reliable. By using multiple indicators to confirm trading signals, the system aims to reduce the risk of false signals and improve the overall profitability of the trades.
What is a Continuation indicator?
In the NNFX (No Nonsense Forex) trading system, a continuation indicator is a technical indicator that is used to confirm a current trend and predict that the trend is likely to continue in the same direction. A continuation indicator is typically used in conjunction with other indicators in the system, such as a baseline indicator, to provide a comprehensive trading strategy.
What is a Volatility/Volume indicator?
Volume indicators, such as the On Balance Volume (OBV), the Chaikin Money Flow (CMF), or the Volume Price Trend (VPT), are used to measure the amount of buying and selling activity in a market. They are based on the trading volume of the market, and can provide information about the strength of the trend. In the NNFX system, volume indicators are used to confirm trading signals generated by the Moving Average and the Relative Strength Index. Volatility indicators include Average Direction Index, Waddah Attar, and Volatility Ratio. In the NNFX trading system, volatility is a proxy for volume and vice versa.
By using volume indicators as confirmation tools, the NNFX trading system aims to reduce the risk of false signals and improve the overall profitability of trades. These indicators can provide additional information about the market that is not captured by the primary indicators, and can help traders to make more informed trading decisions. In addition, volume indicators can be used to identify potential changes in market trends and to confirm the strength of price movements.
What is an Exit indicator?
The exit indicator is used in conjunction with other indicators in the system, such as the Moving Average (MA), the Relative Strength Index (RSI), and the Average True Range (ATR), to provide a comprehensive trading strategy.
The exit indicator in the NNFX system can be any technical indicator that is deemed effective at identifying optimal exit points. Examples of exit indicators that are commonly used include the Parabolic SAR, the Average Directional Index (ADX), and the Chandelier Exit.
The purpose of the exit indicator is to identify when a trend is likely to reverse or when the market conditions have changed, signaling the need to exit a trade. By using an exit indicator, traders can manage their risk and prevent significant losses.
In the NNFX system, the exit indicator is used in conjunction with a stop loss and a take profit order to maximize profits and minimize losses. The stop loss order is used to limit the amount of loss that can be incurred if the trade goes against the trader, while the take profit order is used to lock in profits when the trade is moving in the trader's favor.
Overall, the use of an exit indicator in the NNFX trading system is an important component of a comprehensive trading strategy. It allows traders to manage their risk effectively and improve the profitability of their trades by exiting at the right time.
How does Loxx's GKD (Giga Kaleidoscope Modularized Trading System) implement the NNFX algorithm outlined above?
Loxx's GKD v1.0 system has five types of modules (indicators/strategies). These modules are:
1. GKD-BT - Backtesting module (Volatility, Number 1 in the NNFX algorithm)
2. GKD-B - Baseline module (Baseline and Volatility/Volume, Numbers 1 and 2 in the NNFX algorithm)
3. GKD-C - Confirmation 1/2 and Continuation module (Confirmation 1/2 and Continuation, Numbers 3, 4, and 5 in the NNFX algorithm)
4. GKD-V - Volatility/Volume module (Confirmation 1/2, Number 6 in the NNFX algorithm)
5. GKD-E - Exit module (Exit, Number 7 in the NNFX algorithm)
(additional module types will added in future releases)
Each module interacts with every module by passing data between modules. Data is passed between each module as described below:
GKD-B => GKD-V => GKD-C(1) => GKD-C(2) => GKD-C(Continuation) => GKD-E => GKD-BT
That is, the Baseline indicator passes its data to Volatility/Volume. The Volatility/Volume indicator passes its values to the Confirmation 1 indicator. The Confirmation 1 indicator passes its values to the Confirmation 2 indicator. The Confirmation 2 indicator passes its values to the Continuation indicator. The Continuation indicator passes its values to the Exit indicator, and finally, the Exit indicator passes its values to the Backtest strategy.
This chaining of indicators requires that each module conform to Loxx's GKD protocol, therefore allowing for the testing of every possible combination of technical indicators that make up the six components of the NNFX algorithm.
What does the application of the GKD trading system look like?
Example trading system:
Backtest: Strategy with 1-3 take profits, trailing stop loss, multiple types of PnL volatility, and 2 backtesting styles
Baseline: Hull Moving Average
Volatility/Volume: Hurst Exponent
Confirmation 1: Stepped Moving Average of CCI as shown on the chart above
Confirmation 2: Williams Percent Range
Continuation: Fisher Transform
Exit: Rex Oscillator
Each GKD indicator is denoted with a module identifier of either: GKD-BT, GKD-B, GKD-C, GKD-V, or GKD-E. This allows traders to understand to which module each indicator belongs and where each indicator fits into the GKD protocol chain.
Giga Kaleidoscope Modularized Trading System Signals (based on the NNFX algorithm)
Standard Entry
1. GKD-C Confirmation 1 Signal
2. GKD-B Baseline agrees
3. Price is within a range of 0.2x Volatility and 1.0x Volatility of the Goldie Locks Mean
4. GKD-C Confirmation 2 agrees
5. GKD-V Volatility/Volume agrees
Baseline Entry
1. GKD-B Baseline signal
2. GKD-C Confirmation 1 agrees
3. Price is within a range of 0.2x Volatility and 1.0x Volatility of the Goldie Locks Mean
4. GKD-C Confirmation 2 agrees
5. GKD-V Volatility/Volume agrees
6. GKD-C Confirmation 1 signal was less than 7 candles prior
Volatility/Volume Entry
1. GKD-V Volatility/Volume signal
2. GKD-C Confirmation 1 agrees
3. Price is within a range of 0.2x Volatility and 1.0x Volatility of the Goldie Locks Mean
4. GKD-C Confirmation 2 agrees
5. GKD-B Baseline agrees
6. GKD-C Confirmation 1 signal was less than 7 candles prior
Continuation Entry
1. Standard Entry, Baseline Entry, or Pullback; entry triggered previously
2. GKD-B Baseline hasn't crossed since entry signal trigger
3. GKD-C Confirmation Continuation Indicator signals
4. GKD-C Confirmation 1 agrees
5. GKD-B Baseline agrees
6. GKD-C Confirmation 2 agrees
1-Candle Rule Standard Entry
1. GKD-C Confirmation 1 signal
2. GKD-B Baseline agrees
3. Price is within a range of 0.2x Volatility and 1.0x Volatility of the Goldie Locks Mean
Next Candle:
1. Price retraced (Long: close < close or Short: close > close )
2. GKD-B Baseline agrees
3. GKD-C Confirmation 1 agrees
4. GKD-C Confirmation 2 agrees
5. GKD-V Volatility/Volume agrees
1-Candle Rule Baseline Entry
1. GKD-B Baseline signal
2. GKD-C Confirmation 1 agrees
3. Price is within a range of 0.2x Volatility and 1.0x Volatility of the Goldie Locks Mean
4. GKD-C Confirmation 1 signal was less than 7 candles prior
Next Candle:
1. Price retraced (Long: close < close or Short: close > close )
2. GKD-B Baseline agrees
3. GKD-C Confirmation 1 agrees
4. GKD-C Confirmation 2 agrees
5. GKD-V Volatility/Volume Agrees
1-Candle Rule Volatility/Volume Entry
1. GKD-V Volatility/Volume signal
2. GKD-C Confirmation 1 agrees
3. Price is within a range of 0.2x Volatility and 1.0x Volatility of the Goldie Locks Mean
4. GKD-C Confirmation 1 signal was less than 7 candles prior
Next Candle:
1. Price retraced (Long: close < close or Short: close > close)
2. GKD-B Volatility/Volume agrees
3. GKD-C Confirmation 1 agrees
4. GKD-C Confirmation 2 agrees
5. GKD-B Baseline agrees
PullBack Entry
1. GKD-B Baseline signal
2. GKD-C Confirmation 1 agrees
3. Price is beyond 1.0x Volatility of Baseline
Next Candle:
1. Price is within a range of 0.2x Volatility and 1.0x Volatility of the Goldie Locks Mean
2. GKD-C Confirmation 1 agrees
3. GKD-C Confirmation 2 agrees
4. GKD-V Volatility/Volume Agrees
]█ Setting up the GKD
The GKD system involves chaining indicators together. These are the steps to set this up.
Use a GKD-C indicator alone on a chart
1. Inside the GKD-C indicator, change the "Confirmation Type" setting to "Solo Confirmation Simple"
Use a GKD-V indicator alone on a chart
**nothing, it's already useable on the chart without any settings changes
Use a GKD-B indicator alone on a chart
**nothing, it's already useable on the chart without any settings changes
Baseline (Baseline, Backtest)
1. Import the GKD-B Baseline into the GKD-BT Backtest: "Input into Volatility/Volume or Backtest (Baseline testing)"
2. Inside the GKD-BT Backtest, change the setting "Backtest Special" to "Baseline"
Volatility/Volume (Volatility/Volume, Backte st)
1. Inside the GKD-V indicator, change the "Testing Type" setting to "Solo"
2. Inside the GKD-V indicator, change the "Signal Type" setting to "Crossing" (neither traditional nor both can be backtested)
3. Import the GKD-V indicator into the GKD-BT Backtest: "Input into C1 or Backtest"
4. Inside the GKD-BT Backtest, change the setting "Backtest Special" to "Volatility/Volume"
5. Inside the GKD-BT Backtest, a) change the setting "Backtest Type" to "Trading" if using a directional GKD-V indicator; or, b) change the setting "Backtest Type" to "Full" if using a directional or non-directional GKD-V indicator (non-directional GKD-V can only test Longs and Shorts separately)
6. If "Backtest Type" is set to "Full": Inside the GKD-BT Backtest, change the setting "Backtest Side" to "Long" or "Short
7. If "Backtest Type" is set to "Full": To allow the system to open multiple orders at one time so you test all Longs or Shorts, open the GKD-BT Backtest, click the tab "Properties" and then insert a value of something like 10 orders into the "Pyramiding" settings. This will allow 10 orders to be opened at one time which should be enough to catch all possible Longs or Shorts.
Solo Confirmation Simple (Confirmation, Backtest)
1. Inside the GKD-C indicator, change the "Confirmation Type" setting to "Solo Confirmation Simple"
1. Import the GKD-C indicator into the GKD-BT Backtest: "Input into Backtest"
2. Inside the GKD-BT Backtest, change the setting "Backtest Special" to "Solo Confirmation Simple"
Solo Confirmation Complex without Exits (Baseline, Volatility/Volume, Confirmation, Backtest)
1. Inside the GKD-V indicator, change the "Testing Type" setting to "Chained"
2. Import the GKD-B Baseline into the GKD-V indicator: "Input into Volatility/Volume or Backtest (Baseline testing)"
3. Inside the GKD-C indicator, change the "Confirmation Type" setting to "Solo Confirmation Complex"
4. Import the GKD-V indicator into the GKD-C indicator: "Input into C1 or Backtest"
5. Inside the GKD-BT Backtest, change the setting "Backtest Special" to "GKD Full wo/ Exits"
6. Import the GKD-C into the GKD-BT Backtest: "Input into Exit"
Solo Confirmation Complex with Exits (Baseline, Volatility/Volume, Confirmation, Exit, Backtest)
1. Inside the GKD-V indicator, change the "Testing Type" setting to "Chained"
2. Import the GKD-B Baseline into the GKD-V indicator: "Input into Volatility/Volume or Backtest (Baseline testing)"
3. Inside the GKD-C indicator, change the "Confirmation Type" setting to "Solo Confirmation Complex"
4. Import the GKD-V indicator into the GKD-C indicator: "Input into C1 or Backtest"
5. Import the GKD-C indicator into the GKD-E indicator: "Input into Exit"
6. Inside the GKD-BT Backtest, change the setting "Backtest Special" to "GKD Full w/ Exits"
7. Import the GKD-E into the GKD-BT Backtest: "Input into Backtest"
Full GKD without Exits (Baseline, Volatility/Volume, Confirmation 1, Confirmation 2, Continuation, Backtest)
1. Inside the GKD-V indicator, change the "Testing Type" setting to "Chained"
2. Import the GKD-B Baseline into the GKD-V indicator: "Input into Volatility/Volume or Backtest (Baseline testing)"
3. Inside the GKD-C 1 indicator, change the "Confirmation Type" setting to "Confirmation 1"
4. Import the GKD-V indicator into the GKD-C 1 indicator: "Input into C1 or Backtest"
5. Inside the GKD-C 2 indicator, change the "Confirmation Type" setting to "Confirmation 2"
6. Import the GKD-C 1 indicator into the GKD-C 2 indicator: "Input into C2"
7. Inside the GKD-C Continuation indicator, change the "Confirmation Type" setting to "Continuation"
8. Inside the GKD-BT Backtest, change the setting "Backtest Special" to "GKD Full wo/ Exits"
9. Import the GKD-E into the GKD-BT Backtest: "Input into Exit"
Full GKD with Exits (Baseline, Volatility/Volume, Confirmation 1, Confirmation 2, Continuation, Exit, Backtest)
1. Inside the GKD-V indicator, change the "Testing Type" setting to "Chained"
2. Import the GKD-B Baseline into the GKD-V indicator: "Input into Volatility/Volume or Backtest (Baseline testing)"
3. Inside the GKD-C 1 indicator, change the "Confirmation Type" setting to "Confirmation 1"
4. Import the GKD-V indicator into the GKD-C 1 indicator: "Input into C1 or Backtest"
5. Inside the GKD-C 2 indicator, change the "Confirmation Type" setting to "Confirmation 2"
6. Import the GKD-C 1 indicator into the GKD-C 2 indicator: "Input into C2"
7. Inside the GKD-C Continuation indicator, change the "Confirmation Type" setting to "Continuation"
8. Import the GKD-C Continuation indicator into the GKD-E indicator: "Input into Exit"
9. Inside the GKD-BT Backtest, change the setting "Backtest Special" to "GKD Full w/ Exits"
10. Import the GKD-E into the GKD-BT Backtest: "Input into Backtest"
Baseline + Volatility/Volume (Baseline, Volatility/Volume, Backtest)
1. Inside the GKD-V indicator, change the "Testing Type" setting to "Baseline + Volatility/Volume"
2. Inside the GKD-V indicator, make sure the "Signal Type" setting is set to "Traditional"
3. Import the GKD-B Baseline into the GKD-V indicator: "Input into Volatility/Volume or Backtest (Baseline testing)"
4. Inside the GKD-BT Backtest, change the setting "Backtest Special" to "Baseline + Volatility/Volume"
5. Import the GKD-V into the GKD-BT Backtest: "Input into C1 or Backtest"
6. Inside the GKD-BT Backtest, change the setting "Backtest Type" to "Full". For this backtest, you must test Longs and Shorts separately
7. To allow the system to open multiple orders at one time so you can test all Longs or Shorts, open the GKD-BT Backtest, click the tab "Properties" and then insert a value of something like 10 orders into the "Pyramiding" settings. This will allow 10 orders to be opened at one time which should be enough to catch all possible Longs or Shorts.
█ GKD-C Stepped Moving Average of CCI
What is Stepped Moving Average?
The Step MA function is a custom implementation of a step-moving average that uses the high and low prices of a security, along with the current price, to calculate the maximum and minimum step-moving average values. It then determines the current trend based on the relationship between the current price and the maximum and minimum values, and calculates the step-moving average for that trend. The calculated step-moving average is returned as the output of the function.
What is CCI?
CCI, or Commodity Channel Index, is a momentum-based technical analysis indicator developed by Donald Lambert in 1980. Initially created for the commodity markets, CCI has since been widely adopted for use in various financial markets, including stocks, forex, and indices.
The CCI measures the difference between the current price and its historical average relative to the average price fluctuations over a specific period. It helps traders identify potential overbought and oversold conditions and possible trend reversals.
The CCI is calculated as follows:
Calculate the Typical Price (TP) for each period: TP = (High + Low + Close) / 3
Calculate the Simple Moving Average (SMA) of the Typical Price over the chosen period (usually 14 or 20 periods).
Calculate the Mean Deviation (MD) by finding the average of the absolute difference between the Typical Price and its SMA for each period.
Calculate the CCI: CCI = (Typical Price - SMA) / (0.015 * Mean Deviation)
The constant 0.015 is a scaling factor that brings the CCI values within a standardized range, typically -100 to +100. Some traders might use different scaling factors depending on their preferences.
When using the CCI, traders consider the following:
Values above +100 typically indicate overbought conditions, suggesting a potential price decline.
Values below -100 typically indicate oversold conditions, suggesting a potential price increase.
CCI crossing above or below the zero line can signal a change in the direction of the market trend.
It is important to note that the CCI is a versatile indicator and can be used in combination with other technical analysis tools to improve the accuracy of trading signals.
What is the Stepped Moving Average of CCI?
This indicator runs the CCI through Stepped Moving Average algorithm to derive a smoother CCI.
Requirements
Inputs
Confirmation 1: GKD-V Volatility / Volume indicator
Confirmation 2: GKD-C Confirmation indicator
Continuation: GKD-C Confirmation indicator
Solo Confirmation Simple: GKD-B Baseline
Solo Confirmation Complex: GKD-V Volatility / Volume indicator
Solo Confirmation Super Complex: GKD-V Volatility / Volume indicator
Stacked 1: None
Stacked 2+: GKD-C, GKD-V, or GKD-B Stacked 1
Outputs
Confirmation 1: GKD-C Confirmation 2 indicator
Confirmation 2: GKD-C Continuation indicator
Continuation: GKD-E Exit indicator
Solo Confirmation Simple: GKD-BT Backtest
Solo Confirmation Complex: GKD-BT Backtest or GKD-E Exit indicator
Solo Confirmation Super Complex: GKD-C Continuation indicator
Stacked 1: GKD-C, GKD-V, or GKD-B Stacked 2+
Stacked 2+: GKD-C, GKD-V, or GKD-B Stacked 2+ or GKD-BT Backtest
Additional features will be added in future releases.

GKD-C T3-based CCI [Loxx]Giga Kaleidoscope GKD-C T3-based CCI is a Confirmation module included in Loxx's "Giga Kaleidoscope Modularized Trading System".
█ Giga Kaleidoscope Modularized Trading System
What is Loxx's "Giga Kaleidoscope Modularized Trading System"?
The Giga Kaleidoscope Modularized Trading System is a trading system built on the philosophy of the NNFX (No Nonsense Forex) algorithmic trading.
What is the NNFX algorithmic trading strategy?
The NNFX (No-Nonsense Forex) trading system is a comprehensive approach to Forex trading that is designed to simplify the process and remove the confusion and complexity that often surrounds trading. The system was developed by a Forex trader who goes by the pseudonym "VP" and has gained a significant following in the Forex community.
The NNFX trading system is based on a set of rules and guidelines that help traders make objective and informed decisions. These rules cover all aspects of trading, including market analysis, trade entry, stop loss placement, and trade management.
Here are the main components of the NNFX trading system:
1. Trading Philosophy: The NNFX trading system is based on the idea that successful trading requires a comprehensive understanding of the market, objective analysis, and strict risk management. The system aims to remove subjective elements from trading and focuses on objective rules and guidelines.
2. Technical Analysis: The NNFX trading system relies heavily on technical analysis and uses a range of indicators to identify high-probability trading opportunities. The system uses a combination of trend-following and mean-reverting strategies to identify trades.
3. Market Structure: The NNFX trading system emphasizes the importance of understanding the market structure, including price action, support and resistance levels, and market cycles. The system uses a range of tools to identify the market structure, including trend lines, channels, and moving averages.
4. Trade Entry: The NNFX trading system has strict rules for trade entry. The system uses a combination of technical indicators to identify high-probability trades, and traders must meet specific criteria to enter a trade.
5. Stop Loss Placement: The NNFX trading system places a significant emphasis on risk management and requires traders to place a stop loss order on every trade. The system uses a combination of technical analysis and market structure to determine the appropriate stop loss level.
6. Trade Management: The NNFX trading system has specific rules for managing open trades. The system aims to minimize risk and maximize profit by using a combination of trailing stops, take profit levels, and position sizing.
Overall, the NNFX trading system is designed to be a straightforward and easy-to-follow approach to Forex trading that can be applied by traders of all skill levels.
Core components of an NNFX algorithmic trading strategy
The NNFX algorithm is built on the principles of trend, momentum, and volatility. There are six core components in the NNFX trading algorithm:
1. Volatility - price volatility; e.g., Average True Range, True Range Double, Close-to-Close, etc.
2. Baseline - a moving average to identify price trend
3. Confirmation 1 - a technical indicator used to identify trends
4. Confirmation 2 - a technical indicator used to identify trends
5. Continuation - a technical indicator used to identify trends
6. Volatility/Volume - a technical indicator used to identify volatility/volume breakouts/breakdown
7. Exit - a technical indicator used to determine when a trend is exhausted
What is Volatility in the NNFX trading system?
In the NNFX (No Nonsense Forex) trading system, ATR (Average True Range) is typically used to measure the volatility of an asset. It is used as a part of the system to help determine the appropriate stop loss and take profit levels for a trade. ATR is calculated by taking the average of the true range values over a specified period.
True range is calculated as the maximum of the following values:
-Current high minus the current low
-Absolute value of the current high minus the previous close
-Absolute value of the current low minus the previous close
ATR is a dynamic indicator that changes with changes in volatility. As volatility increases, the value of ATR increases, and as volatility decreases, the value of ATR decreases. By using ATR in NNFX system, traders can adjust their stop loss and take profit levels according to the volatility of the asset being traded. This helps to ensure that the trade is given enough room to move, while also minimizing potential losses.
Other types of volatility include True Range Double (TRD), Close-to-Close, and Garman-Klass
What is a Baseline indicator?
The baseline is essentially a moving average, and is used to determine the overall direction of the market.
The baseline in the NNFX system is used to filter out trades that are not in line with the long-term trend of the market. The baseline is plotted on the chart along with other indicators, such as the Moving Average (MA), the Relative Strength Index (RSI), and the Average True Range (ATR).
Trades are only taken when the price is in the same direction as the baseline. For example, if the baseline is sloping upwards, only long trades are taken, and if the baseline is sloping downwards, only short trades are taken. This approach helps to ensure that trades are in line with the overall trend of the market, and reduces the risk of entering trades that are likely to fail.
By using a baseline in the NNFX system, traders can have a clear reference point for determining the overall trend of the market, and can make more informed trading decisions. The baseline helps to filter out noise and false signals, and ensures that trades are taken in the direction of the long-term trend.
What is a Confirmation indicator?
Confirmation indicators are technical indicators that are used to confirm the signals generated by primary indicators. Primary indicators are the core indicators used in the NNFX system, such as the Average True Range (ATR), the Moving Average (MA), and the Relative Strength Index (RSI).
The purpose of the confirmation indicators is to reduce false signals and improve the accuracy of the trading system. They are designed to confirm the signals generated by the primary indicators by providing additional information about the strength and direction of the trend.
Some examples of confirmation indicators that may be used in the NNFX system include the Bollinger Bands, the MACD (Moving Average Convergence Divergence), and the Stochastic Oscillator. These indicators can provide information about the volatility, momentum, and trend strength of the market, and can be used to confirm the signals generated by the primary indicators.
In the NNFX system, confirmation indicators are used in combination with primary indicators and other filters to create a trading system that is robust and reliable. By using multiple indicators to confirm trading signals, the system aims to reduce the risk of false signals and improve the overall profitability of the trades.
What is a Continuation indicator?
In the NNFX (No Nonsense Forex) trading system, a continuation indicator is a technical indicator that is used to confirm a current trend and predict that the trend is likely to continue in the same direction. A continuation indicator is typically used in conjunction with other indicators in the system, such as a baseline indicator, to provide a comprehensive trading strategy.
What is a Volatility/Volume indicator?
Volume indicators, such as the On Balance Volume (OBV), the Chaikin Money Flow (CMF), or the Volume Price Trend (VPT), are used to measure the amount of buying and selling activity in a market. They are based on the trading volume of the market, and can provide information about the strength of the trend. In the NNFX system, volume indicators are used to confirm trading signals generated by the Moving Average and the Relative Strength Index. Volatility indicators include Average Direction Index, Waddah Attar, and Volatility Ratio. In the NNFX trading system, volatility is a proxy for volume and vice versa.
By using volume indicators as confirmation tools, the NNFX trading system aims to reduce the risk of false signals and improve the overall profitability of trades. These indicators can provide additional information about the market that is not captured by the primary indicators, and can help traders to make more informed trading decisions. In addition, volume indicators can be used to identify potential changes in market trends and to confirm the strength of price movements.
What is an Exit indicator?
The exit indicator is used in conjunction with other indicators in the system, such as the Moving Average (MA), the Relative Strength Index (RSI), and the Average True Range (ATR), to provide a comprehensive trading strategy.
The exit indicator in the NNFX system can be any technical indicator that is deemed effective at identifying optimal exit points. Examples of exit indicators that are commonly used include the Parabolic SAR, the Average Directional Index (ADX), and the Chandelier Exit.
The purpose of the exit indicator is to identify when a trend is likely to reverse or when the market conditions have changed, signaling the need to exit a trade. By using an exit indicator, traders can manage their risk and prevent significant losses.
In the NNFX system, the exit indicator is used in conjunction with a stop loss and a take profit order to maximize profits and minimize losses. The stop loss order is used to limit the amount of loss that can be incurred if the trade goes against the trader, while the take profit order is used to lock in profits when the trade is moving in the trader's favor.
Overall, the use of an exit indicator in the NNFX trading system is an important component of a comprehensive trading strategy. It allows traders to manage their risk effectively and improve the profitability of their trades by exiting at the right time.
How does Loxx's GKD (Giga Kaleidoscope Modularized Trading System) implement the NNFX algorithm outlined above?
Loxx's GKD v1.0 system has five types of modules (indicators/strategies). These modules are:
1. GKD-BT - Backtesting module (Volatility, Number 1 in the NNFX algorithm)
2. GKD-B - Baseline module (Baseline and Volatility/Volume, Numbers 1 and 2 in the NNFX algorithm)
3. GKD-C - Confirmation 1/2 and Continuation module (Confirmation 1/2 and Continuation, Numbers 3, 4, and 5 in the NNFX algorithm)
4. GKD-V - Volatility/Volume module (Confirmation 1/2, Number 6 in the NNFX algorithm)
5. GKD-E - Exit module (Exit, Number 7 in the NNFX algorithm)
(additional module types will added in future releases)
Each module interacts with every module by passing data between modules. Data is passed between each module as described below:
GKD-B => GKD-V => GKD-C(1) => GKD-C(2) => GKD-C(Continuation) => GKD-E => GKD-BT
That is, the Baseline indicator passes its data to Volatility/Volume. The Volatility/Volume indicator passes its values to the Confirmation 1 indicator. The Confirmation 1 indicator passes its values to the Confirmation 2 indicator. The Confirmation 2 indicator passes its values to the Continuation indicator. The Continuation indicator passes its values to the Exit indicator, and finally, the Exit indicator passes its values to the Backtest strategy.
This chaining of indicators requires that each module conform to Loxx's GKD protocol, therefore allowing for the testing of every possible combination of technical indicators that make up the six components of the NNFX algorithm.
What does the application of the GKD trading system look like?
Example trading system:
Backtest: Strategy with 1-3 take profits, trailing stop loss, multiple types of PnL volatility, and 2 backtesting styles
Baseline: Hull Moving Average
Volatility/Volume: Hurst Exponent
Confirmation 1: T3-based CCI as shown on the chart above
Confirmation 2: Williams Percent Range
Continuation: Fisher Transform
Exit: Rex Oscillator
Each GKD indicator is denoted with a module identifier of either: GKD-BT, GKD-B, GKD-C, GKD-V, or GKD-E. This allows traders to understand to which module each indicator belongs and where each indicator fits into the GKD protocol chain.
Giga Kaleidoscope Modularized Trading System Signals (based on the NNFX algorithm)
Standard Entry
1. GKD-C Confirmation 1 Signal
2. GKD-B Baseline agrees
3. Price is within a range of 0.2x Volatility and 1.0x Volatility of the Goldie Locks Mean
4. GKD-C Confirmation 2 agrees
5. GKD-V Volatility/Volume agrees
Baseline Entry
1. GKD-B Baseline signal
2. GKD-C Confirmation 1 agrees
3. Price is within a range of 0.2x Volatility and 1.0x Volatility of the Goldie Locks Mean
4. GKD-C Confirmation 2 agrees
5. GKD-V Volatility/Volume agrees
6. GKD-C Confirmation 1 signal was less than 7 candles prior
Continuation Entry
1. Standard Entry, Baseline Entry, or Pullback; entry triggered previously
2. GKD-B Baseline hasn't crossed since entry signal trigger
3. GKD-C Confirmation Continuation Indicator signals
4. GKD-C Confirmation 1 agrees
5. GKD-B Baseline agrees
6. GKD-C Confirmation 2 agrees
1-Candle Rule Standard Entry
1. GKD-C Confirmation 1 signal
2. GKD-B Baseline agrees
3. Price is within a range of 0.2x Volatility and 1.0x Volatility of the Goldie Locks Mean
Next Candle:
1. Price retraced (Long: close < close or Short: close > close )
2. GKD-B Baseline agrees
3. GKD-C Confirmation 1 agrees
4. GKD-C Confirmation 2 agrees
5. GKD-V Volatility/Volume agrees
1-Candle Rule Baseline Entry
1. GKD-B Baseline signal
2. GKD-C Confirmation 1 agrees
3. Price is within a range of 0.2x Volatility and 1.0x Volatility of the Goldie Locks Mean
4. GKD-C Confirmation 1 signal was less than 7 candles prior
Next Candle:
1. Price retraced (Long: close < close or Short: close > close )
2. GKD-B Baseline agrees
3. GKD-C Confirmation 1 agrees
4. GKD-C Confirmation 2 agrees
5. GKD-V Volatility/Volume Agrees
PullBack Entry
1. GKD-B Baseline signal
2. GKD-C Confirmation 1 agrees
3. Price is beyond 1.0x Volatility of Baseline
Next Candle:
1. Price is within a range of 0.2x Volatility and 1.0x Volatility of the Goldie Locks Mean
3. GKD-C Confirmation 1 agrees
4. GKD-C Confirmation 2 agrees
5. GKD-V Volatility/Volume Agrees
█ GKD-C T3-based CCI
What is T3?
The T3 Moving Average (T3MA) is a technical analysis indicator that was developed by Tim Tillson. It is a trend-following indicator that aims to provide a smoother and more accurate representation of price trends than other moving average indicators.
The T3MA is a type of exponential moving average ( EMA ) that is calculated using a series of complex formulas. Unlike a simple or exponential moving average , which use fixed smoothing factors, the T3MA uses a variable smoothing factor that is based on the volatility of the underlying asset. This means that the T3MA is able to adapt to changing market conditions and provide more accurate signals.
The formula for calculating the T3MA is as follows:
T3 = a * EMA1 + (1 - a) * T3
Where:
-T3 is the current value of the T3MA
-EMA1 is the current value of the first EMA
-T3 is the previous value of the T3MA
-a is the smoothing factor, which is based on the volatility of the underlying asset and is calculated using the following formulas:
-c1 = -1 + exp (-sqrt(2) * pi / period)
-c2 = 2 * c1 * c1 + 2 * c1
-c3 = 1 - c1 - c2
-a = c1 * sqrt(period) * (close - T3) + c2 * T3 + c3 * EMA1
In simple terms, the T3MA is calculated by taking a weighted average of two different EMAs, with the weight given to each EMA depending on the volatility of the asset being analyzed. The T3MA is then smoothed using a second smoothing factor, which further reduces noise and improves the accuracy of the indicator.
The T3MA can be used in a variety of ways by traders and analysts. Some common applications include using the T3MA as a trend-following indicator, with buy signals generated when the price of an asset crosses above the T3MA and sell signals generated when the price crosses below. The T3MA can also be used in combination with other indicators and analytical techniques to confirm trading decisions and identify potential trend reversals.
Overall, the T3 Moving Average is a highly sophisticated and complex technical indicator that is designed to provide a more accurate and reliable representation of price trends. While it may be difficult for novice traders to understand and use effectively, experienced traders and analysts may find the T3MA to be a valuable tool in their trading toolbox.
What is CCI?
he Commodity Channel Index (CCI) is a technical analysis indicator that was developed by Donald Lambert in 1980. It's primarily used to identify overbought and oversold conditions in the market, as well as trend direction and potential price reversals.
The CCI is calculated by taking the difference between the typical price (the average of the high, low, and close prices) and a moving average of the typical price over a certain period of time. This difference is then divided by a factor based on the average deviation of the typical price from the moving average.
The formula for the CCI is:
CCI = (Typical Price - 20-period SMA of Typical Price) / (0.015 x Mean Deviation)
Where:
Typical Price = (High + Low + Close) / 3
SMA = Simple Moving Average
Mean Deviation = Average of the absolute value of the difference between the Typical Price and the SMA over the last 20 periods.
The CCI is usually displayed as a line chart that oscillates around a centerline of zero. Readings above zero indicate that the typical price is above the moving average, while readings below zero indicate that the typical price is below the moving average.
Traders typically use the CCI to identify overbought and oversold conditions in the market. When the CCI rises above a certain level (e.g., +100), it's considered overbought, indicating that the price may be due for a correction or reversal. When the CCI falls below a certain level (e.g., -100), it's considered oversold, indicating that the price may be due for a bounce or reversal.
The CCI can also be used to identify potential trend reversals. When the CCI crosses above or below the zero line, it can signal a potential change in trend. For example, if the CCI crosses above the zero line, it could indicate that a bullish trend is emerging, while a cross below the zero line could indicate that a bearish trend is emerging.
Overall, the Commodity Channel Index is a useful technical analysis tool for identifying overbought and oversold conditions, as well as potential trend reversals in the market. However, like all technical indicators, it should be used in conjunction with other forms of analysis and risk management techniques to make informed trading decisions.
What is the T3-based CCI?
T3-based CCI uses T3 smoothing to reduce fasle signals and improved the signal of the regular CCI.
Requirements
Inputs
Confirmation 1 and Solo Confirmation: GKD-V Volatility / Volume indicator
Confirmation 2: GKD-C Confirmation indicator
Outputs
Confirmation 2 and Solo Confirmation Complex: GKD-E Exit indicator
Confirmation 1: GKD-C Confirmation indicator
Continuation: GKD-E Exit indicator
Solo Confirmation Simple: GKD-BT Backtest strategy
Additional features will be added in future releases.

MME MTF CCIHi All,
This is a Dual/Multi TF CCI script to be used for Intraday as well as positional system.
Intraday:
Chart TF : 5 mins
Underlying Trend CCI : CCI 34 of 30 mins TF
Immediate Trend CCI : CCI 34 of 5 mins TF
Execution CCI : CCI 8 of 5 mins TF
The CCIs are used for entry, exit during momentum breakouts or pullbacks.
General Long Setup:
Buy at CCI-8 5m below -135, when CCI-34 30 mins is > +100. Long exit when CCI 34 5 min < -60
General Short Setup:
Sell at CCI-8 5m above -135, when CCI-34 30 mins is < -100. Short exit when CCI 34 5 min > +60
The same CCI settings can be used for positional or investment per appropriate timeframes one is interested to trade, along with HTF above in ratio 1:5.
Hope its helpful!

Simple CCI Spotter™TradeChartist Simple CCI Spotter is an elegant version of the classic CCI indicator and helps spot price trends using visually engaging and appealing CCI plot and background. The Bull and the Bear background fills are highly useful for traders who like to visually understand areas of entry and exit based on CCI .
===================================================================================================================
What does Simple CCI Spotter do?
Plots CCI with visually engaging colours for Bull and Bear zones (Green and Red) with optional background fill.
Plots CCI coloured bars on main chart based on user preferred Upper and Lower CCI bands (Default - 25/-25).
Plots CCI based on EMA smoothing (1 for Regular CCI without smoothing).
Plots Heikin Ashi CCI if enabled from indicator settings.
Plots CCI highs of Bull Zone and RSI lows of Bear Zone. Helps visually spot divergences.
===================================================================================================================
Note:
Default Settings:
5 period EMA Smoothed CCI .
For Heikin Ashi CCI on normal bars, enable ᴜsᴇ ʜᴇɪᴋɪɴ ᴀsʜɪ ᴄᴄɪ and change EMA CCI sᴍᴏᴏᴛʜɪɴɢ to 1.
===================================================================================================================
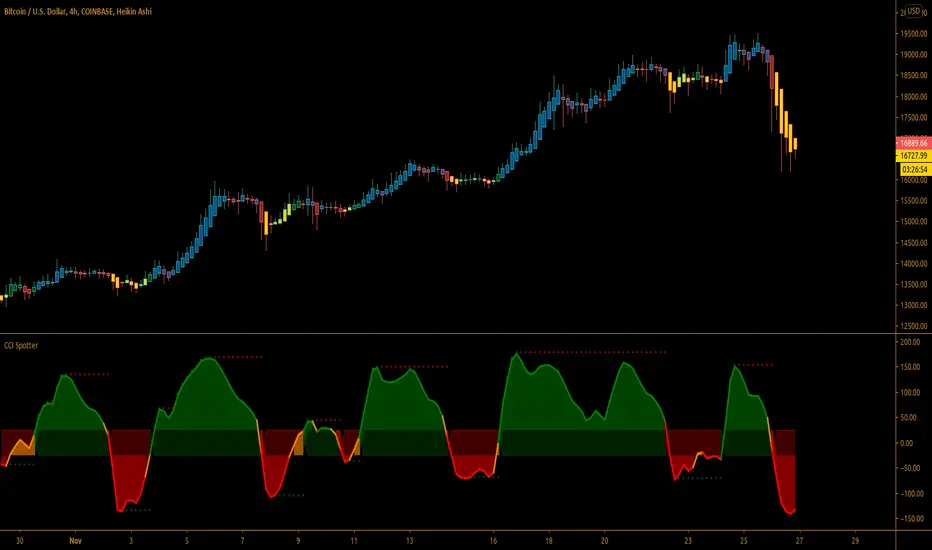
BossHouse - CCI ExtendedBossHouse - CCI Extended ( An Extended version of the Original CCI ).
The commodity channel index (CCI) is an oscillator originally introduced by Donald Lambert in 1980.
Guideline
________
Lambert's trading guidelines for the CCI focused on movements above +100 and below −100 to generate buy and sell signals. Because about 70 to 80 percent of the CCI values are between +100 and −100, a buy or sell signal will be in force only 20 to 30 percent of the time. When the CCI moves above +100, a security is considered to be entering into a strong uptrend and a buy signal is given. The position should be closed when the CCI moves back below +100. When the CCI moves below −100, the security is considered to be in a strong downtrend and a sell signal is given. The position should be closed when the CCI moves back above −100.
Since Lambert's original guidelines, traders have also found the CCI valuable for identifying reversals. The CCI is a versatile indicator capable of producing a wide array of buy and sell signals.
CCI can be used to identify overbought and oversold levels. A security would be deemed oversold when the CCI dips below −100 and overbought when it exceeds +100. From oversold levels, a buy signal might be given when the CCI moves back above −100. From overbought levels, a sell signal might be given when the CCI moved back below +100.
As with most oscillators, divergences can also be applied to increase the robustness of signals. A positive divergence below −100 would increase the robustness of a signal based on a move back above −100. A negative divergence above +100 would increase the robustness of a signal based on a move back below +100.
Trend line breaks can be used to generate signals. Trend lines can be drawn connecting the peaks and troughs. From oversold levels, an advance above −100 and trend line breakout could be considered bullish. From overbought levels, a decline below +100 and a trend line break could be considered bearish.
Settings
_______
Show 0 line
Lenght
Source
Any help and suggestions will be appreciated.
Marcos Issler @ Isslerman
marcos@bosshouse.com.br

Alex's Dikfat Velocity 2hr CCI Color SignalerAlex's Dikfat Velocity 2hr CCI Color Signaler
As most traders have experienced at one time or another, over bought and oversold readings are relative in nature and do not always work as a standalone reading.
Momentum indicators such as the Commodity Channel Index ( CCI ) have to be understood and read correctly to determine the value in a momentum reading.
When an asset is "Overbought" or "Oversold" the reading can remain in this region Irrationally for extended periods as the market remains in irrational trend.
In order to better understand this and other readings on a momentum indicator clues such as divergence, exhaustion, continuation, time and frequency as well as the actual velocity of the movement must be measured. In addition, there are very specific measurement lines on the CCI that must be read and that can reject or break and result in the asset either loosing or gaining momentum in one direction or the other. These are the dashed lines in the background.
For the purposes of this Indicator, the actual function, characterization and use of CCI will not be explained here as the colored indications themselves will do all the work for you.
It is very important to know that the calculations used to signal the color filling ARE NOT based on simple breaks of the dashed background lines as traditionally read with a CCI indicator.
The calculations used in this Indicator are based on a very fine tuned mathematical algorithm that measure an unseen element within the CCI . When the VELOCITY of a move in momentum is met, the color fills will begin. When the VELOCITY of the move changes, so to will colorization. This has led to some of the best High Probability Long and Short Sale signaling in any CCI indicator. Pairing this with your favorite chart indicators and personal analysis will result in high tradability but can also be used stand alone.
Remember: No one single indicator should ever be used to determine market signaling.
A basic understanding of a CCI indicator is recommended before using this indicator.
This indicator and the proprietary calculations used were built and meant to be used on the 2 Hour Timeframe. The indicator is open to all time frames and accuracy increases as the time frame increases.
It is recommended that if you use this indicator on a lower timeframe, to pull CCI readings from a higher Timeframe as found in the settings.
This indicator signals long and short opportunities. High Probability long and short trades, bullish and bearish divergence building, market time traps and bullish / bearish continuation as well as exhaustion of these moves.
There is also a companion indicator which will signal the High Probability Long and Short trades on the candle chart called "Alex's Dikfat CCI Equity Signaler" Which will place white Triangles on the candle chart showing high probability long entries and Orange Triangles for High Probability short entries. These are also built into the CCI line and can be turned on in this indicator.
Color Code:
Bullish Continuation: (Background Color Black)
The function of the black background colorization is to alert the user that a bullish move has begun and is currently in a strong continuation period. the longer the black background color draws, the more sustained or trending up the current move is. When these background lines begin to break and start to appear as more frequent broken background lines, exhaustion in the move can be assumed. When the black stops drawing all together, the strength of the continuation move is gone.
Bearish Continuation: (Background Color Fuchsia)
The function of the fuchsia background colorization is to alert the user that a bearish move has begun and is currently in a strong continuation period. the longer the fuchsia background color draws, the more sustained or trending down the current move is. When these background lines begin to break and start to appear as more frequent broken background lines, exhaustion in the move can be assumed. When the fuchsia stops drawing all together, the strength of the continuation move is gone.
High Probability Long/Short:
These buy and sell opportunities were designed to give a trader the best signal/entry on a Long or a Short with the highest probability of making a large and typically sustained impulse move.
High Probability Long: (White Color Fill)
The High Probability Long is a signal to BUY with the best possible entry on an a pending large impulse move to the upside. When White begins to fill, The long is extremely likely. The signal is confirmed on the close of the following candle after white begins to draw unless an opposing color immediately follows, or white dips below the zero line. White will always usually start just below the zero line in the highest probability scenarios.
High Probability Short: (Orange Color Fill)
The High Probability Short is a signal to SELL SHORT with the best possible entry on a pending large impulse move to the downside. When Orange begins to fill, The Short is extremely likely. The signal is confirmed on the close of the following candle after orange begins to draw unless an opposing color immediately follows. Some of the best entries for Orange are when it starts at the END of a black stripe in the background and better so when Orange dips below zero for entry. The signal was designed to color early enough to get in a short during consolidation before the move.
Long and Short Opportunities: Long and Short opportunities are just as they sound. Coloring will signal green for a long opportunity and red for a short opportunity. These opportunities are not always guaranteed and usually result in an lesser impulse move in one direction with a shorter duration.
Long Opportunity: (Green)
The Long Opportunity is a signal that a Long is possible however with less likely odds of a larger more sustained move. When Green begins to fill, a long opportunity is available. The signal is confirmed on the close of the following candle after green begins to draw unless an opposing color immediately follows, or green dips below the zero line. Green will always usually start just above the zero line and have the best opportunities at the end of Bullish Divergence (Blue) at the end of Bearish Continuation (Fuchsia) or a non filled CCI .
Short Opportunity: (Red)
The Short Opportunity is a signal that a Short is possible however with less likely odds of a larger more sustained move. When Red begins to fill, a short opportunity is available. The signal is confirmed on the close of the following candle after red begins to draw unless an opposing color immediately follows. Some of the best entries for Red are when it starts at the END of a black stripe in the background (higher odds than other red signaling). The signal was designed to color early enough to get in a short during consolidation before the move and better so if orange develops after red.
Bullish Divergence: (Dark Blue)
Dark Blue colors when Bullish Divergence is detected. Bullish divergence is a signal that momentum is building higher within the asset for an up move while price action in the candle chart makes lower lows. Bullish Divergence is not a signal to buy or sell but rather a sign post to say WAIT. Bullish divergence is building and a Long is coming. Some traders will buy bullish divergence in anticipation of a move and is only equitable if you have the cash and resolve to follow it through for as long as it is developing. Buying or selling divergence right away is not always the best practice unless a hard dip below all momentum lines followed by an immediate buy signal from white or green resulting in a drop base rally.
Bearish Divergence: (Dark Maroon)
Dark Maroon colors when Bearish Divergence is detected. Bearish divergence is a signal that momentum is dropping out of the asset for a move lower while price action in the candle chart makes higher highs. Bearish Divergence is not a signal to buy or sell but rather a sign post to say WAIT. Bearish divergence is building and a Short is coming. Some traders will sell bearish divergence in anticipation of a move and is only equitable if you have the cash and resolve to follow it through for as long as it is developing. Buying or selling divergence right away is not always the best practice unless a hard rip above all momentum lines followed by an immediate sell signal from red or orange resulting in a rally base drop.
No Color Fill:
When CCI has no color fill whatsoever it is telling the trader there are no high velocity movements in momentum in any direction. Best practice is to do nothing and wait out the Time Trap currently on the chart until signaling develops.
Time and Frequency:
Time and frequency is notable throughout the indicator. First and foremost when CCI is not being filled it is best practice to do nothing as there is NO Velocity of Movement within the asset at that time. This is one of the most obvious of Time Traps.
Bullish and Bearish Divergence is also a type of Time Trap. The longer these develop, the more weak hands are shaken out of the market and derivatives traders have their premium burned. Best practice with divergences is also to wait until adequate signaling develops, or be willing to buy or sell the appropriate divergence by accumulating or distributing for as long as it develops; or simply to buy/sell and hold for the move.
Any Sustained color for extended periods of time is also a time trap signaling to the trader that the asset is being irrational in its present move.
Bullish and Bearish Continuation:
These also deal with time and frequency most importantly. When we are on a sustained Bull Run, black will color in the background continuously. When the black starts to barcode or break up, exhaustion of the bull run is assumed as the frequency of the run becomes erratic. Inversely, When we are on a sustained Bear Run, fuchsia will color in the background continuously. When the fuchsia starts to barcode or break up, exhaustion of the bear run is assumed as the frequency of the run becomes erratic.
The color scheme is designed to be read from darkest to lightest when a sequence of events is found. I.E Dark Maroon>Red>Orange or Inversely Dark Blue>Green>White
In keeping with the best practices and traditions of TradingView, we have published this as a public script with the best intentions of aiding the TradingView community in unique and valuable ways. While some of our best indicators are by invite only, we feel an addition to the community of this magnitude will add to the fabric and substance of community.

MTF Commodity Oddity Index (CCI+)MTF Commodity Oddity Index (CCI+)
This chart overlay indicator is based upon the Commodity Channel Index (CCI) and can signal multiple triple-timeframe CCI overbought and oversold confluences directly onto your chart, intended for use as a confluence either for reversal trade entries, or potential trade exits, indicating where price may be probable to reverse.
Features include:
- Primary set of fully configurable triple-timeframe overbought and oversold signals, indicating where 3 selected timeframes are all overbought or all oversold at the same time. Enabled by default.
- Secondary set of fully configurable triple-timeframe overbought and oversold signals, indicating where 3 selected timeframes are all overbought or all oversold at the same time. Enabled by default.
- Optional drawing of background colours and/or ribbon seen at bottom of the chart image.
- The default primary MTF #1 timeframes are set to 1 minute, 5 minute and 15 minute. These are highly suitable for low timeframe scalpers trading on < 5m charts, and can often pin point price reversals.
- The default Secondary MTF #2 timeframes are set to 15 minute, 30 minute and 120 minute. These are suitable for both low timeframe scalpers and considerably higher timeframe traders.
- Independent alerts for MTF #1 and MTF #2 triple-timeframe confluences, including options for alerting MTF overbought and MTF oversold individually, as well as an option for alerting either overbought or oversold in a single combined alert.
- Also includes standard configurable CCI options, including CC length and source type.
Note: The features listed above are accurate at the time of publishing but maybe updated or added to in future.
A similar MTF CCI indicator is also available as a panel indicator here .
This indicator is based upon the original MTF Fantastic Stochastic (FS+) available here .
What is the Commodity Channel Index (CCI)?
Investopedia has described the popular oscillator as follows:
“The Commodity Channel Index (CCI) is a momentum-based oscillator used to help determine when an investment vehicle is reaching a condition of being overbought or oversold.
Developed by Donald Lambert, this technical indicator assesses price trend direction and strength, allowing traders to determine if they want to enter or exit a trade, refrain from taking a trade, or add to an existing position. In this way, the indicator can be used to provide trade signals when it acts in a certain way.”
You can read more about the CCI , its use cases and calculations here .
How do traders use overbought and oversold levels in their trading?
The oversold level, that is traditionally when the CCI is above the 100 level is typically interpreted as being 'overbought', and below the -100 level is typically considered 'oversold'. Traders will often use the CCI at an overbought level as a confluence for entry into a short position, and the CCI at an oversold level as a confluence for an entry into a long position. These levels do not mean that price will necessarily reverse at those levels in a reliable way, however. This is why this version of the CCI employs the triple timeframe overbought and oversold confluence, in an attempt to add a more confluence and reliability to this usage of the CCI . While traditionally, the overbought and oversold levels are below -100 for oversold, and above 100 for overbought, the default threshold settings of this indicator have been increased to provide fewer, stronger signals, especially suited to the low timeframes and highly volatile assets.

Double CCIThe Commodity Channel Index (CCI) is a momentum oscillator used in technical analysis primarily to identify overbought and oversold levels by measuring an instrument's variations away from its statistical mean. Besides overbought/oversold levels, CCI is often used to find reversals as well as divergences. Originally, the indicator was designed to be used for identifying trends in commodities, however it is now used in a wide range of financial instruments.
There are several steps involved in calculating the CCI. The following example is for a typical 14 Period CCI:
CCI = (Typical Price - 14 Period SMA of TP) / (.015 x Mean Deviation)
Typical Price (TP) = (High + Low + Close)/3
Constant = .015
The Constant is set at .015 for scaling purposes. By including the constant, the majority of CCI values will fall within the 100 to -100 range.
Mean Deviation:
1) Subtract the most recent 14 Period Simple Moving from each typical price (TP) for the Period.
2) Sum these numbers strictly using absolute values.
3) Divide the value generated in step 2 by the total number of Periods (14 in this case).
Overbought and Oversold conditions can be used in their more traditional sense to identify future reversals . Remember true overbought/oversold thresholds values can and often do vary between instruments.
During a Bullish Trend , price crossing above the overbought threshold may indicate strong confidence in the move and price will continue to rise.
During a Bearish Trend , price crossing below the oversold threshold may indicate strong confidence in the move and price will continue to fall.
The first option is a modified CCI indicator that uses the "Arnaud Legoux Moving Average" instead of the SMA, and the source uses the VWAP instead of the HLC3. Added to this version an option to calculate CCI with different types of moving averages:
Green dots mean they are overbought
Orange dots mean they are oversold
Added a "SuperTrend Background" based on the modified CCI indicator:
Bull event = CCI crossing over the 0 line
Bear event = CCI crossing below the 0 line
Added a signal as EMA (modified CCI, signal length)
The second option is a standard CCI indicator that shows a coloured histogram of important levels, giving a good visual of the CCI levels. Added to this version is an extra coloured level +/-200 and an option to use Traditional CCI calculations according to user @JustUncleL
LEVELS:
Aqua: Greater than 200.
Lavender: Greater than 100 and less than 200.
Dark Lavender: Greater than 0 and less than 100.
Dark Coral: Less than 0 and greater than -100.
Coral: Less than -100 and greater than -200.
Light Red: Less than -200.
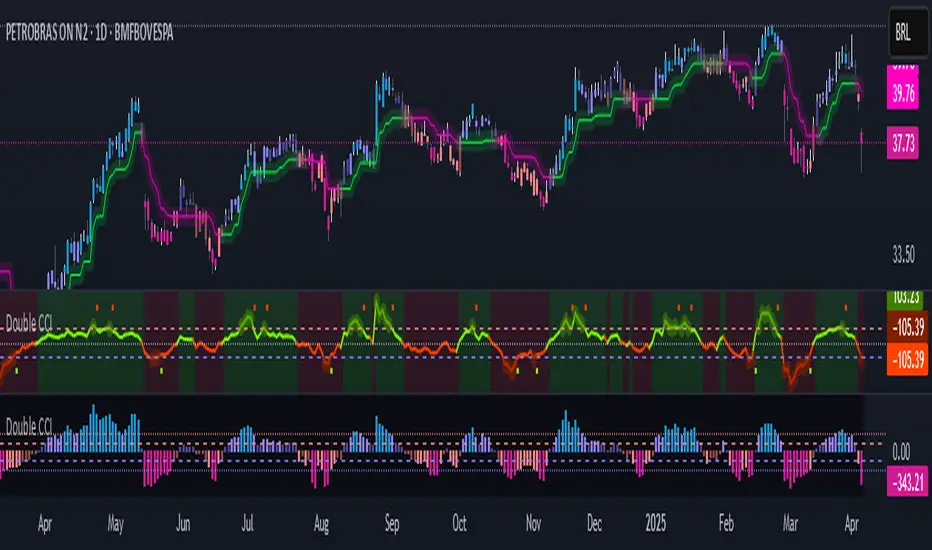
Trinity CCI Pro PlusWhat It Is
Trinity CCI Pro Plus is an innovative overlay indicator that reimagines the classic Commodity Channel Index (CCI) by plotting its levels directly on the price chart. No more separate oscillator panel—instead, you get dynamic price-based bands and lines for instant momentum insights.
What You See on the Chart
Orange line: The CCI zero line (20-period SMA of typical price, hlc3)—acts as the baseline.
Aqua line: Dynamic upper band at CCI = +100 (overbought threshold).
Purple line: Dynamic lower band at CCI = -100 (oversold threshold).
Optional thick purple line: The extra SMA of CCI (14-period smooth) scaled back to price—serves as a signal line for crossovers.
Optional outer zones: ±200 bands (aqua/purple extensions) for extreme momentum levels, often added as dotted or filled areas to spot blow-off tops/bottoms.
Key Differences from Regular CCI
Standard CCI lives in a lower pane with fixed horizontal lines at +100, 0, and -100, forcing you to split your focus. This version overlays everything on price: the bands curve with market volatility, the zero line becomes a moving average, and the extra SMA/signal line integrates seamlessly for price-action trading. Plus, it naturally supports outer ±200 zones without extra coding, making extremes visually pop.
How Traders Use It
Momentum breakouts: Buy when price closes above the +100 aqua band (or +200 for aggressive entries); sell below -100 purple (or -200).
Mean reversion: Fade touches on the bands—take profits if price rejects the +100/-100 levels, or watch for exhaustion at ±200.
Trend bias: Price above orange zero = bullish filter; below = bearish. Use the extra SMA for confirmation (e.g., price crossing above it signals upside).
Crossover signals: Price vs. the thick purple SMA line—bullish above, bearish below—pairs perfectly with band breaks.
Range trading: Treat ±100 bands as dynamic support/resistance; outer ±200 zones highlight potential breakout setups.
This setup shines in trending markets (e.g., stocks or forex on 1H/daily charts), turning CCI into a one-glance channel system. Start with the defaults, add the ±200 and extra SMA via simple code tweaks, and backtest for your style—it's versatile and reduces screen clutter dramatically.
More Info
The 20 period MA is the original and still the most common setting for CCI, and it is exactly what the creator of the CCI, Donald Lambert, published it in 1980 with these exact parameters:
Length: 20 periods
Constant: 0.015 (to make CCI fall between +100 and –100 about 70–80 % of the time)
Typical Price: hlc3 (or sometimes (high + low + close)/3)
Deviation measure: Mean Deviation (not standard deviation)
So the “Trinity CCI Pro Plus” you are using is 100 % faithful to Lambert’s original design when the length is set to 20.

Enhanced CCI with Trend FiltersThis indicator combines the power of the Commodity Channel Index (CCI) with adaptive trend filters and divergence detection to identify high-probability trading opportunities. It's designed to reduce false signals by incorporating trend direction and divergence confirmation.
🔍 How It Works:
1. Trend Detection:
- Uses an adaptive Simple Moving Average (SMA) that automatically adjusts between daily and weekly timeframes
- Daily mode: Default 200 SMA for longer-term trend
- Weekly mode: Default 40 SMA for broader market perspective
- Trend direction is determined by comparing current SMA value to its previous value
2. CCI Component:
- Traditional CCI calculation with customizable length (default: 20)
- Adjustable overbought (default: +100) and oversold (default: -100) levels
- Color-coded CCI line for quick visual reference:
* Green: Overbought and rising
* Red: Oversold and falling
* Gray: Neutral zone
3. Signal Generation:
- Buy Signal (Green Background):
* CCI crosses above oversold level AND
* Main trend is confirmed bullish (rising SMA)
- Sell Signal (Red Background):
* CCI crosses below overbought level AND
* Main trend is confirmed bearish (falling SMA)
4. Divergence Detection:
- Automatically identifies bullish and bearish divergences
- Bullish Divergence: Price makes lower low while CCI makes higher low
- Bearish Divergence: Price makes higher high while CCI makes lower high
- Visualized with distinct markers on the CCI line
- Can be used to set up alerts for divergence confirmations
⚙️ Customization Options:
- CCI calculation length and price source
- Overbought/Oversold levels
- SMA lengths for daily and weekly modes
- Divergence lookback period
- Signal colors and visualization settings
🔔 Alert Capabilities:
- Set alerts for CCI crossovers of overbought/oversold levels
- Create divergence detection alerts
- Configure trend change notifications
- Combine multiple conditions for complex alert strategies
💡 Trading Tips:
- Combine divergence signals with trend direction for better accuracy
- Wait for signal confirmation before entering trades
- Use additional indicators or price action for exit decisions
This indicator helps traders identify potential trend reversals while keeping them aligned with the main market trend. Perfect for both trend following and counter-trend strategies when used appropriately.
Tags: CCI, trend following, divergence, momentum, signals, SMA, multi-timeframe, technical analysis, trend filter, oversold, overbought
Note: Past performance does not guarantee future results. Always combine with proper risk management.
