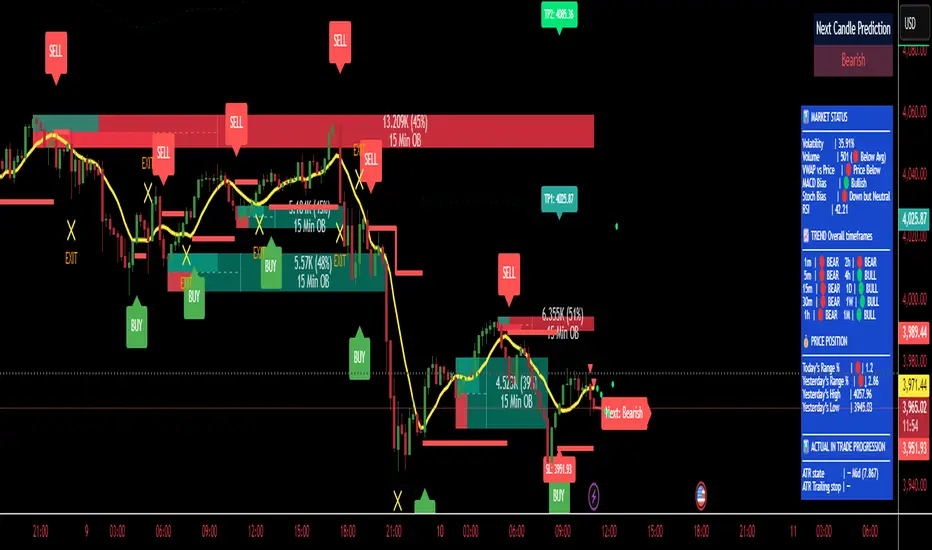
Empire OS Trading Fully Automated Prop Firm Ready💎 Prop-Firm-Ready Momentum System v3 — The Gold-Mine Algorithm 💎
Engineered for the same standards that top prop firms demand — minimal drawdown, consistent equity growth, and precision-based execution. This isn’t a basic indicator; it’s a refined momentum engine built for traders who scale capital and manage risk like professionals.
Performance Snapshot
• Profit Factor 2.26 • Win Rate 33 % • Max Drawdown 0.9 % • Total P/L + $447 • W/L Ratio 4.6 : 1
Stress-tested on Gold (XAUUSD) across live-market conditions, it stays composed under volatility and delivers structured, data-driven consistency.
⚡ See it. Test it. Scale it.
Built for prop-firm precision — from $10 K to $300 K and beyond.
ابحث في النصوص البرمجية عن "GOLD"

Bobs Gold and Red LinesThis indicator plots a normal 9 EMA corresponding to the current time frame, ie Bob's 1 min 9 ema Gold Line.
It also plots a 5 min 21 SMA (Bob's Red Line) on the 1 min chart. It actually plots the 5 min redline on timeframes other than the 1 min chart as well.
In other words, this will plot the actual 5 min 21 SMA whether you are on the 1 min, 5 min, or other time frames. I created this instead of having to use the workaround of a 105 SMA on the 1 min chart or having a separate 5 min chart open when trading Bob's 1 min strategies.
On the 1 min chart you will notice the red line typically makes a stairstep effect, that is because it is a 5 min SMA being plotted on the 1 min chart. The right hand end point should still perfectly match the current 5 min SMA price. I have been testing / using this script for several months.
I have noticed that the ema and sma on my tradovate charts do not perfectly match my tradingview charts, even just using the normal tradingview moving averages, however from what I can see on Bob's charts Tradingview seems to be close to the same as on Bob's Ninja charts. I have not started using Ninja yet, but plan to soon then I can compare apples to apples.
I made a few changes in names, etc before I published this script today, so hopefully I didn't inadvertently break anything. So let me know if you find anything off or not working as expected.

Smart MACD Volume Trader# Smart MACD Volume Trader
## Overview
Smart MACD Volume Trader is an enhanced momentum indicator that combines the classic MACD (Moving Average Convergence Divergence) oscillator with an intelligent high-volume filter. This combination significantly reduces false signals by ensuring that trading signals are only generated when price momentum is confirmed by substantial volume activity.
The indicator supports over 24 different instruments including major and exotic forex pairs, precious metals (gold and silver), energy commodities (crude oil, natural gas), and industrial metals (copper). For forex and commodity traders, the indicator automatically maps to CME and COMEX futures contracts to provide accurate institutional-grade volume data.
## Originality and Core Concept
Traditional MACD indicators generate signals based solely on price momentum, which can result in numerous false signals during low-activity periods or ranging markets. This indicator addresses this critical weakness by introducing a volume confirmation layer with automatic institutional volume integration.
**What makes this approach original:**
- Signals are triggered only when MACD crossovers coincide with elevated volume activity
- Implements a lookback mechanism to detect volume spikes within recent bars
- Automatically detects and maps 24+ forex pairs and commodities to their corresponding CME and COMEX futures contracts
- Provides real institutional volume data for forex pairs where spot volume is unreliable
- Combines two independent market dimensions (price momentum and volume) into a single, actionable signal
- Includes intelligent asset detection that works across multiple exchanges and ticker formats
**The underlying principle:** Volume validates price movement. When institutional money enters the market, it creates volume signatures. By requiring high volume confirmation and using actual institutional volume data from futures markets, this indicator filters out weak price movements and focuses on trades backed by genuine market participation. The automatic futures mapping ensures that forex and commodity traders always have access to the most accurate volume data available, without manual configuration.
## How It Works
### MACD Component
The indicator calculates MACD using standard methodology:
1. **Fast EMA (default: 12 periods)** - Tracks short-term price momentum
2. **Slow EMA (default: 26 periods)** - Tracks longer-term price momentum
3. **MACD Line** - Difference between Fast EMA and Slow EMA
4. **Signal Line (default: 9-period SMA)** - Smoothed average of MACD line
**Crossover signals:**
- **Bullish:** MACD line crosses above Signal line (momentum turning positive)
- **Bearish:** MACD line crosses below Signal line (momentum turning negative)
### Volume Filter Component
The volume filter adds an essential confirmation layer:
1. **Volume Moving Average** - Calculates exponential MA of volume (default: 20 periods)
2. **High Volume Threshold** - Multiplies MA by ratio (default: 2.0x or 200%)
3. **Volume Detection** - Identifies bars where current volume exceeds threshold
4. **Lookback Period** - Checks if high volume occurred in recent bars (default: 5 bars)
**Signal logic:**
- Buy/Sell signals only trigger when BOTH conditions are met:
- MACD crossover/crossunder occurs
- High volume detected within lookback period
### Automatic CME Futures Integration
For forex traders, spot FX volume data can be unreliable or non-existent. This indicator solves this problem by automatically detecting forex pairs and mapping them to corresponding CME futures contracts with real institutional volume data.
**Supported Major Forex Pairs (7):**
- EURUSD → CME:6E1! (Euro FX Futures)
- GBPUSD → CME:6B1! (British Pound Futures)
- AUDUSD → CME:6A1! (Australian Dollar Futures)
- USDJPY → CME:6J1! (Japanese Yen Futures)
- USDCAD → CME:6C1! (Canadian Dollar Futures)
- USDCHF → CME:6S1! (Swiss Franc Futures)
- NZDUSD → CME:6N1! (New Zealand Dollar Futures)
**Supported Exotic Forex Pairs (4):**
- USDMXN → CME:6M1! (Mexican Peso Futures)
- USDRUB → CME:6R1! (Russian Ruble Futures)
- USDBRL → CME:6L1! (Brazilian Real Futures)
- USDZAR → CME:6Z1! (South African Rand Futures)
**Supported Cross Pairs (6):**
- EURJPY → CME:6E1! (Uses Euro Futures)
- GBPJPY → CME:6B1! (Uses British Pound Futures)
- EURGBP → CME:6E1! (Uses Euro Futures)
- AUDJPY → CME:6A1! (Uses Australian Dollar Futures)
- EURAUD → CME:6E1! (Uses Euro Futures)
- GBPAUD → CME:6B1! (Uses British Pound Futures)
**Supported Precious Metals (2):**
- Gold (XAUUSD, GOLD) → COMEX:GC1! (Gold Futures)
- Silver (XAGUSD, SILVER) → COMEX:SI1! (Silver Futures)
**Supported Energy Commodities (3):**
- WTI Crude Oil (USOIL, WTIUSD) → NYMEX:CL1! (Crude Oil Futures)
- Brent Oil (UKOIL) → NYMEX:BZ1! (Brent Crude Futures)
- Natural Gas (NATGAS) → NYMEX:NG1! (Natural Gas Futures)
**Supported Industrial Metals (1):**
- Copper (COPPER) → COMEX:HG1! (Copper Futures)
**How the automatic detection works:**
The indicator intelligently identifies the asset type by analyzing:
1. Exchange name (FX, OANDA, TVC, COMEX, NYMEX, etc.)
2. Currency pair pattern (6-letter codes like EURUSD, GBPUSD)
3. Commodity identifiers (XAU for gold, XAG for silver, OIL for crude)
When a supported instrument is detected, the indicator automatically switches to the corresponding futures contract for volume analysis. For stocks, cryptocurrencies, and other assets, the indicator uses the native volume data from the current chart.
**Visual feedback:**
An information table appears in the top-right corner of the MACD pane showing:
- Current chart symbol
- Exchange name
- Currency pair or asset name
- Volume source being used (highlighted in orange for futures, yellow for native volume)
- Current high volume status
This provides complete transparency about which data source the indicator is using for its volume analysis.
## How to Use
### Basic Setup
1. Add the indicator to your chart
2. The indicator displays in a separate pane (MACD) and overlay (signals/volume bars)
3. Default settings work well for most assets, but can be customized
### Signal Interpretation
### Visual Signals
**Visual Signals:**
- **Green "BUY" label** - Bullish MACD crossover confirmed by high volume
- **Red "SELL" label** - Bearish MACD crossunder confirmed by high volume
- **Green/Red candles** - Highlight bars with volume exceeding the threshold
- **Light green/red background** - Emphasizes signal bars on the chart
**Information Table:**
A detailed information table appears in the top-right corner of the MACD pane, providing real-time transparency about the indicator's operation:
- **Chart:** Current symbol being analyzed
- **Exchange:** The exchange or data feed being used
- **Pair:** The currency pair or asset name extracted from the ticker
- **Volume From:** The actual symbol used for volume analysis
- Orange color indicates CME or COMEX futures are being used (automatic institutional volume)
- Yellow color indicates native volume from the chart symbol is being used
- Hover tooltip shows whether automatic futures mapping is active
- **High Volume:** Current status showing YES (green) when volume exceeds threshold, NO (gray) otherwise
This table ensures complete transparency and allows you to verify that the correct volume source is being used for your analysis.
**Volume Analysis:**
- Gray histogram bars = Normal volume
- Red histogram bars = High volume (exceeds threshold)
- Green line = Volume moving average baseline
**MACD Analysis:**
- Blue line = MACD line (momentum indicator)
- Orange line = Signal line (trend confirmation)
- Gray dotted line = Zero line (bullish above, bearish below)
### Parameter Customization
**MACD Parameters:**
- Adjust Fast/Slow EMA lengths for different sensitivities
- Shorter periods = More signals, faster response
- Longer periods = Fewer signals, less noise
**Volume Parameters:**
- **Volume MA Period:** Higher values smooth volume analysis
- **High Volume Ratio:** Lower values (1.5x) = More signals; Higher values (3.0x) = Fewer, stronger signals
- **Volume Lookback Bars:** Controls how recent the volume spike must be
**Direction Filters:**
- **Only Buy Signals:** Enables long-only strategy mode
- **Only Sell Signals:** Enables short-only strategy mode
### Alert Configuration
The indicator includes three alert types:
1. **Buy Signal Alert** - Triggers when bullish signal appears
2. **Sell Signal Alert** - Triggers when bearish signal appears
3. **High Volume Alert** - Triggers when volume exceeds threshold
To set up alerts:
1. Click the indicator name → "Add alert on Smart MACD Volume Trader"
2. Select desired alert condition
3. Configure notification method (popup, email, webhook, etc.)
## Trading Strategy Guidelines
### Best Practices
**Recommended markets:**
- Liquid stocks (large-cap, high daily volume)
- Major forex pairs (EURUSD, GBPUSD, USDJPY, AUDUSD, USDCAD, USDCHF, NZDUSD)
- Exotic forex pairs (USDMXN, USDRUB, USDBRL, USDZAR)
- Cross pairs (EURJPY, GBPJPY, EURGBP, AUDJPY, EURAUD, GBPAUD)
- Precious metals (Gold, Silver with automatic COMEX futures mapping)
- Energy commodities (Crude Oil, Natural Gas with automatic NYMEX futures mapping)
- Industrial metals (Copper with automatic COMEX futures mapping)
- Major cryptocurrency pairs
- Index futures and ETFs
**Timeframe recommendations:**
- **Day trading:** 5-minute to 15-minute charts
- **Swing trading:** 1-hour to 4-hour charts
- **Position trading:** Daily charts
**Risk management:**
- Use signals as entry confirmation, not standalone strategy
- Combine with support/resistance levels
- Consider overall market trend direction
- Always use stop-loss orders
### Strategy Examples
**Trend Following Strategy:**
1. Identify overall trend using higher timeframe (e.g., daily chart)
2. Trade only in trend direction
3. Use "Only Buy" filter in uptrends, "Only Sell" in downtrends
4. Enter on signal, exit on opposite signal or at resistance/support
**Volume Breakout Strategy:**
1. Wait for consolidation period (low volume, tight MACD range)
2. Enter when signal appears with high volume (confirms breakout)
3. Target previous swing highs/lows
4. Stop loss below/above recent consolidation
**Forex Scalping Strategy (with automatic CME futures):**
1. The indicator automatically detects forex pairs and uses CME futures volume
2. Trade during active sessions only (use session filter)
3. Focus on quick profits (10-20 pips)
4. Exit at opposite signal or profit target
**Commodities Trading Strategy (Gold, Silver, Oil):**
1. The indicator automatically maps to COMEX and NYMEX futures contracts
2. Trade during high-liquidity sessions (overlap of major markets)
3. Use the high volume confirmation to identify institutional entry points
4. Combine with key support and resistance levels for entries
5. Monitor the information table to confirm futures volume is being used (orange color)
6. Exit on opposite MACD signal or at predefined profit targets
## Why This Combination Works
### The Volume Advantage
Studies consistently show that price movements accompanied by high volume are more likely to continue, while low-volume movements often reverse. This indicator leverages this principle by requiring volume confirmation.
**Key benefits:**
1. **Reduced False Signals:** Eliminates MACD whipsaws during low-volume consolidation
2. **Confirmation Bias:** Two independent indicators (price momentum + volume) agreeing
3. **Institutional Alignment:** High volume often indicates institutional participation
4. **Trend Validation:** Volume confirms that price momentum has "conviction"
### Statistical Edge
By combining two uncorrelated signals (MACD crossovers and volume spikes), the indicator creates a higher-probability setup than either signal alone. The lookback mechanism ensures signals aren't missed if volume spike slightly precedes the MACD cross.
## Supported Exchanges and Automatic Detection
The indicator includes intelligent asset detection that works across multiple exchanges and ticker formats:
**Forex Exchanges (Automatic CME Mapping):**
- FX (TradingView forex feed)
- OANDA
- FXCM
- SAXO
- FOREXCOM
- PEPPERSTONE
- EASYMARKETS
- FX_IDC
**Commodity Exchanges (Automatic COMEX/NYMEX Mapping):**
- TVC (TradingView commodity feed)
- COMEX (directly)
- NYMEX (directly)
- ICEUS
**Other Asset Classes (Native Volume):**
- Stock exchanges (NASDAQ, NYSE, AMEX, etc.)
- Cryptocurrency exchanges (BINANCE, COINBASE, KRAKEN, etc.)
- Index providers (SP, DJ, etc.)
The detection algorithm analyzes three factors:
1. Exchange prefix in the ticker symbol
2. Pattern matching for currency pairs (6-letter codes)
3. Commodity identifiers in the symbol name
This ensures accurate automatic detection regardless of which data feed or exchange you use for charting. The information table in the top-right corner always displays which volume source is being used, providing complete transparency.
## Technical Details
**Calculations:**
- MACD Fast MA: EMA(close, fastLength)
- MACD Slow MA: EMA(close, slowLength)
- MACD Line: Fast MA - Slow MA
- Signal Line: SMA(MACD Line, signalLength)
- Volume MA: Exponential MA of volume
- High Volume: Current volume >= Volume MA × Ratio
**Signal logic:**
```
Buy Signal = (MACD crosses above Signal) AND (High volume in last N bars)
Sell Signal = (MACD crosses below Signal) AND (High volume in last N bars)
```
## Parameters Reference
| Parameter | Default | Description |
|-----------|---------|-------------|
| Volume Symbol | Blank | Manual override for volume source (leave blank for automatic detection) |
| Use CME Futures | False | Legacy option (automatic detection is now built-in) |
| Alert Session | 1530-2200 | Active session time range for alerts |
| Timezone | UTC+1 | Timezone for alert sessions |
| Volume MA Period | 20 | Number of periods for volume moving average |
| High Volume Ratio | 2.0 | Volume threshold multiplier (2.0 = 200% of average) |
| Volume Lookback | 5 | Number of bars to check for high volume confirmation |
| MACD Fast Length | 12 | Fast EMA period for MACD calculation |
| MACD Slow Length | 26 | Slow EMA period for MACD calculation |
| MACD Signal Length | 9 | Signal line SMA period |
| Only Buy | False | Filter to show only bullish signals |
| Only Sell | False | Filter to show only bearish signals |
| Show Signals | True | Display buy and sell labels on chart |
## Optimization Tips
**For volatile markets (crypto, small caps):**
- Increase High Volume Ratio to 2.5-3.0
- Reduce Volume Lookback to 3-4 bars
- Consider faster MACD settings (8, 17, 9)
**For stable markets (large-cap stocks, bonds):**
- Decrease High Volume Ratio to 1.5-1.8
- Increase Volume MA Period to 30-50
- Use standard MACD settings
**For forex (with automatic CME futures):**
- The indicator automatically uses CME futures when forex pairs are detected
- Set appropriate trading session based on your timezone
- Use Volume Lookback of 5-7 bars
- Consider session-based alerts only
- Monitor the information table to verify correct futures mapping
**For commodities (Gold, Silver, Oil, Copper):**
- The indicator automatically maps to COMEX and NYMEX futures
- Increase High Volume Ratio to 2.0-2.5 for metals
- Use slightly higher Volume MA Period (25-30) for smoother analysis
- Trade during active market hours for best volume data
- The information table will show the futures contract being used (orange highlight)
## Limitations and Considerations
**What this indicator does NOT do:**
- Does not predict future price direction
- Does not guarantee profitable trades
- Does not replace proper risk management
- Does not work well in extremely low-volume conditions
**Market conditions to avoid:**
- Pre-market and after-hours sessions (low volume)
- Major news events (volatile, unpredictable volume)
- Holidays and low-liquidity periods
- Extremely low float stocks
## Conclusion
Smart MACD Volume Trader represents a significant evolution of the traditional MACD indicator by combining volume confirmation with automatic institutional volume integration. This dual-confirmation approach significantly improves signal quality by filtering out low-conviction price movements and ensuring traders work with accurate volume data.
The indicator's automatic detection and mapping system supports over 24 instruments across forex, commodities, and metals markets. By intelligently switching to CME and COMEX futures contracts when appropriate, the indicator provides forex and commodity traders with the same quality of volume data that stock traders naturally have access to.
This indicator is particularly valuable for traders who want to:
- Align their entries with institutional money flow
- Avoid getting trapped in false breakouts
- Trade forex pairs with reliable volume data
- Access accurate volume information for gold, silver, and energy commodities
- Combine momentum and volume analysis in a single, streamlined tool
Whether you are day trading stocks, swing trading forex pairs, or positioning in commodities markets, this indicator provides a robust framework for identifying high-probability momentum trades backed by genuine institutional participation. The automatic futures mapping works seamlessly across all supported instruments, requiring no manual configuration or expertise in futures markets.
---
## Support and Updates
This indicator is actively maintained and updated based on user feedback and market conditions. For questions about implementation or custom modifications, please use the comments section below.
**Disclaimer:** This indicator is for educational and informational purposes only. Past performance does not guarantee future results. Always conduct your own analysis and risk management before trading.

CCT Gold Synthetic Market Cap🌎 Gold Synthetic Market Cap
Overview
The Gold Synthetic Market Cap indicator transforms the Gold Spot price (XAU/USD) into a synthetic market capitalization chart, allowing traders and analysts to visualize gold’s total estimated valuation as a global asset — similar to how cryptocurrencies are evaluated by total market cap.
This tool uses the current XAU/USD price multiplied by the total amount of gold ever mined (~210,000 metric tons), automatically converting the result into trillions of US dollars (USD T).
The outcome is a precise and dynamic representation of gold’s real-time market value — displayed as full OHLC candles in a separate chart panel.
🧠 Core Concept
Gold’s price per ounce doesn’t tell the full story of its global valuation.
By converting it to market capitalization, we can compare it to other asset classes such as:
Bitcoin’s total market cap (CRYPTOCAP:BTC)
Global equities and ETFs
Precious metals or commodities benchmarks
This indicator bridges the gap between price analysis and macro asset valuation, offering a quantitative visualization of gold’s total monetary footprint.
⚙️ Technical Mechanics
Base Symbol: OANDA:XAUUSD (or any gold pair available on your chart)
Conversion Constant:
210,000 tons × 32,150.7 oz/ton = 6.76 × 10⁹ ounces
Calculation:
MarketCap = (XAUUSD × total_ounces) / 1e12
Displayed Units: Trillions of USD (USD T)
Chart Type: Full OHLC candles (plotcandle)
Each candle represents the daily/weekly/monthly change in gold’s total market value.
🎛️ User Controls (Inputs)
Toggle Function
Show Average Line? Displays a 21-period SMA (in trillions) for trend-following analysis.
Show Info Table? Adds a small info table at the bottom-right corner showing the current market cap value.
Show Market Cap Label? Displays a live label above the last candle showing the latest market cap value.
Normalize Scale? Adjusts scaling for better visual fit. Leave enabled to avoid flat or off-screen candles.
📈 How to Use
1 - Add the indicator to your Gold Spot chart (XAUUSD).
2 - When added, TradingView automatically creates a separate panel below the main price chart.
3 - You can hide the original XAUUSD chart to focus solely on the synthetic market cap.
4 - Maximize the indicator panel (double-click or use the arrow icon) to view the synthetic market cap in full-screen mode.
Apply any drawing tools, trendlines, or visual overlays directly on this panel (they won’t affect the base chart).
Optionally, compare it side by side with Bitcoin Market Cap (CRYPTOCAP:BTC) for macro-level correlation studies.
🪙 Practical Applications
Compare Gold’s global valuation to Bitcoin, equities, or global M2 supply.
Analyze macro rotation trends between risk-off and risk-on assets.
Estimate how much capital is stored in physical gold versus digital assets.
Integrate into broader multi-asset dashboards for portfolio allocation analysis.
💡 Suggested Workflow
Keep the normalize toggle enabled (default).
Maximize the lower panel for a full synthetic chart view.
Combine this tool with the F!72 SuperTrade or MarketMonitor indicators for contextual macro insight.
Use a weekly or monthly timeframe for clearer long-term structure visualization.
📊 Notes
This indicator uses public XAU/USD pricing and does not require any external API.
Works seamlessly with any TradingView theme (light or dark).
Best viewed with logarithmic scale off, as values are already represented in trillions.
Compatible with all resolutions and broker feeds that support XAUUSD.
🔬 Example Interpretation
If Gold trades around $4,000/oz,
the total market cap is approximately:
4,000 × 32,150.7 × 210,000 ≈ 27 Trillion USD
If Gold rises to $5,000/oz,
the global valuation crosses 33.9 Trillion USD —
a move equivalent to adding the entire market cap of all major tech stocks combined.
🧭 Final Recommendation
This script is designed as an analytical overlay, not a trading signal tool.
It complements technical analysis by providing macro context — showing where gold stands as a global store of value in relation to other capital markets.
For best experience:
Use higher timeframes (1W or 1M)
Maximize the indicator panel
Keep Normalize Scale = ON
⚠️ Disclaimer
This indicator is a visualization and educational tool.
It does not provide financial advice or investment recommendations.
Always perform your own research before making financial decisions.
Author: Central Crypto Traders
Version: 1.0 (October 2025)
Type: Informational Overlay
License: Open for personal and educational use

Fair Value Lead-Lag Model [BackQuant]Fair Value Lead-Lag Model
A cross-asset model that estimates where price "should" be relative to a chosen reference series, then tracks the deviation as a normalized oscillator. It helps you answer two questions: 1) is the asset rich or cheap vs its driver, and 2) is the driver leading or lagging price over the next N bars.
Concept in one paragraph
Many assets co-move with a macro or sector driver. Think BTC vs DXY, gold vs real yields, a stock vs its sector ETF. This tool builds a rolling fair value of the charted asset from a reference series and shows how far price is above or below that fair value in standard deviation units. You can shift the reference forward or backward to test who leads whom, then use the deviation and its bands to structure mean-reversion or trend-following ideas.
What the model does
Reference mapping : Pulls a reference symbol at a chosen timeframe, with an optional lead or lag in bars to test causality.
Fair value engine : Converts the reference into a synthetic fair value of the chart using one of four methods:
Ratio : price/ref with a rolling average ratio. Good when the relationship is proportional.
Spread : price minus ref with a rolling average spread. Good when the relationship is additive.
Z-Score : normalizes both series, aligns on standardized units, then re-projects to price space. Good when scale drifts.
Beta-Adjusted : rolling regression style. Uses covariance and variance to compute beta, then builds a fair value = mean(price) + beta * (ref − mean(ref)).
Deviation and bands : Computes a z-scored deviation of price vs fair value and plots sigma bands (±1, ±2, ±3) around the fair value line on the chart.
Correlation context : Shows rolling correlation so you can judge if deviations are meaningful or just noise when co-movement is weak.
Visuals :
Fair value line on price chart with sigma envelopes.
Deviation as a column oscillator and optional line.
Threshold shading beyond user-set upper and lower levels.
Summary table with reference, deviation, status, correlation, and method.
Why this is useful
Mean reversion framework : When correlation is healthy and deviation stretches beyond your sigma threshold, probability favors reversion toward fair value. This is classic pairs logic adapted to a driver and a target.
Trend confirmation : If price rides the fair value line and deviation stays modest while correlation is positive, it supports trend persistence. Pullbacks to negative deviation in an uptrend can be buyable.
Lead-lag discovery : Shift the reference forward by +N bars. If correlation improves, the reference tends to lead. Shift backward for the reverse. Use the best setting for planning early entries or hedges.
Regime detection : Large persistent deviations with falling correlation hint at regime change. The relationship you relied on may be breaking down, so reduce confidence or switch methods.
How to use it step by step
Pick a sensible reference : Choose a macro, index, currency, or sector driver that logically explains the asset’s moves. Example: gold with DXY, a semiconductor stock with SOXX.
Test lead-lag : Nudge Lead/Lag Periods to small positive values like +1 to +5 to see if the reference leads. If correlation improves, keep that offset. If correlation worsens, try a small negative value or zero.
Select a method :
Start with Beta-Adjusted when the relationship is approximately linear with drift.
Use Ratio if the assets usually move in proportional terms.
Use Spread when they trade around a level difference.
Use Z-Score when scales wander or volatility regimes shift.
Tune windows :
Rolling Window controls how quickly fair value adapts. Shorter equals faster but noisier.
Normalization Period controls how deviations are standardized. Longer equals stabler sigma sizing.
Correlation Length controls how co-movement is measured. Keep it near the fair value window.
Trade the edges :
Mean reversion idea : Wait for deviation beyond your Upper or Lower Threshold with positive correlation. Fade back toward fair value. Exit at the fair value line or the next inner sigma band.
Trend idea : In an uptrend, buy pullbacks when deviation dips negative but correlation remains healthy. In a downtrend, sell bounces when deviation spikes positive.
Read the table : Deviation shows how many sigmas you are from fair value. Status tells you overvalued or undervalued. Correlation color hints confidence. Method tells you the projection style used.
Reading the display
Fair value line on price chart: the model’s estimate of where price should trade given the reference, updated each bar.
Sigma bands around fair value: a quick sense of residual volatility. Reversions often target inner bands first.
Deviation oscillator : above zero means rich vs fair value, below zero means cheap. Color bins intensify with distance.
Correlation line (optional): scale is folded to match thresholds. Higher values increase trust in deviations.
Parameter tips
Start with Rolling Window 20 to 30, Normalization Period 100, Correlation Length 50.
Upper and Lower Threshold at ±2.0 are classic. Tighten to ±1.5 for more signals or widen to ±2.5 to focus on outliers.
When correlation drifts below about 0.3, treat deviations with caution. Consider switching method or reference.
If the fair value line whipsaws, increase Rolling Window or move to Beta-Adjusted which tends to be smoother.
Playbook examples
Pairs-style reversion : Asset is +2.3 sigma rich vs reference, correlation 0.65, trend flat. Short the deviation back toward fair value. Cover near the fair value line or +1 sigma.
Pro-trend pullback : Uptrend with correlation 0.7. Deviation dips to −1.2 sigma while price sits near the −1 sigma band. Buy the dip, target the fair value line, trail if the line is rising.
Lead-lag timing : Reference leads by +3 bars with improved correlation. Use reference swings as early cues to anticipate deviation turns on the target.
Caveats
The model assumes a stable relationship over the chosen windows. Structural breaks, policy shocks, and index rebalances can invalidate recent history.
Correlation is descriptive, not causal. A strong correlation does not guarantee future convergence.
Do not force trades when the reference has low liquidity or mismatched hours. Use a reference timeframe that captures real overlap.
Bottom line
This tool turns a loose cross-asset intuition into a quantified, visual fair value map. It gives you a consistent way to find rich or cheap conditions, time mean-reversion toward a statistically grounded target, and confirm or fade trends when the driver agrees.

X-GoldThis indicator visualizes the relationship between Gold’s global strength and the U.S. Dollar Index (DXY) to help traders identify periods of confluence or divergence between the two assets.
It combines:
# Gold Spread Index (GSI) – the average normalized value of XAU quoted against several major currencies (USD, AUD, CHF, EUR, GBP, and Silver).
This helps measure gold’s strength across global markets, not just against the U.S. dollar.
# Normalized DXY line – a z-scored and smoothed version of the U.S. Dollar Index for visual comparison.
The background highlights confluence zones:
🟢 Bullish Confluence – GSI trending up while DXY trends down
🔴 Bearish Confluence – GSI trending down while DXY trends up
⚫ Neutral / Divergence – both move in the same direction (often signals indecision or ranging conditions)
Key Features:
# Works on any timeframe
# Real-time background color zones for instant trend confluence visualization
# Optional alerts for buy/sell/neutral confluence transitions
# Clean layout in a separate panel for clear comparison
Disclaimer:
This script is for educational and analytical purposes only.
It does not provide financial advice or guarantee any trading outcomes.
Always perform your own analysis before making investment decisions.

ICT PDA - Gold & BTC (QuickScalp Bias/FVG/OB/OTE + Alerts)What this script does
This indicator implements a complete ICT Price Delivery Algorithm (PDA) workflow tailored for XAUUSD and BTCUSD. It combines HTF bias, OTE zones, Fair Value Gaps, Order Blocks, micro-BOS confirmation, and liquidity references into a single, cohesive tool with early and final alerts. The script is not a mashup for cosmetic plotting; each component feeds the next decision step.
Why this is original/useful
Symbol-aware impulse filter: A dynamic displacement threshold kTune adapts to Gold/BTC volatility (body/ATR vs. per-symbol factor), reducing noise on fast markets without hiding signals.
Scalping preset: “Quick Clean” mode limits drawings to the most recent bars and keeps only the latest FVG/OB zones for a clear chart.
Three display modes: Full, Clean, and Signals-Only to match analysis vs. execution.
Actionable alerts: Early heads-up when price enters OTE in the HTF bias direction, and Final alerts once mitigation + micro-break confirm the setup.
How it works (high-level logic)
HTF Bias: Uses request.security() on a user-selected timeframe (e.g., 240m) and EMA filter. Bias = close above/below HTF EMA.
Dealing Range & OTE: Recent swing high/low (pivot length configurable) define the range; OTE (62–79%) boxes are drawn contextually for up/down ranges.
Displacement: A candle’s body/ATR must exceed kTune and break short-term structure (displacement up/down).
FVG: 3-bar imbalance (bull: low > high ; bear: high < low ). Latest gaps are tracked and extended.
Order Blocks: Last opposite candle prior to a qualifying displacement that breaks recent highs/lows; zones are drawn and extended.
Entry & Alerts:
Long: Bullish bias + price inside buy-OTE + mitigation of a bullish FVG or OB + micro BOS up → “PDA Long (Final)”.
Short: Bearish bias + price inside sell-OTE + mitigation of a bearish FVG or OB + micro BOS down → “PDA Short (Final)”.
Early Alerts: Trigger as soon as price enters OTE in the direction of the active bias.
Inputs & controls (key ones)
Bias (HTF): timeframe minutes, EMA length.
Structure: ATR length, Impulse Threshold (Body/ATR), swing pivot length, OB look-back.
OTE/FVG/OB/LP toggles: show/hide components.
Auto-Tune: per-symbol factors for Gold/BTC + manual tweak.
Display/Performance: View Mode, keep-N latest FVG/OB, limit drawings to last N bars.
Recommended usage (scalping)
Timeframes: Execute on M1–M5 with HTF bias from 120–240m.
Defaults (starting point): ATR=14, Impulse Threshold≈1.6; Gold factor≈1.05, BTC factor≈0.90; Keep FVG/OB=2; last 200–300 bars; View Mode=Clean.
Workflow: Wait for OTE in bias direction → see mitigation (FVG/OB) → confirm with micro BOS → manage risk to nearest liquidity (prev-day H/L or recent swing).
Alerts available
“PDA Early Long/Short”
“PDA Long (Final)” / “PDA Short (Final)”
Attach alerts on “Any alert() function call” or the listed conditions.
Chart & screenshots
Please include symbol and timeframe on screenshots. The on-chart HUD shows the script name and state to help reviewers understand context.
Limitations / notes
This is a discretionary framework. Signals can cluster during news or extreme volatility; use your own risk management. No guarantee of profitability.
Changelog (brief)
v1.2 QuickScalp: added Quick Clean preset, safer array handling, symbol-aware impulse tuning, display modes.
------------------------------
ملخص عربي:
المؤشر يطبق تسلسل PDA عملي للذهب والبتكوين: تحيز من فريم أعلى، مناطق OTE، فجوات FVG، بلوكات أوامر OB، وتأكيد micro-BOS، مع تنبيهات مبكرة ونهائية. تمت إضافة وضع “Quick Clean” لتقليل العناصر على الشارت وحساسية إزاحة تتكيّف مع الأصل. للاستخدام كسكالب: نفّذ على M1–M5 مع تحيز 120–240 دقيقة، وابدأ من الإعدادات المقترحة بالأعلى. هذا إطار سلوكي وليس توصية مالية.

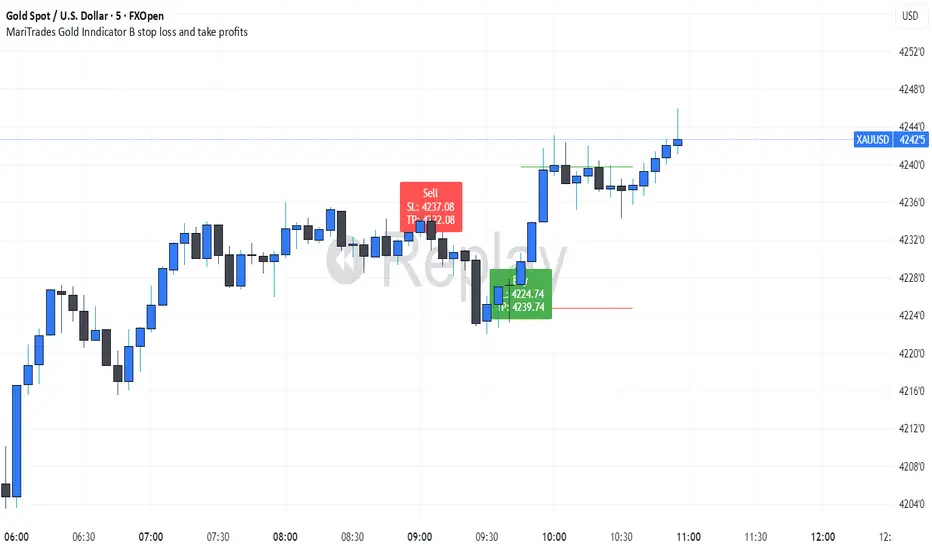
MariTrades Gold Indicator B-Stop loss and Take profitsThe MariTrades Gold Indicator B is an original Trading View script designed to help traders visualize entry points, stop loss (SL), take profit (TP), and key structure levels on gold charts. This publication fully complies with Trading View’s public script rules, including originality, English description, chart clarity, and Pine Script v5 usage.
Key Features:
Break of Structure (BOS) Detection:
Detects trend reversals by identifying when price closes above/below the previous swing high/low.
BOS signals are marked on the chart for both buy and sell opportunities.
Fibonacci Retracement Levels:
Automatically plots retracements from the last swing high to swing low.
(NOT LABELLED)
Entry signals are confirmed when price retraces to these levels after BOS.
Automatic SL and TP Visualization:
Stop loss and take profit levels are drawn directly on the chart.
Default values: SL = 5 pips, TP = 10 pips (customizable via inputs).
Entry Signals:
Buy: Price breaks structure (BOS) and retraces to Fibonacci level → label and lines drawn.
Sell: Price breaks structure (BOS) and retraces to Fibonacci level → label and lines drawn.
Clean, readable chart overlay:
Previous signals are automatically removed to avoid clutter.
SL lines in red, TP lines in green, entry labels clearly displayed.
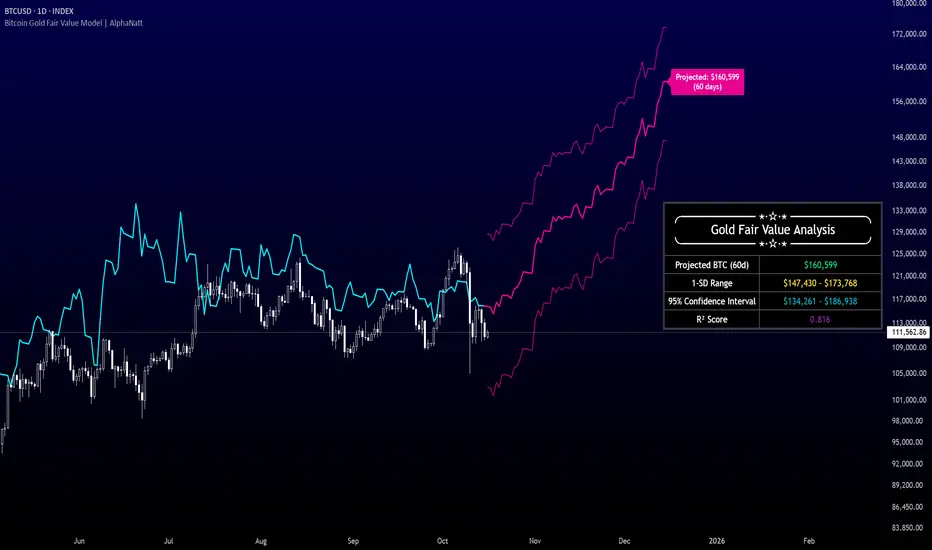
Bitcoin Gold Fair Value Model | AlphaNattBitcoin Gold Fair Value Model | AlphaNatt
A quantitative regression-based projection model that estimates Bitcoin’s fair value using gold as a macro-monetary benchmark.
This model, inspired by RJAlpha, applies a lag-adjusted statistical regression between gold and Bitcoin to identify the time-shifted correlation that historically aligns Bitcoin’s market value with gold’s macro trends. It produces a forward-looking projection, statistical confidence intervals, and explanatory metrics that assess the reliability of the relationship.
---
🧠 Core Concept
Gold serves as a proxy for global liquidity and real monetary value, often leading risk assets during liquidity expansions and contractions.
Bitcoin’s long-term trend tends to react to these same liquidity cycles, but with a measurable lag.
This indicator models that lag statistically, estimating Bitcoin’s “fair value” as if its price were fully caught up to gold’s recent movements.
The regression captures both directional influence and proportional magnitude through slope and intercept coefficients.
---
⚙️ Model Features
Dynamic Lag Regression – Uses a configurable leadDays period to align gold’s prior movements with Bitcoin’s current pricing behavior.
Rolling Sample Window – Continuously recalibrates the regression coefficients using a user-defined lookback length, allowing the model to adapt to new market conditions.
Forward Projection – Extends Bitcoin’s fair value into the future, based on present gold levels and the established lag relationship.
Volatility-Adjusted Confidence Bands – Displays one standard deviation and 95% confidence intervals around the projected path to visualize expected uncertainty.
Model Fitness Metric – Includes an R² score that quantifies the strength and stability of the BTC–Gold relationship within the active window.
---
📈 Visualization Breakdown
Cyan Line: Historical gold-driven fair value of Bitcoin.
Magenta Lines: Future fair value projection and confidence bands (offset by leadDays).
Projection Label: Displays the 60-day projected price target.
Statistical Table: Shows live model output including the projected fair value, 1-SD range, 95% confidence interval, and R² score.
---
🔧 User Inputs
Show 1 SD Bands? – Toggles visibility of the standard deviation boundaries.
---
📊 Interpretation Guide
When Bitcoin trades below its projected fair value, the model suggests it is temporarily undervalued relative to gold’s macro trend.
When Bitcoin trades above its projected fair value, it may be overextended in relation to the model’s equilibrium estimate.
A higher R² implies greater reliability — periods where gold explains a large portion of Bitcoin’s price variance.
Confidence intervals represent uncertainty, not directional certainty; deviation beyond them often implies a structural shift in correlation or market regime.
---
⚠️ Disclaimer
This indicator is designed for quantitative research and macro correlation analysis. It does not constitute investment advice, price prediction, or trading signal generation. Always verify assumptions and cross-check results with independent analysis before using in a live environment.
SGM Gold Day Trading EMAsWhat it does
This tool plots four Exponential Moving Averages (EMAs) with practical default periods for gold intraday analysis: 9 (Momentum), 21 (Pullback), 50 (Trend Filter), and 200 (Macro). The goal is to provide a clear, multi-horizon structure so traders can quickly assess momentum, pullbacks, intermediate trend, and long-term bias on the same chart.
How it works (method)
Each line is a standard EMA computed on the close price.
The defaults map to common roles:
EMA 9 – Momentum: immediate changes in short-term flow.
EMA 21 – Pullback: typical retracement area within ongoing trends.
EMA 50 – Trend Filter: medium-term confirmation of direction.
EMA 200 – Macro: long-term bias and market context.
Optional dynamic color for EMA9/EMA21 highlights whether EMA9 ≥ EMA21 (green) or not (red). This is a visual aid only; it does not generate signals.
Originality & usefulness
The script focuses on clarity and control rather than automation. It combines a neutral, high-contrast palette with independent line thickness per EMA and an optional visual crossover mode. The configuration encourages disciplined analysis across time horizons without embedding opaque entry/exit logic.
Inputs & customization:
Periods: 9, 21, 50, 200 (all adjustable).
Colors: fully customizable for each EMA; optional crossover color mode for 9/21.
Line thickness: set individually per EMA to emphasize your primary reference.
How to use:
Add the script on any timeframe/asset (gold defaults are provided but not required).
Use EMA 200 for long-term bias; trade with caution against it.
Use EMA 50 to filter intermediate trend; prefer setups aligned with it.
Watch EMA 21 as a pullback reference within trends.
Use EMA 9 to gauge momentum around pullbacks/breakouts.
(Optional) Enable the crossover color to quickly see when momentum (9) is above/below pullback (21).
Notes & limitations:
This script does not produce buy/sell signals or alerts.
It is intended as a visual framework to support analysis and risk management.
Always validate with your own rules, risk controls, and market conditions.

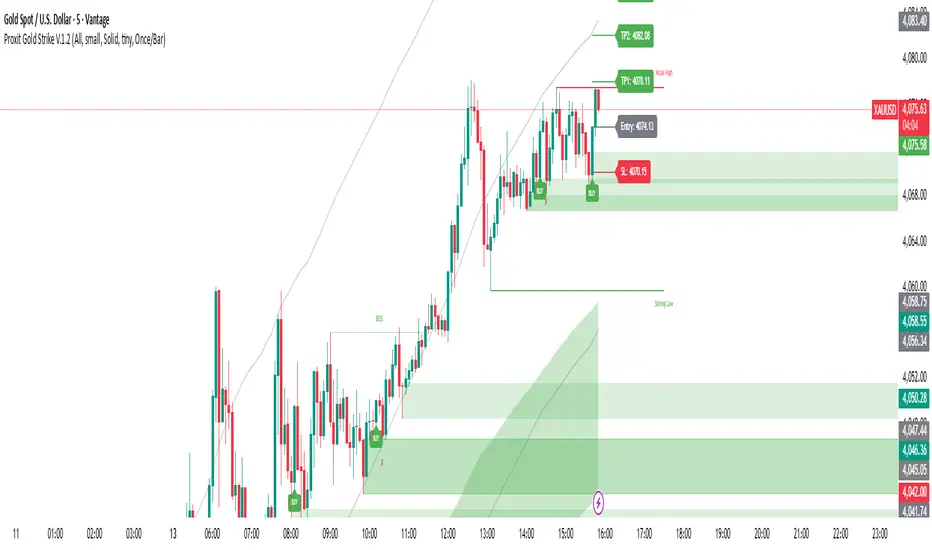
Proxit Gold Strike V.1.2Proxit Gold Strike v.1.2 is a scalping-focused indicator designed to pinpoint fast in–out entries on lower timeframes (1–5m). It blends momentum, short-term trend bias, and reversal/pricing zones to surface high-probability setups while filtering out low-volatility chop.
Core Logic:
Detect micro-trend bias to stay aligned with short-term direction
Trigger Momentum Pulse when buy/sell pressure expands
Highlight Pullback/Exhaustion zones where quick bounces often occur
Apply a Volatility Filter to reduce noise in dead markets
On-chart Elements:
Buy / Sell arrows when conditions align
Soft background Trend Bias shading
Signal Baseline for directional reference
Scalp Zones for pragmatic entry/exit placement
No-Trade Zone warning during ultra-low volatility
Signals & Trade Ideas:
Scalp Buy: Positive momentum crossover + price above Baseline + not in No-Trade Zone
Scalp Sell: Negative momentum crossover + price below Baseline + not in No-Trade Zone
Exit: Quick targets (e.g., R:1–1.5) or upon opposite momentum/weakening signal
Recommended Inputs:
Sensitivity (1–5): Higher = faster/more signals (default: 3)
Baseline Length: 50–100 for volatile instruments
Momentum Window: 8–14 tuned for scalps
Volatility Filter: On for chop reduction
Show Labels/Alerts: Toggle visual/alert elements
Best Timeframes & Markets:
1m / 3m / 5m on Forex, Gold, Crypto, Index Futures
For Gold, start with TF 3–5m during active sessions/liquidity peaks.
Alerts:
“Proxit Buy” and “Proxit Sell” on signal confirmation
“Exit/Flip” when momentum flips
Use Once per bar close for more reliable alerts.
Best Practices:
Favor trades with the current Trend Bias; avoid strong counter-trend attempts
Keep tight stops nearby and size positions responsibly
Be cautious around major news releases unless your playbook accounts for them
Combine with market structure/S&R for added confluence
Disclaimer:
This tool is for educational and decision-support purposes only and is not financial advice. Results depend on your risk management and discipline. Always forward-test on demo before going live.
Suggested TradingView Tags:
scalping, momentum, trend, gold, crypto, forex, volatility, pullback, intraday, alerts
RUFUS GOLD BOT - TP/SL/ExitRUFUS GOLD BOT – Buy, Sell, and Exit (80% Accuracy)
This powerful indicator provides clear Buy, Sell, and Exit signals based on proven price action patterns, offering traders a simple yet effective tool for decision-making. With an impressive 80% accuracy rate, it helps identify high-probability trade setups and manage exits for optimal profits.
Maple Algorithm_GOLDMaple Algorithm – AI-Powered Gold Indicator
Maple Algorithm is an AI-inspired indicator designed specifically around the price behavior of Gold (XAUUSD).
It automatically calculates and plots take-profit (TP) and stop-loss (SL) levels based on dynamic market conditions, allowing traders to capture precise entries and exits.
✨ Key Features
AI-driven adaptive model trained on Gold’s market structure
Auto-generated TP/SL zones for precision trading
Compatible with your own strategies — scale from 1:2 RRR up to even higher setups
Optimized for scalping and short-term momentum bursts
⚠️ Disclaimer:
This indicator is for educational and research purposes only. It does not guarantee future results. Always test thoroughly before applying to live trading.
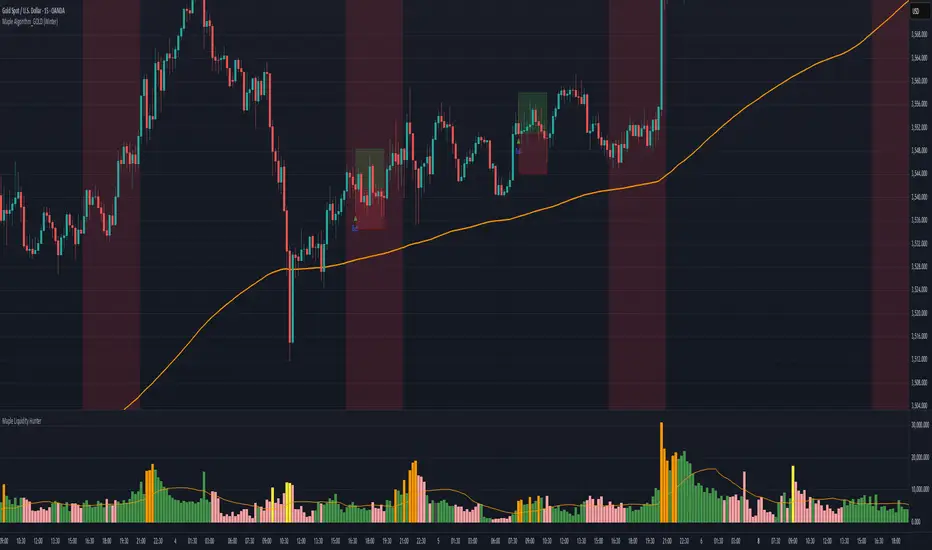
TrendIsYourFriend Strategy (SPY,IWM,VYM,XLK,SPXL,BTC,GOLD,VT...)Personal disclaimer
Don’t trust this strategy. Don’t trust any other model either just because of its author or a backtest curve. Overfitting is an easy trap, and beginners often fall into it. This script isn’t meant to impress you. It’s meant to survive reality. If it does, maybe it will raise questions and you’ll remember it.
Legal disclaimer
Educational purposes only. Not financial advice. Past performance is not indicative of future results.
Strategy description
Long-only, trend-based logic with two entry types (trend continuation or excess-move reversion), dynamic stop-losses, and a VIX filter to avoid turbulent markets.
Minimal number of parameters with enough trades to support robustness.
For backtest, each trade is sized at $10,000 flat (no compounding, to focus on raw model quality and the regularity of its results over time).
Fees = $0 (neutral choice, as brokers differ).
Slippage = $0, deliberate choice: most entries occur on higher timeframes, and some assets start their history on charts at very low prices, which would otherwise distort results.
What makes this script original
Beyond a classical trend calculation, both excess-move entries and dynamic stop-loss exits also rely on trend logic. Except for the VIX filter, everything comes from trend functions, with very few parameters.
Pre-configurations are fixed in the code, allowing sincere performance tracking across a dozen cases over the medium to long term.
Allowed
SPY (ARCA) — 2-hour chart: S&P 500 ETF, most liquid equity benchmark
IWM (ARCA) — Daily chart: Russell 2000 ETF, US small caps
VYM (ARCA) — Daily chart: Vanguard High Dividend Yield ETF
XLK (ARCA) — Daily chart: Technology Select Sector SPDR
SPXL (ARCA) — Daily chart: 3× leveraged S&P 500 ETF
BTCUSD (COINBASE) — 4-hour chart: Bitcoin vs USD
GOLD (TVC) — Daily chart: Gold spot price
VT (ARCA) — Daily chart: Vanguard Total World Stock ETF
PG (NYSE) — Daily chart: Procter & Gamble Co.
CQQQ (ARCA) — Daily chart: Invesco China Technology ETF
EWC (ARCA) — Daily chart: iShares MSCI Canada ETF
EWJ (ARCA) — Daily chart: iShares MSCI Japan ETF
How to use and form an opinion on it
Works only on the pairs above.
Feel free to modify the input parameters (slippage, fees, order size, margins, …) to see how the model behaves under your own conditions
Compare it with a simple Buy & Hold (requires an order size of 100% equity).
You may also want to look at its time-in-market — the share of time your capital is actually at risk.
Finally, let me INSIST on this : let it run live for months before forming an opinion!
Share your thoughts in the comments 🚀 if you’d like to discuss its live performance.

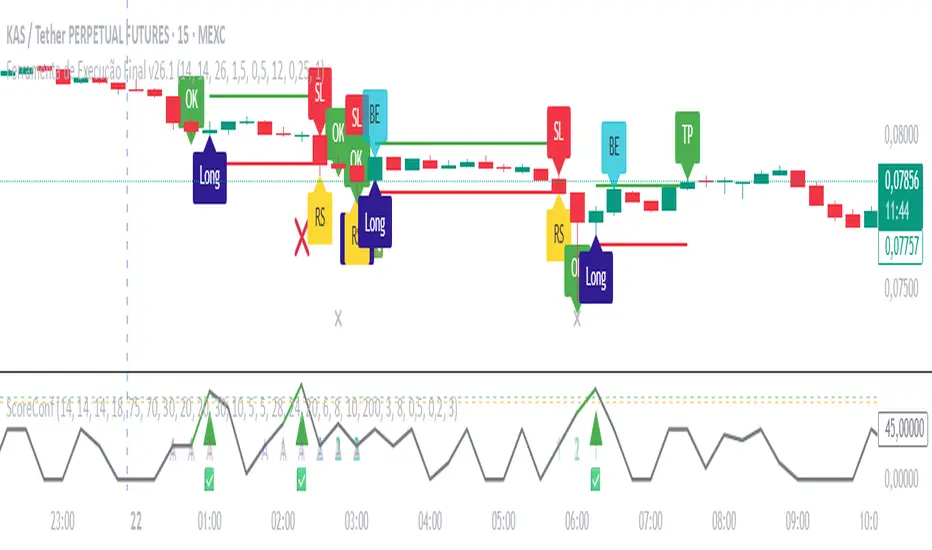
Ultimate Gold Long Indicator - Execução Final v26.1 By M.LolasUltimate Gold Long Indicator - Execução Final v26.1 By M.Lolas
Central indicator for by long in 15m time frame 20x.
“Backtested indicator for an aggressive 15-minute, 20×-leverage strategy, packed with capital-protection features.”
By M.Lolas

Ultimate Gold Confluence Score – Validator v6.1 By M.Lolas“Ultimate Gold Confluence Score Validator — multi-indicator add-on for a 15-minute, 20× long strategy with a very high win rate. Supports the strategy’s main indicator.”
Siege Gold Strategy-1m
Siege Gold Strategy - An Advanced Trading Strategy with a Multi-Confirmation System
This powerful indicator is designed to help you base your trading decisions on solid foundations. Thanks to its advanced algorithms and multi-confirmation mechanism, it helps you understand market trends more clearly.
Key Features
Trend Pivot Points: Instantly identify trend reversals and potential support/resistance levels with intelligent pivot points that react to real-time price movements. This allows you to analyze the trend's strength and direction more accurately.
Relative Strength Index (RSI) Integration: We combine the classic overbought/oversold signals of the RSI with our custom strategies to generate more reliable and filtered signals. This integration minimizes false signals.
"Range" Module: This feature measures the volatility range the price is currently in, showing whether the market is consolidating or moving. This helps reduce the risk of making incorrect trades in sideways markets.
Who Is This For?
Traders who follow trend-following strategies.
Anyone who wants to automatically determine support and resistance levels.
Those looking for a multi-confirmation mechanism instead of relying on a single indicator.
Anyone who wants to generate more reliable trading signals.
This strategy can be used in the XAUUSD pair, as well as in crypto and forex markets. To use this strategy more accurately, we encourage you to watch a few videos. It's important to remember that every instrument and indicator setting yields different results, and we cannot guarantee that you will make a profit.

Weekly/Monthly Golden ATR LevelsWeekly/Monthly Golden ATR Levels
This indicator is designed to give traders a clear, rule-based framework for identifying support and resistance zones anchored to prior period ranges and the market’s own volatility. It uses the Average True Range (ATR) as a measure of how far price can realistically stretch, then projects fixed levels from the midpoint of the prior week and prior month.
Rather than “moving targets” that repaint, these levels are frozen at the start of each new week and month and stay fixed until the next period begins. This makes them reliable rails for both intraday and swing trading.
What It Plots
Weekly Midpoint (last week’s High + Low ÷ 2)
From this mid, the script projects:
Weekly +1 / −1 ATR
Weekly +2 / −2 ATR
Monthly Midpoint (last month’s High + Low ÷ 2)
From this mid, the script projects:
Monthly +1 / −1 ATR
Monthly +2 / −2 ATR
Customization
Set ATR length & timeframe (default: 14 ATR on Daily bars).
Adjust multipliers for Level 1 (±1 ATR) and Level 2 (±2 ATR).
Choose line color, style, and width separately for weekly and monthly bands.
Toggle labels on/off.
How to Use
Context at the Open
If price opens above last week’s midpoint, bias favors upside toward +1 / +2.
If price opens below the midpoint, bias favors downside toward −1 / −2.
Weekly Bands = Short-Term Rails
+1 / −1 ATR: Rotation pivots. Expect intraday reaction.
+2 / −2 ATR: Extreme stretch zones. Reversals or breakouts often occur here.
Monthly Bands = Big Picture Rails
Use these for swing positioning, or as “outer guardrails” on intraday charts.
When weekly and monthly bands cluster → high-confluence zone.
Trade Playbook
Trend Day: Hold above +1 → target +2. Break below −1 → target −2.
Range Day: Fade first test of ±2, scalp toward ±1 or midpoint.
Catalyst/News Day: Use with caution—levels provide context, not barriers.
Risk Management
Place stops just outside the band you’re trading against.
Scale profits at the next inner level (e.g., short from +2, cover partial at +1).
Runners can trail to the midpoint or opposite side.
Why It Works
ATR measures volatility—how far price tends to travel in a given period.
Anchoring to prior highs and lows captures where real supply/demand last clashed.
Combining the two gives levels that are statistically relevant, widely observed, and psychologically sticky.
Trading books from Mark Douglas (Trading in the Zone), Jared Tendler (The Mental Game of Trading), and Oliver Kell (Victory in Stock Trading) all stress the importance of having objective, repeatable reference points. These levels deliver that discipline—removing guesswork and reducing emotional trading

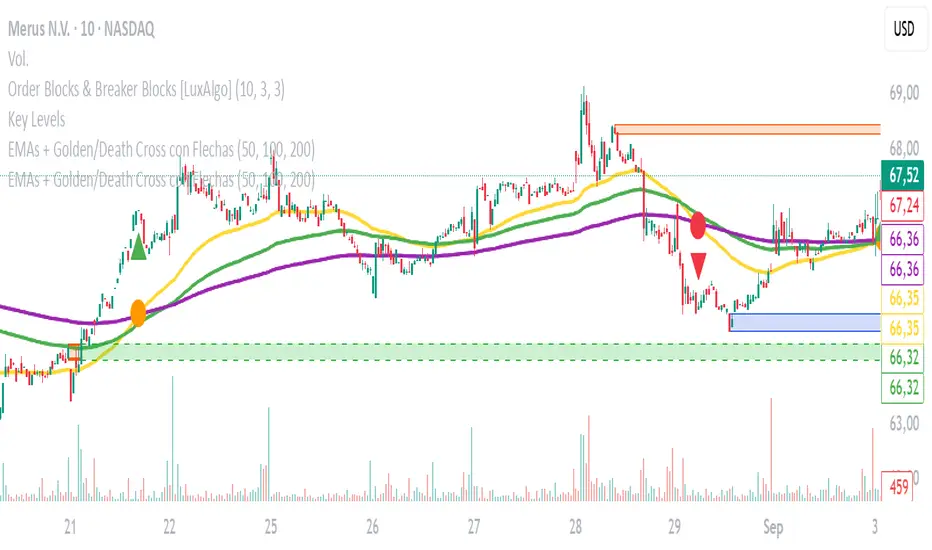
EMAs + Golden/Death Cross con Flechas
Emas crossing. Death Cross and Golden Cross. Emas of 50, 100, and 200. Editable. Recommended time frame: 30 minutes.
FRXFORTUNE GOLD ADVANCEThis indicator helps traders analyze gold price reaction after economic news releases.
You can manually input the Actual and Forecast values from news data.
Based on the difference, it shows a side box signal:
- If USD is strong → Gold sell signal
- If USD is weak → Gold buy signal
It also provides alerts when strong reactions are detected.

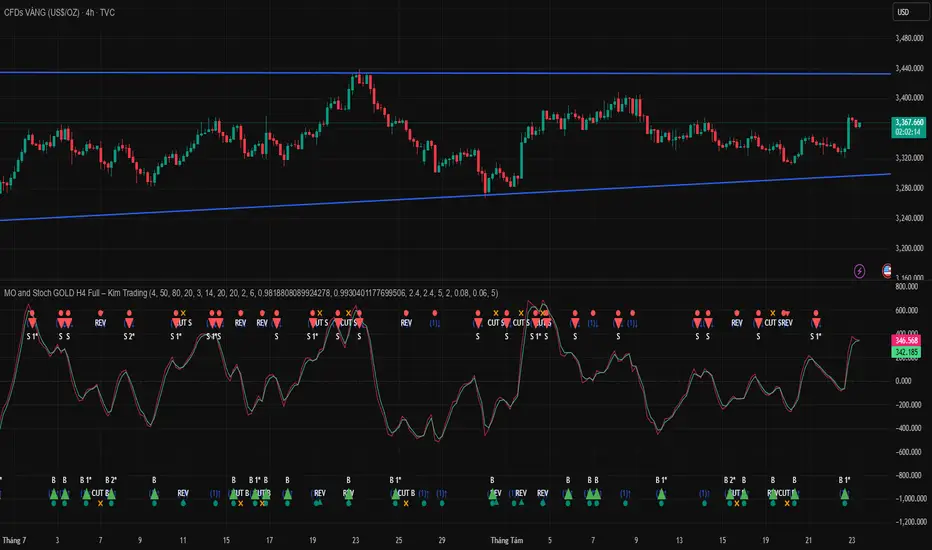
MO and Stoch GOLD H4 V.s.1 – Kim Trading MO and Stoch GOLD H4 V.s.1 – Kim Trading
Market: XAUUSD • Timeframe: H4 (4h)
Signal tiers.
B/S (basic), B1★/S1★ (MO + Stoch RSI), B2★/S2★ (with-trend filter), B3★/S3★ (plus divergence).
Trade only when one of the four labels appears. Consider DCA with the prevailing trend and add other confluences (levels, candles, volume, timing) for optimal setups.
Notes. Use Alerts → Once Per Bar Close. Educational tool, not financial advice. Source code Protected.
Author: Kim Trading • Version: V1 • Date: 2025-08-25
#XAUUSD #Gold #H4 #MO #Stoch #KimTrading

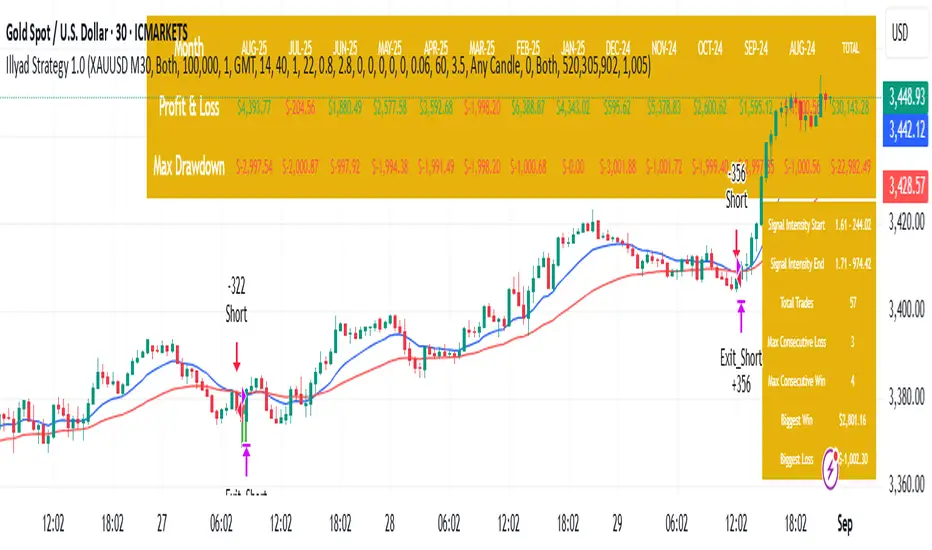
Optimised XAU/USD (Gold, IC Markets, 30m)The Illyad Strategy 1.0 optimised for XAU/USD (Gold) on the 30-minute timeframe (IC Markets feed).
📊 Backtest Results (Jan 2024 – Aug 2025):
✅ Total P&L: +30,143.28 USD (+30.14%)
📉 Max Drawdown: 3.60% (3,945.84 USD)
🔁 Total Trades: 57
📈 Win Rate: 42.11% (24/57 trades)
⚖️ Profit Factor: 1.91
This setup shows steady performance and low drawdown on Gold — ideal for traders wanting to capture volatility while maintaining consistency.
🔧 Optimisation Notes:
Works best on the 30m timeframe.
Each instrument (forex, indices, commodities, stocks) has unique behaviour.
To maximise results, always optimise the parameters per symbol — e.g., Gold requires a different configuration than GBP/USD or NASDAQ.
💡 Best Use Cases:
Prop firm challenges & scaling funded accounts.
Long-term compounding with low risk.
Automated execution via TradingView alerts → MT5 for hands-free trading.
⚠️ Disclaimer:
This strategy is for educational purposes only. Past results do not guarantee future performance. Always backtest and forward-test before going live.
📲 Next Steps:
This example demonstrates the Gold (XAU/USD) optimisation. The Illyad Strategy can be tuned for any forex pair, index, or commodity with proper optimisation.
👉 Visit my profile for full automation solutions.
MO and Stoch GOLD H4 Full – Kim TradingMO and Stoch GOLD H4 Full – Kim Trading
Slogan: “Trading Is a Profession, Trading Is Life”
Market: XAUUSD • Timeframe: H4
Regime Gate (strong-trend filter) – turn on to suppress noise during strong trends; trade-off: you may miss some opportunities.
Cut & Reverse – use when you prefer to disable the strong-trend filter and react fast (cut the losing side and reverse with the new signal).
Entry/Exit Rules. When B/B1★/B2★/B3★ (buy) or S/S1★/S2★/S3★ (sell) labels appear, follow the prevailing trend and consider DCA (scale-in) with the trend. Combine with other confluences (levels, candlesticks, volume, timing) to form an optimal setup.
Signal Confidence Tiers:
B — S
B1★ — S1★
B2★ — S2★
B3★ — S3★
Enter only when one of the four labels appears. Use Alerts → Once Per Bar Close.
Notes. Educational tool, not financial advice. Source code remains Protected.
Author: Kim Trading • Version: V1 • Date: 2025-08-25
#XAUUSD #Gold #H4 #MO #Stoch #KimTrading