Donchian + Keltner Channel Strategy with Stops & Alerts BY GOUNIThis script combines Donchian Channels and Keltner Channels to identify potential buy and sell opportunities on the chart. It provides clear visual cues and includes volume labels and dynamic stop loss levels for better trading insights.
ابحث في النصوص البرمجية عن "KELTNER"

KPOS (Keltner Position)Shows closing prices relative to dynamic keltner channel (STARC bands), normalized as oscillator. Default settings are same as Adam H Grimes' who has posted some statistics on the bands. KPOS values show position of closing price relative to lower bands (as a percentage), such that 0 = lower band, 50 = ema (midpoint), and 100 = upper band. Bands can be widened or narrowed by adjusting ATR Multiple. Best used with confluence of support and resistance to identify momentum breakouts, continuations, and divergences.

GMS: Keltner ChannelsBasically I wanted to make this into one indicator instead of three while adding in some extra options as well... So this is just a Keltner Channel with three channels, all of which have the same length. I have also added in an option to select the moving average for the channel, the original is based on the EMA.
The source code should be open so take a look around and enjoy!
Andre

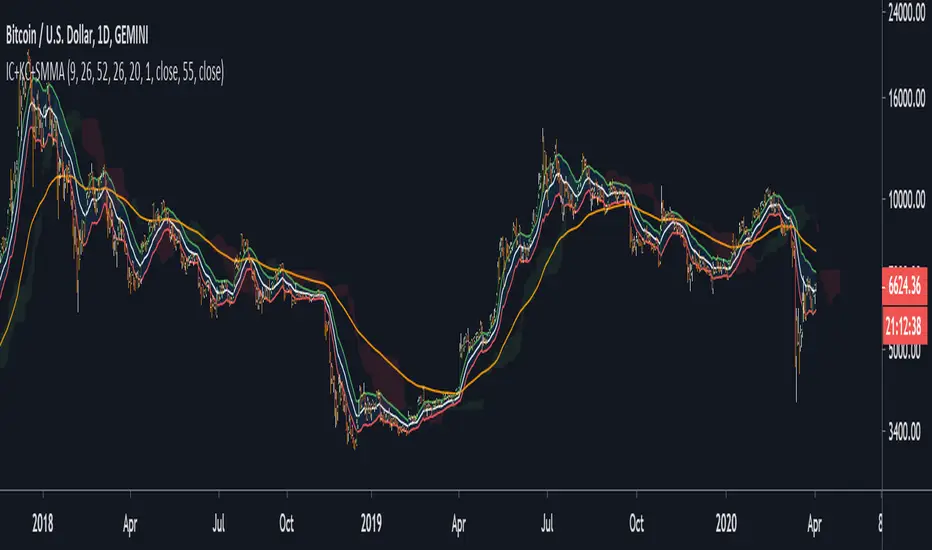
Ichimoku Cloud + keltner channel + SMMAa combo of
Ichimoku Cloud + keltner channel + SMMA
have fun, come up with your strategy


Donchain Keltner Bollinger Bands 10 Moving AveragesDonchain Keltner Bollinger Bands 10 Moving Averages


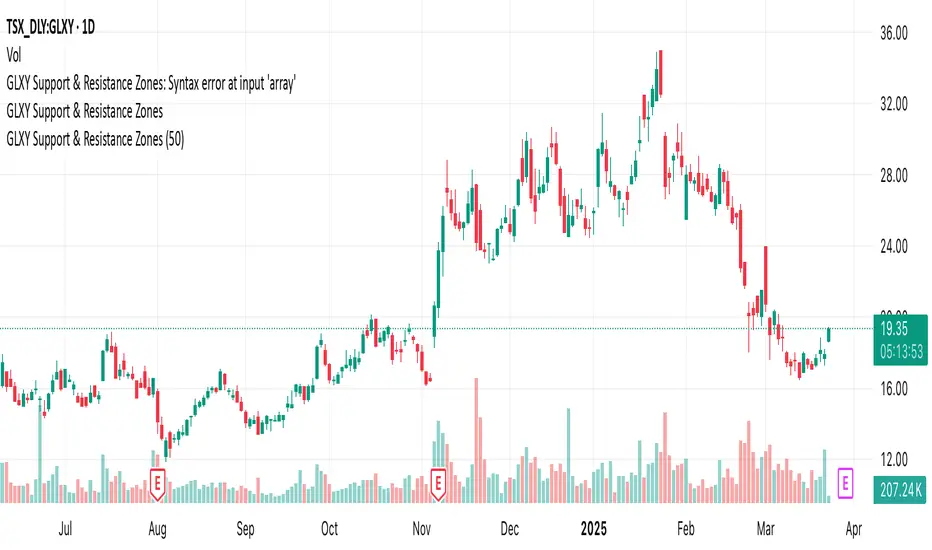
GLXY Support & Resistance ZonesHere’s a structured trading strategy for Galaxy Digital Holdings Ltd. (GLXY) based on a combination of technical analysis, market sentiment, and macro crypto market movement:
⸻
1. Timeframe
• Swing trading timeframe: 1-week to 1-month trades.
• Monitor daily and 4H charts for entries and exits.
⸻
2. Key Factors Driving GLXY
• Strongly correlated to Bitcoin and Ethereum price movement.
• Sensitive to regulatory news in Canada/US and institutional crypto adoption.
• Watch Galaxy’s quarterly earnings and treasury BTC/ETH position updates.
⸻
3. Entry Strategy
A) Technical Setup:
• Buy at major support zones:
• Key support levels: $7.00 CAD, $9.00 CAD (verify current chart levels).
• Enter long positions on bullish reversal candles at these supports.
• Breakout trades:
• Enter long positions on confirmed breakouts above significant resistance (watch volume and 1D close).
• Moving Average Confirmation:
• Only trade long if price is above the 50-day moving average and 50 MA is upward sloping.
B) Macro Confirmation:
• Only take aggressive long positions if BTC price is in an uptrend (above its own 50-day MA).
• Monitor ETH/BTC pair as additional confidence for alt sentiment.
⸻
4. Exit Strategy
• First partial profit target: Previous swing highs or Fibonacci extension levels (commonly 1.272 or 1.618).
• Trailing stop: Move stop-loss to entry when trade is +10%.
• Hard stop-loss: Below the last daily support (2-5% risk).
⸻
5. Diversification
• Do not exceed 5-7% of total portfolio per trade.
• Hedge exposure by monitoring crypto futures or crypto sentiment indexes (eg. Fear & Greed Index).
⸻
6. Optional Short Setup
• Only short if price breaks major support with strong volume, and BTC/ETH are in confirmed downtrends.
• Short target: next daily support zone.
⸻
7. News / Event-based Catalyst
• Enter small positions before major earnings or after big regulatory decisions if crypto sentiment is bullish.
⸻
8. Review
• Reassess the strategy every month based on BTC market structure.
• Track your trade results for GLXY separately to refine position sizing and entry criteria.
⸻
Squeeze Momentum Indicator v4_pine [By Lazy Bear]This is the famous Squeeze Momentum Indicator made by @LazyBear in v4 version if someone wants to test some strategies, as the original code was in v2 version the code converter couldn't convert to v4.

Screener - Mean Reversion Channel█ OVERVIEW
This is Screener script for Mean Reversion Channel Indicator
█ Description & How To Use
The screener works by scanning through up to 40 symbols and list down symbols that are currently within Overbought/Oversold Zone as defined by Mean Reversion Channel indicator.
The Overbought/Oversold Zone are further categorized and sorted by:
Strong : Indicated by "(Strong)" next to the symbol name
Normal : Indicated by the absence of "(Strong)" or "(Weak)" next to the symbol name
Weak : Indicated by "(Weak)" next to the symbol name
Notes: Refer to chart above to see how the Zone are categorized.
Notes: If the screener displays "Nothing Interesting". It simply means none of the screened assets are within the Overbought/Oversold Zone.
█ Features
- Scan up to 40 symbols at a time (By default, no asset is define. Once configured all the symbols you required, remember to save as default to save you from pain of configuring it again in the future)
- Options to scan by zones
- Custom Timeframe
█ Limitation
Due to multiple use of security() function required to call other symbols, expect the screener to be slow at certain times
█ Disclaimer
Past performance is not an indicator of future results.
My opinions and research are my own and do not constitute financial advice in any way whatsoever.
Nothing published by me constitutes an investment recommendation, nor should any data or Content published by me be relied upon for any investment/trading activities.
I strongly recommends that you perform your own independent research and/or speak with a qualified investment professional before making any financial decisions.
Any ideas to further improve this indicator are welcome :)
Credit: QuantNomad for his script idea on custom screener

Mean Reversion Channel - (fareid's MRI Variant)Description :
Mean Reversion Channel objective, based on Mean Reversion theory ( everything has a tendency to revert back to its mean), is to help visualizing:
Inner Channel -> Dynamic Support and Resistance
Outer Channel -> Overbought/Oversold Zone which may signal consolidation phase or potential reversal due to unsustainable move
Details on some of the filtering type used for mean calculation can be read in Ehlers Technical Papers: "Swiss Army Knife Indicator" and/or his book "Cybernetics Analysis for Stock and Futures"
Disclaimer:
These study scripts was built only to test/visualize an idea to see its viability and if it can be used to optimize existing strategy.
Any ideas to further improve this indicator are welcome :)

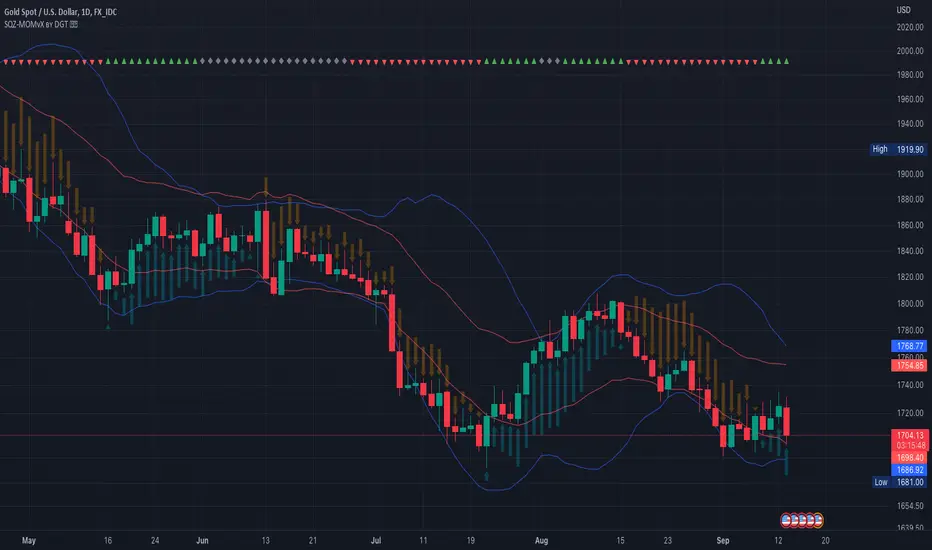
Squeeze Momentum Indicator [LazyBear] vX by DGTModified version of Squeeze Momentum Indicator visualizing on Price Chart
author: LazyBear, modified by KıvançÖZBİLGİÇ
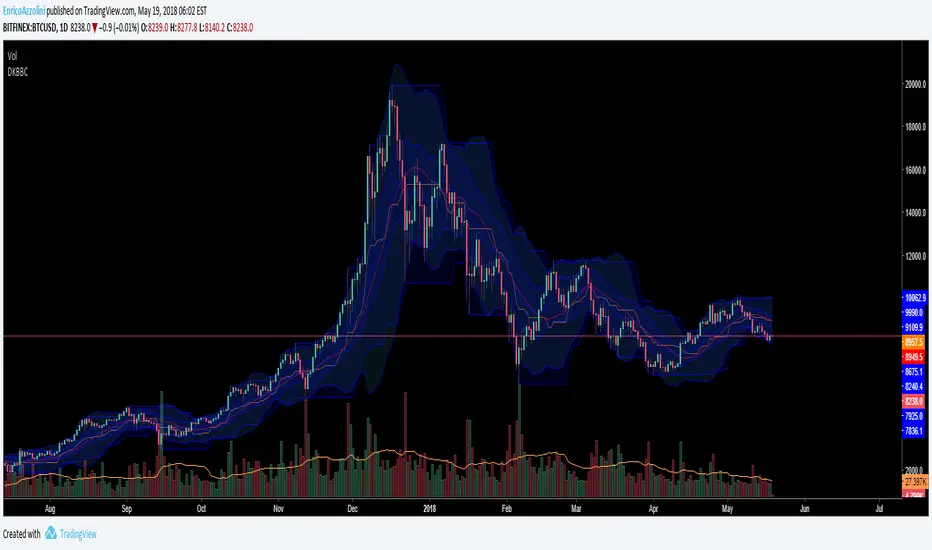
Keltner Channels - signal providerThis enhanced channel for pro traders visually indicates enhanced entry or exit signal based on the position of the underlying within the channel. Remember: EVERY TREND HAS ITS RETRACEMENTS - with this indicator you will avoid entering in full uptrend (bearing more downside risk than upside) or exiting (shorting) at max downtrend.
To be used together with the trend on higher timeframes (especially for the interpretation of the baseline)
Upper part = potential sell signal (especially in overall downtrends)
Lower part = potential buy signal (especially in overall uptrends)
Basis = potential buy signal (especially in strong uptrends)
= potential sell signal (especially in overall downtrends)

Keltner Channels times 4!Have you always wanted the ultimate MOMO buying script? Well here you go, KC stacked on top of one another.
As Trump would say,
ENJOY!

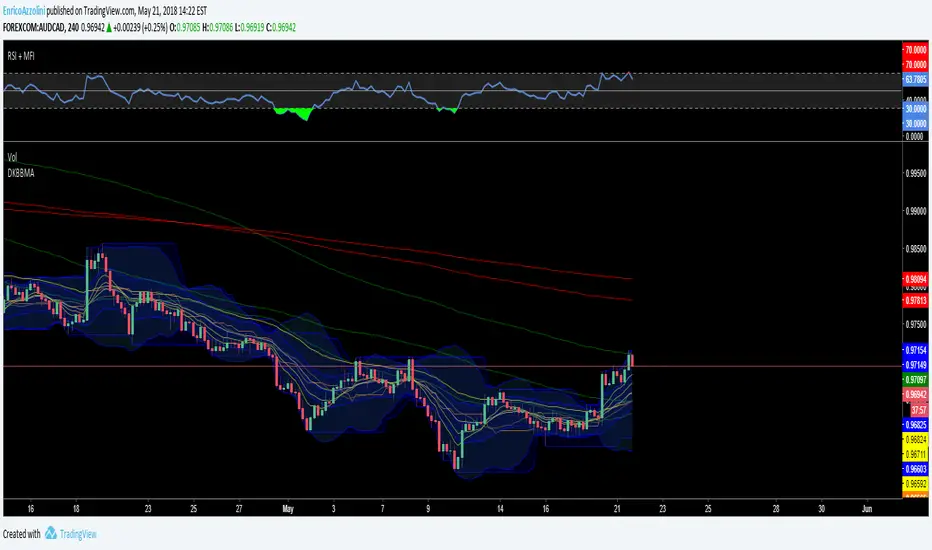
Keltner Channel + RSI + IchimokuA first try in scripting. Have taken some ideas from other places and combined into one.
Will update later with more information.


Keltner Channel v2 - Auto highlighting of Bull/Bear trendsPlease do not use the previous version (), I was using wrong colors for Bull/Bear there.
All options configurable.
Reversals are marked using crosses. as well as highlighted using green/red color (depending on bull/bear). Enjoy!

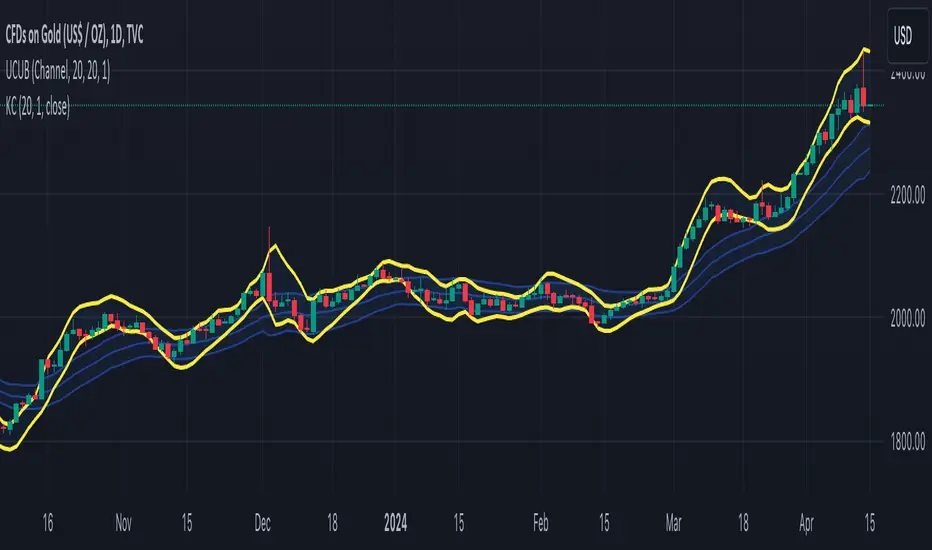
TASC 2024.05 Ultimate Channels and Ultimate Bands█ OVERVIEW
This script, inspired by the "Ultimate Channels and Ultimate Bands" article from the May 2024 edition of TASC's Traders' Tips , showcases the application of the UltimateSmoother by John Ehlers as a lag-reduced alternative to moving averages in indicators based on Keltner channels and Bollinger Bands®.
█ CONCEPTS
The UltimateSmoother , developed by John Ehlers, is a digital smoothing filter that provides minimal lag compared to many conventional smoothing filters, e.g., moving averages . Since this filter can provide a viable replacement for moving averages with reduced lag, it can potentially find broader applications in various technical indicators that utilize such averages.
This script explores its use as the smoothing filter in Keltner channels and Bollinger Bands® calculations, which traditionally rely on moving averages. By substituting averages with the UltimateSmoother function, the resulting channels or bands respond more quickly to fluctuations with substantially reduced lag.
Users can customize the script by selecting between the Ultimate channel or Ultimate bands and adjusting their parameters, including lookback lengths and band/channel width multipliers, to fine-tune the results.
█ CALCULATIONS
The calculations the Ultimate channels and Ultimate bands use closely resemble those of their conventional counterparts.
Ultimate channel:
Apply the Ultimate smoother to the `close` time series to establish the basis (center) value.
Calculate the smooth true range (STR) by applying the UltimateSmoother function with a user-specified length instead of a rolling moving average, thus replacing the conventional average true range (ATR). Users can adjust the final STR value using the "Width multiplier" input in the script's settings.
Calculate the upper channel value by adding the multiplied STR to the basis calculated in the first step, and calculate the lower channel value by subtracting the multiplied STR from the basis.
Ultimate bands:
Apply the Ultimate smoother to the `close` time series to establish the basis (center) value.
Calculate the width of the bands by finding the square root of the average of individual squared deviations over the specified length, then multiplying the result by the "Width multiplier" input value.
Calculate the upper band by adding the resulting width to the basis from the first step, and calculate the lower band by subtracting the width from the basis.