Canuck Trading IndicatorOverview
The Canuck Trading Indicator is a versatile, overlay-based technical analysis tool designed to assist traders in identifying potential trading opportunities across various timeframes and market conditions. By combining multiple technical indicators—such as RSI, Bollinger Bands, EMAs, VWAP, MACD, Stochastic RSI, ADX, HMA, and candlestick patterns—the indicator provides clear visual signals for bullish and bearish entries, breakouts, long-term trends, and options strategies like cash-secured puts, straddles/strangles, iron condors, and short squeezes. It also incorporates 20-day and 200-day SMAs to detect Golden/Death Crosses and price positioning relative to these moving averages. A dynamic table displays key metrics, and customizable alerts help traders stay informed of market conditions.
Key Features
Multi-Timeframe Adaptability: Automatically adjusts parameters (e.g., ATR multiplier, ADX period, HMA length) based on the chart's timeframe (minute, hourly, daily, weekly, monthly) for optimal performance.
Comprehensive Signal Generation: Identifies short-term entries, breakouts, long-term bullish trends, and options strategies using a combination of momentum, trend, volatility, and candlestick patterns.
Candlestick Pattern Detection: Recognizes bullish/bearish engulfing, hammer, shooting star, doji, and strong candles for precise entry/exit signals.
Moving Average Analysis: Plots 20-day and 200-day SMAs, detects Golden/Death Crosses, and evaluates price position relative to these averages.
Dynamic Table: Displays real-time metrics, including zone status (bullish, bearish, neutral), RSI, MACD, Stochastic RSI, short/long-term trends, candlestick patterns, ADX, ROC, VWAP slope, and MA positioning.
Customizable Alerts: Over 20 alert conditions for entries, exits, overbought/oversold warnings, and MA crosses, with actionable messages including ticker, price, and suggested strategies.
Visual Clarity: Uses distinct shapes, colors, and sizes to plot signals (e.g., green triangles for bullish entries, red triangles for bearish entries) and overlays key levels like EMA, VWAP, Bollinger Bands, support/resistance, and HMA.
Options Strategy Signals: Suggests opportunities for selling cash-secured puts, straddles/strangles, iron condors, and capitalizing on short squeezes.
How to Use
Add to Chart: Apply the indicator to any TradingView chart by selecting "Canuck Trading Indicator" from the Pine Script library.
Interpret Signals:
Bullish Signals: Green triangles (short-term entry), lime diamonds (breakout), blue circles (long-term entry).
Bearish Signals: Red triangles (short-term entry), maroon diamonds (breakout).
Options Strategies: Purple squares (cash-secured puts), yellow circles (straddles/strangles), orange crosses (iron condors), white arrows (short squeezes).
Exits: X-cross shapes in corresponding colors indicate exit signals.
Monitor: Gray circles suggest holding cash or monitoring for setups.
Review Table: Check the top-right table for real-time metrics, including zone status, RSI, MACD, trends, and MA positioning.
Set Alerts: Configure alerts for specific signals (e.g., "Short-Term Bullish Entry" or "Golden Cross") to receive notifications via TradingView.
Adjust Inputs: Customize input parameters (e.g., RSI period, EMA length, ATR period) to suit your trading style or market conditions.
Input Parameters
The indicator offers a wide range of customizable inputs to fine-tune its behavior:
RSI Period (default: 14): Length for RSI calculation.
RSI Bullish Low/High (default: 35/70): RSI thresholds for bullish signals.
RSI Bearish High (default: 65): RSI threshold for bearish signals.
EMA Period (default: 15): Main EMA length (15 for day trading, 50 for swing).
Short/Long EMA Length (default: 3/20): For momentum oscillator.
T3 Smoothing Length (default: 5): Smooths momentum signals.
Long-Term EMA/RSI Length (default: 20/15): For long-term trend analysis.
Support/Resistance Lookback (default: 5): Periods for support/resistance levels.
MACD Fast/Slow/Signal (default: 12/26/9): MACD parameters.
Bollinger Bands Period/StdDev (default: 15/2): BB settings.
Stochastic RSI Period/Smoothing (default: 14/3/3): Stochastic RSI settings.
Uptrend/Short-Term/Long-Term Lookback (default: 2/2/5): Candles for trend detection.
ATR Period (default: 14): For volatility and price targets.
VWAP Sensitivity (default: 0.1%): Threshold for VWAP-based signals.
Volume Oscillator Period (default: 14): For volume surge detection.
Pattern Detection Threshold (default: 0.3%): Sensitivity for candlestick patterns.
ROC Period (default: 3): Rate of change for momentum.
VWAP Slope Period (default: 5): For VWAP trend analysis.
TradingView Publishing Compliance
Originality: The Canuck Trading Indicator is an original script, combining multiple technical indicators and custom logic to provide unique trading signals. It does not replicate existing public scripts.
No Guaranteed Profits: This indicator is a tool for technical analysis and does not guarantee profits. Trading involves risks, and users should conduct their own research and risk management.
Clear Instructions: The description and usage guide are detailed and accessible, ensuring users understand how to apply the indicator effectively.
No External Dependencies: The script uses only built-in Pine Script functions (e.g., ta.rsi, ta.ema, ta.vwap) and requires no external libraries or data sources.
Performance: The script is optimized for performance, using efficient calculations and adaptive parameters to minimize lag on various timeframes.
Visual Clarity: Signals are plotted with distinct shapes and colors, and the table provides a concise summary of market conditions, enhancing usability.
Limitations and Risks
Market Conditions: The indicator may generate false signals in choppy or low-liquidity markets. Always confirm signals with additional analysis.
Timeframe Sensitivity: Performance varies by timeframe; test settings on your preferred chart (e.g., 5-minute for day trading, daily for swing trading).
Risk Management: Use stop-losses and position sizing to manage risk, as suggested in alert messages (e.g., "Stop -20%").
Options Trading: Options strategies (e.g., straddles, iron condors) carry unique risks; consult a financial advisor before trading.
Feedback and Support
For questions, suggestions, or bug reports, please leave a comment on the TradingView script page or contact the author via TradingView. Your feedback helps improve the indicator for the community.
Disclaimer
The Canuck Trading Indicator is provided for educational and informational purposes only. It is not financial advice. Trading involves significant risks, and past performance is not indicative of future results. Always perform your own due diligence and consult a qualified financial advisor before making trading decisions.
ابحث في النصوص البرمجية عن "VWAP"

SPY 0DTE Scalper - Auto AlertsTimeframes:
Main chart: 1-minute (for precision entries)
Confirmations: 3-minute or 5-minute (to avoid fakeouts)
Indicators I Use:
VWAP – Orange line → Institutional fair value
EMA 9 – Green line → Short-term momentum
EMA 21 – Red line → Trend filter
Custom Pullback Signal Script – Marks buy/sell/pullback signals with labels (triangles)
Above VWAP = Bullish Bias
Below VWAP = Bearish Bias
Institutions treat this as the "fair price" — so I do too.
EMA 9 (Green):
If price hugs or bounces off EMA 9 = 🔥 strong continuation move.
I use this as my guide for momentum.
EMA 21 (Red):
Great for trend confirmation.
Above EMA 21 = Trend building to the upside.
Below EMA 21 = Weakness or possible reversal.
💸 Step 3: How I Read the Signals
✅ BUY Signal:
Price breaks above VWAP with volume 1.5x+ average
Candle must close strong (not a wickfest)
EMA 9 becomes my trailing stop for the move
🚨 SELL Signal:
Price breaks below VWAP with strong volume
Clean body close below → momentum shift to the downside
EMA 9 again = trailing resistance guide
🔵 Pullback Long (Blue Triangle Under Candle):
Bullish continuation entry
Price pulls back to EMA 9 or 21, but stays above VWAP
Low-risk re-entry after a breakout
🟣 Pullback Short (Purple Triangle Above Candle):
Bearish continuation entry
Price retraces into EMA 9, but stays below VWAP & EMA 21
Ideal for catching second legs after breakdowns

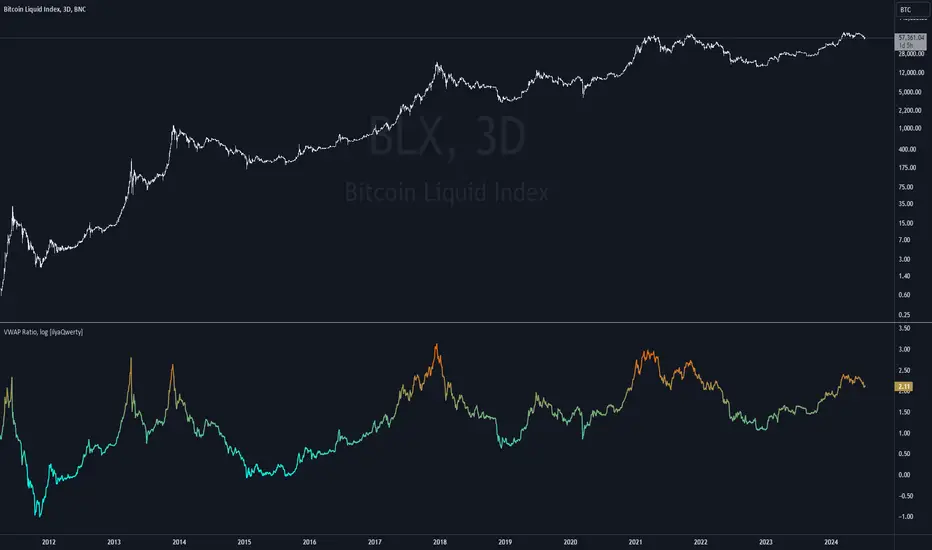
Volume Weighted Average Price Ratio (log) [ilyaQwerty]The VWAP Ratio indicator is a valuable tool for traders aiming to assess market trends and price movements in relation to the Volume Weighted Average Price (VWAP). Volume Weighted Average Price Ratio represents the ratio of the price of the asset compared to total traded volume in US Dollars. In a context of Bitcoin, VWAP ratio helps traders assess the market state, if it is overvalued or undervalued. High values of the indicator can suggest that the market is highly overvalued and low values can indicate a great buying opportunity.
Ratio Calculation: The VWAP Ratio is computed by dividing the current price by the VWAP (Price / VWAP). VWAP represents a ratio between a cumulative sum of a traded value (price multiplied by the volume) and a cumulative traded volume.
BTC-Specific Optimization: Although the indicator can be applied to various assets, the VWAP Ratio indicator is particularly useful for Bitcoin (BTC) due to its significant trading volume and unique market behaviour.
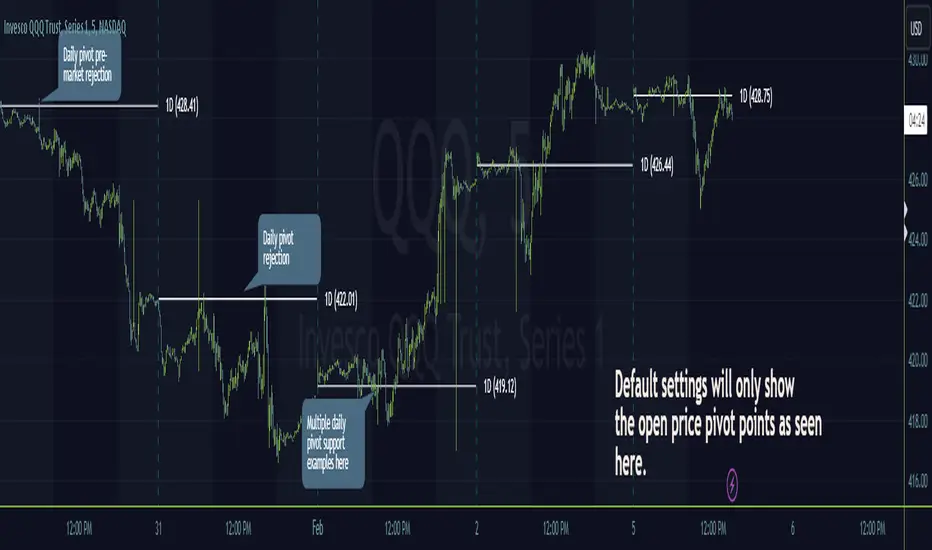
Timeframe PivotsUse this tool to plot open prices from any timeframe as a pivot level with the option to go advanced and turn on extensions (instructions below), which review the relationship between previous and current open prices to build range extensions up to six levels wide.
Please be aware extensions, nor vwap are not enabled by default! It is up to the user to determine how they wish to setup this indicator. Please read the full description for utilizing this indicator so that it's well known the complete feature set and understanding of how to enable additional plots, complete instruction is provided for all users below.
Default configuration example:
To enable extensions the user must open the indicator configuration by clicking the gear icon for "Timeframe Pivots", depending on screen resolution scrolling with mouse may need to occur in order to find the section labeled "Extensions", use the mouse or equivalent human interface device to check the checkbox to the right of the color plots and line type drop down.
Extensions enabled example:
Timeframe Selection
Timeframes available to the indicator are any timeframe the platform makes available to the user by default, or also if the TradingView user has higher tier plan to create custom timeframes - those should be available as well. To adjust timeframe the user must open the indicator configuration by clicking the gear icon for "Timeframe Pivots", depending on screen resolution scrolling with mouse may need to occur in order to find the input labeled "Timeframe", use the mouse or equivalent human interface device select the drop down and select timeframe suitable to users application.
How the extension width and extensions are calculated:
The exact process takes the new timeframe change open price calculates the difference between prior open, once that has been completed then it's divided in half to build extensions.
Code example:
Extension Width = (Open - Open ) / 2
How the extensions are calculated:
// +1 for positive extension, -1 for negative extension
(Extension Width * (Configured Multiplier * 1)) + Pivot Open Price
+1 Extension:
$5 * (1.0 * 1) + $400 = $405
-1 Extension:
$5 * (1.0 * -1) + $400 = $395
So it should be established how each projected extension, either positive or negative, is created.
Range bound market detection and notes:
One note regarding the ranges, sometimes the open prices of each period can be close in proximity to their predecessor, there's not enough range to build meaningful projections. In these situations this means the market is most likely range bound and prior range data is utilized to continue providing guidance. This addresses an issue with other pivot indicators that will instead blindly follow price and present useless pivot ranges.
It does this through detection of average half range widths, the last 14 ranges to be exact, if the current, (open - open / 2), half range width is smaller than the average, prior half range width will be used.
Code example:
// assume past half range widths are 10, 8, 9, 5, 14, 7, 7, 9, 10, 10, 4, 7, 7, 8
float v_halfRangeWidthToUseForExtensions = na
v_priorHalfRangeWidth = 10
v_avgHalfRangeWidth = 8.2 // past range widths sum = 115 / 14
v_newHalfRangeWidthToUseForExtensions = 2 // new open - open is tiny compared to avg
if v_newHalfRangeWidthToUseForExtensions < v_avgHalfRangeWidth
// replace new half range width with previous one
v_newHalfRangeWidthToUseForExtensions := v_priorHalfRangeWidth
In the code example above if the new half range width was above or equal to the rolling average, no adjustment would be made by the indicator.
VWAP
Additional feature of showing vwap, anchored to the same timeframe as the pivot, provides a trend and volume analysis within the confines of the pivots range.
The user must open the indicator configuration by clicking the gear icon for "Timeframe Pivots", scroll using mouse to the "VWAP" section and click the checkbox next to the "Source" field, past the color plots. They are not enabled by default!
The user can also add the bands for VWAP by clicking the checkbox next to the "Bands" field, past the color plots. They are not enabled by default!
VWAP calculations begin from open price of new timeframe change, then afterwards the "Source" set is utilized, the default is HLC3 which is standard for VWAP indicators.
Multiple Timeframe Analysis (MTFA)
It's simple to create a unique combination of favored timeframes for multiple timeframe analysis, consider daily, weekly and monthly combined analysis for powerful indications of market sentiment and directional bias.
Example MTFA demonstration:
Why was this created?
I created this while investigating the efficacy of open price ranges, it became apparent that these pivot ranges are some of the more price respecting pivots I've ever observed. I also grew tired of lack of price adherence to other pivot indicators widely available.
There exists a relationship between each timeframes open price in comparison to prior open price, if the market is willing to navigate to a prior lower open price from higher open price, it could be perceived as bearish and the extensions (if enabled as instructed above), could be suitable range based projections for future price movements.
Example comparison:
As can be seen, and there are many examples, where Timeframe Pivots provides more discreet levels and potential explanations for price movements.
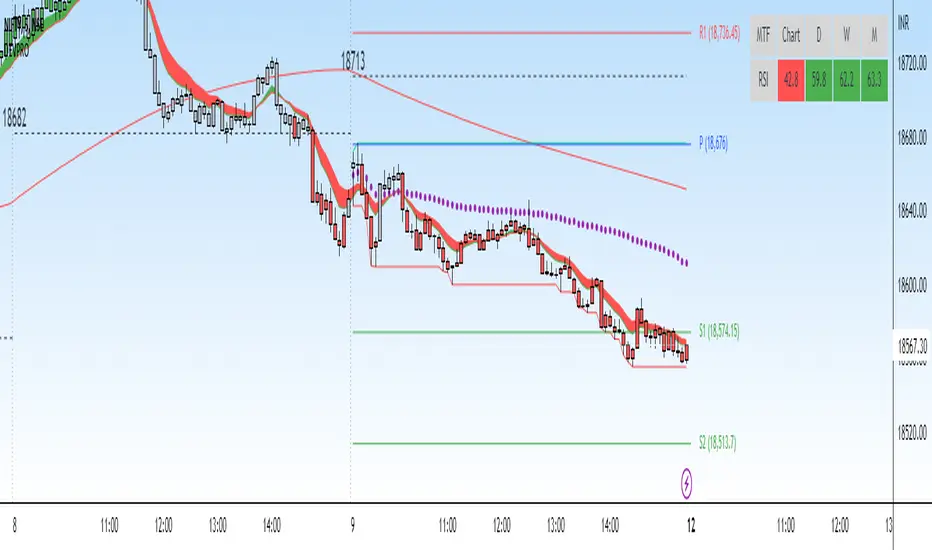
DEVPRO TradingDEVPRO Trading system comprises of the following:
D - Double (EMA and VWAP)
E - EMA
V - VWAP (current and previous day ending VWAP level)
P - Standard Pivot Point
R - RSI (Multi-time frame table is added at the top and traders can add standard RSI 14 as an additional non-overlay indicator)
O - OI data (not available for options trading in TV but trader can always check in their broker terminal)
Double EMA have been color coded in red and green for bullish and bearish trends.
Candles are colored for bullish (green), sideways (grey) and bearish (red) phases.
Setup to be traded with monthly options for stocks and weekly options for indices.
Bullish Setup:
RSI greater than 50
Current candle close above VWAP and previous day closing VWAP
Current candle close above daily Pivot
For option buying (Call option OI should be falling below its moving average 20 meaning short covering)
For option selling (Put option OI should be rising above its moving average 20 meaning Put writers confidence is increasing)
Book partial qty profits at R1/R2/R3 and/or exit completely on Doji candle low break
Bearish Setup:
RSI less than 50
Current candle close below VWAP and previous day closing VWAP
Current candle close below daily Pivot
For option buying (Put option OI should be falling below its moving average 20 meaning short covering)
For option selling (Call option OI should be rising above its moving average 20 meaning Call writers confidence is increasing)
Book partial qty profits at S1/S2/S3 and/or exit completely on Doji candle high break
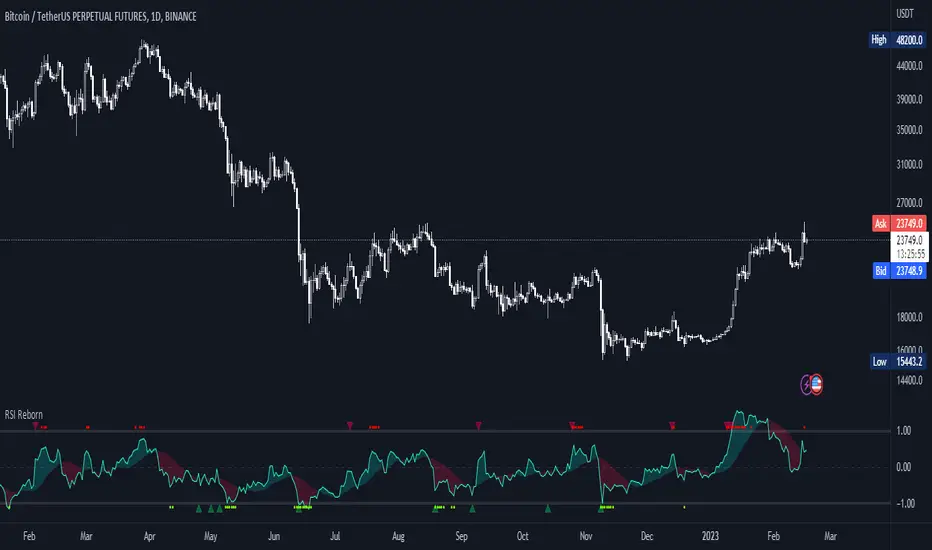
RSI Reborn [New Formula]A unique non-standard RSI formula with my extensions.
The indicator is displayed without delays and repaints, immediately after the close of the candle.
This formula allows me to correctly include the moving average in the calculation. The calculation allows me to display RSI with any type of MA.
By default I use EMA, with this type of MA my RSI is not visually different from a regular RSI.
I have 11 types of RSI to choose from:
'EMA'
'ALMA'
'RMF'
'TilsonT3'
'ARSI'
'RMA'
'SMA'
'VWMA'
'WMA'
'WWMA'
'ZEMA'
You also have a choice of RSI display:
As candlesticks and as a simple line.
You can adjust the colors in the Style tab.
When you select 'Candles' type, you can make the wicks transparent if they bother you.
I also added a source selection. By default, any RSI uses the Close source.
But you can choose any of 15:
VWAP, Close, Open, HL2, HLC3, OHLC4, Volume, High, Low, vwap(Close), vwap(Open), vwap(High), vwap(Low), AVG(vwap(H,L)), AVG(vwap(O,C)).
Additional extensions:
Additional RSI added.
By default, the extra RSI is twice as long as the regular RSI. Despite the value of 14. The "Multiple of Current TF" function allows calling RSI from a timeframe twice as long as the current one, if it is equal to 2. If it is equal to 3, then it will be 3 times longer than the current timeframe. And so on.
An additional moving average has been added.
You can use it as an ordinary additional line. Or leave it as Cloud by default.
A unique oversold/oversold formula in the form of small red/green dots has been added.
Bolinger Bands feature has also been added.
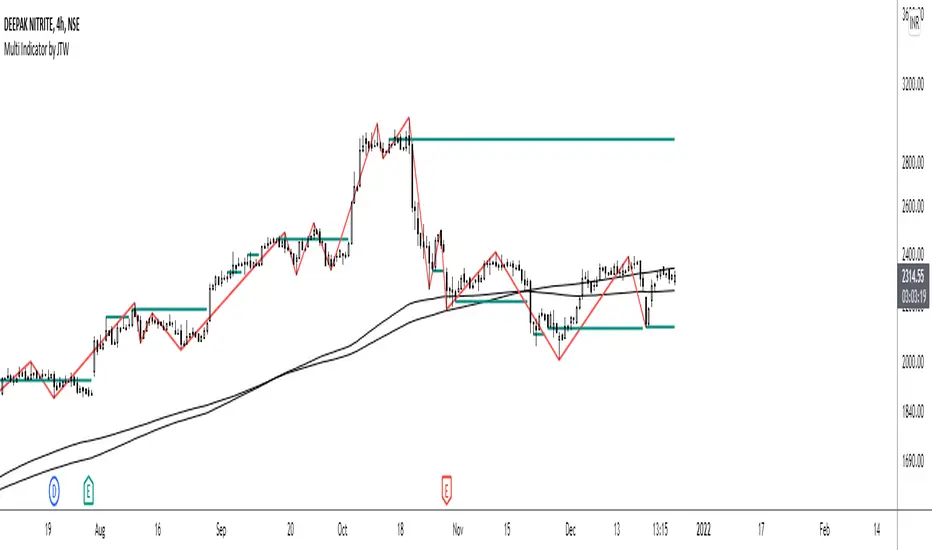
Multi-Indicator by johntradingwickThe Multi-Indicator includes the functionality of the following indicators:
1. Market Structure
2. Support and Resistance
3. VWAP
4. Simple Moving Average
5. Exponential Moving Average
Functionality of the Multi-Indicator:
Market Structure
As we already know, the market structure is one of the most important things in trading. If we are able to identify the trend correctly, it takes away a huge burden. For this, I have used the Zig Zag indicator to identify price trends. It plots points on the chart whenever the prices reverse by a larger percentage than a predetermined variable. The points are then connected by straight lines that will help you to identify the swing high and low.
This will help you to filter out any small price movements, making it easier to identify the trend, its direction, and its strength levels. You can change the period in consideration and the deviation by changing the deviation % and the depth.
Support and Resistance
The indicator provides the functionality to add support and resistance levels. If you want more levels just change the timeframe it looks at in the settings. It will pull the SR levels off the timeframe specified in the settings.
You can select the timeframe for support and resistance levels. The default time frame is “same as the chart”.
You can also extend lines to the right and change the width and colour of the lines. There is also an option to change the criteria to select the lines as valid support or resistance. You can extend the S/R level or use the horizontal lines to mark the level when there is a change in polarity.
VWAP
Volume Weighted Average Price (VWAP) is used to measure the average price weighted by volume. VWAP is typically used with intraday charts as a way to determine the general direction of intraday prices. It's similar to a moving average in that when the price is above VWAP, prices are rising and when the price is below VWAP, prices are falling. VWAP is primarily used by technical analysts to identify market trend.
Simple Moving Average
A simple Moving Average is an unweighted Moving Average. This means that each day in the data set has equal importance and is weighted equally. As each new day ends, the oldest data point is dropped and the newest one is added to the beginning.
The multi-indicator has the ability to provide 5 moving averages. This is particularly helpful if you want to use various time periods such as 20, 50, 100, and 200. Although this is just basic functionality, it comes in handy if you are using a free account.
Exponential Moving Average
An exponential moving average (EMA) is a type of moving average (MA) that places a greater weight and significance on the most recent data points. An exponentially weighted moving average reacts more significantly to recent price changes than a simple moving average. The multi-indicator provides 5 exponential moving averages. This is particularly helpful if you want to use various time periods such as 20, 50, 100, and 200.
Aroon (Any Source)Aroon (Any Source)
Overview
This indicator is an enhanced version of the classic Aroon Oscillator. It measures trend dominance based on the recency of highs and lows, with added flexibility to operate on any chosen source series and an optional price-scaling mechanism based on VWAP distance.
What the Indicator Does
The Aroon Oscillator compares how recently the most recent high and low occurred within a lookback window. The result is a bounded oscillator that indicates whether buyers or sellers are currently dominant.
This version adds: - Ability to run Aroon on any source - Optional smoothing to reduce noise - Optional VWAP-based price scaling
Core Outputs
• Aroon Up (0–100): Strength of recent highs
• Aroon Down (0–100): Strength of recent lows
• Aroon Oscillator (−100 to +100): Net dominance (Up − Down)
Inputs and Options
• Source: Input series used for calculations
• Aroon Length: Lookback window
• Use Source for High/Low: Enables Aroon-like mode on any series
• Show Oscillator: Toggles oscillator plot
• Show Aroon Up/Down: Toggles component lines
• Smooth Oscillator: Light smoothing (EMA/RMA/SMA)
• VWAP Price Scaling: Scales signal by VWAP distance normalized by ATR
How to Use It
Use the oscillator as a trend regime filter. Positive values indicate bullish dominance; negative values indicate bearish dominance. VWAP scaling helps suppress signals near equilibrium and emphasize extended moves.
Practical Notes
• Measures recency, not magnitude
• Best used as a regime or bias input
• Especially effective intraday with VWAP scaling

INSTITUTIONAL VOLUME PROFILE + FIBONACCI + ENHANCED SIGNALS🎯 INSTITUTIONAL VOLUME PROFILE + FIBONACCI + ENHANCED SIGNALS
A professional-grade indicator combining Volume Profile analysis, Fibonacci retracements, Anchored VWAP, and intelligent signal filtering to identify high-probability institutional positioning and trade setups.
📊 CORE FEATURES
▸ Volume Profile with POC (Point of Control)
- Visualizes where institutional volume accumulated
- Identifies High Volume Nodes (HVN) as key support/resistance
- Shows Value Area (70% volume zone) for market equilibrium
▸ Dynamic Fibonacci Levels
- Auto-detects swing high/low for retracement levels
- Golden Pocket (0.618-0.65) highlight zone
- Bull/bear direction recognition
▸ Anchored VWAP
- Anchored to swing range start
- Institutional mean reversion baseline
- Real-time trend bias indicator
▸ Graded Signal System (A+/B/C)
- A+ Signals: High probability setups (VWAP cross + POC alignment)
- B Signals: Above-average quality (VWAP cross above POC)
- C Signals: Lower probability (counter-trend setups)
🎮 DISPLAY MODES
⚡ TRADING LIVE MODE
- Clean chart showing only A+ signals
- Minimal visual noise for active trading
- Perfect for intraday execution
📈 FULL OVERVIEW MODE
- Complete analysis with all zones visible
- Volume Profile + Fibonacci + Value Area
- All signal grades displayed
- Statistics dashboard
🔬 ADVANCED SIGNAL FILTERS
✓ Volume Confirmation
- Requires above-average volume on signals
- Filters out weak institutional participation
- Configurable volume multiple (default 1.2x)
✓ Momentum Filter
- Ensures price momentum aligns with signal direction
- Prevents counter-trend entries
- Configurable lookback period
✓ SR Proximity Upgrade ⭐ GAME CHANGER
- Automatically upgrades B/C signals to A+ when near key levels
- Detects proximity to POC and HVN zones
- Combines technical confluence for best setups
🔔 SMART ALERTS
▸ Configurable alerts for A+, B, or C signals
▸ Real-time notifications to your device
▸ No need to watch charts constantly
▸ "Once per bar close" prevents repainting
💡 HOW TO USE
FOR DAY TRADING:
1. Switch to "Trading Live" mode
2. Enable only A+ alerts
3. Set filters: Volume 1.5x, Momentum ON, Proximity 0.3%
4. Trade only A+ signals at key levels
FOR SWING TRADING:
1. Use "Full Overview" mode
2. Analyze Value Area and Fibonacci confluence
3. Set filters: Volume 1.2x, Momentum ON, Proximity 0.8%
4. Enter on A+ signals with multi-timeframe confirmation
FOR ANALYSIS:
1. Full Overview mode with all visuals enabled
2. Disable filters to see all raw signals
3. Study how institutions positioned at key zones
4. Plan trades around POC and Value Area
⚙️ RECOMMENDED SETTINGS
5-15 MIN CHARTS (Scalping):
- Lookback: 200-300 bars
- Volume: 1.5x, Momentum: 5 bars, Proximity: 0.3%
- Trading Live mode + A+ alerts only
1 HOUR CHARTS (Intraday):
- Lookback: 300 bars
- Volume: 1.3x, Momentum: 3 bars, Proximity: 0.5%
- Full Overview or Trading Live
4 HOUR CHARTS (Swing):
- Lookback: 300-500 bars
- Volume: 1.2x, Momentum: 3 bars, Proximity: 0.8%
- Full Overview mode
DAILY CHARTS (Position):
- Lookback: 300-500 bars
- Volume: 1.1x, Momentum: 2 bars, Proximity: 1.0%
- Full Overview mode
📈 KEY CONCEPTS
POC (Point of Control): Price level with highest volume - acts as magnet
Value Area: Zone containing 70% of volume - equilibrium range
HVN: High Volume Nodes - institutional accumulation zones
AVWAP: Anchored VWAP - institutional average entry price
Golden Pocket: 0.618-0.65 Fib zone - highest probability reversal area
🎯 TRADING STRATEGY TIPS
1. Wait for A+ signals - quality over quantity
2. Best setups occur at POC or Value Area boundaries
3. Use multiple timeframes for confirmation
4. Combine with your own risk management rules
5. Signals are high probability, not guaranteed - always use stops

Ripster Clouds + Saty Pivot + RVOL + Trend1. Ripster EMA Clouds (local + higher timeframe)
Local timeframe (your chart TF):
Plots up to 5 EMA clouds (8/9, 5/12, 34/50, 72/89, 180/200 – configurable).
Each cloud is:
One short EMA and one long EMA.
A filled band between them.
Color logic:
Cloud is bullish when short EMA > long EMA (green/blue-ish tone).
Bearish when short EMA < long EMA (red/orange/pink tone).
You can choose:
EMA vs SMA,
Whether to show the lines,
Per-cloud toggles.
MTF Clouds:
Two higher-timeframe EMA clouds:
Cloud 1: 50/55
Cloud 2: 20/21
Computed on a higher TF (default D, but configurable).
Show as thin lines + transparent bands.
Used for:
Visual higher-TF trend,
Optional signal filter (MTF must agree for trades).
2. Saty Pivot Ribbon (time-warped EMAs)
This is basically your Saty Pivot Ribbon integrated:
Uses a “Time Warp” setting to overlay EMAs from another timeframe.
EMAs:
Fast, Pivot, Slow (defaults 8 / 21 / 34).
Clouds:
Fast cloud between fast & pivot EMAs.
Slow cloud between pivot & slow EMAs.
Bullish/bearish colors are distinct from Ripster colors.
Optional highlights:
Can highlight fast/pivot/slow lines separately.
Conviction EMAs:
13 and 48 EMAs (configurable).
When fast conviction EMA crosses over/under slow:
You get triangle arrows (bullish/bearish conviction).
Bias candles:
If enabled, candles are recolored based on:
Price vs Bias EMA,
Candle up/down/doji,
So you see bullish/bearish “bias” directly in candle colors.
3. DTR vs ATR panel (range vs average)
In a small table panel (bottom-center by default):
Computes higher-TF ATR (default 14, TF auto D/W/M, smoothing type selectable).
Measures current range (high–low) on that TF.
Displays:
DTR: X vs ATR: Y Z% (+/-Δ% vs prev)
Where:
Z% = current range / ATR * 100.
Δ% = change vs previous bar’s Z%.
Background color:
Greenish for low move (<≈70%),
Red for high move (≥≈90%),
Yellow in between,
Slightly dimmed when price is below bias EMA.
This tells you: “Is today an average, quiet, or explosive day compared to normal?”
4. SMA Divergence panel
Separate histogram & line panel:
Fast and slow SMAs (default 14 & 30).
Computes price divergence vs SMA in %:
% above/below slow SMA,
% above/below fast SMA.
Shows:
Slow SMA divergence as a semi-transparent column,
Fast SMA divergence as a solid column on top,
EMA of the slow divergence (trend line) colored:
Blue when rising,
Orange/red when falling.
Static upper/lower bands with fill, plus optional zero line.
This gives you a feel for how stretched price is vs its anchors.
5. RVOL table (relative volume)
Small 3×2 table (bottom-right by default):
Inputs:
Average length (default 50 bars),
Optionally show previous candle RVOL.
Calculates:
RVOL now = volume / avg(volume N bars) * 100,
RVOL prev,
RVOL momentum (now – prev) for data window only.
Table columns:
Candle Vol,
RVOL (Now),
RVOL (Prev).
Colors:
200% → “high RVOL” color,
100–200% → “medium RVOL” color,
<100% → “low RVOL” color,
Slightly dimmer if price is below bias EMA.
This is used both visually and optionally as a signal filter (e.g., only trade when RVOL ≥ threshold).
6. Trend Dashboard (Price + 34/50 + 5/12)
Top-right trend box with 3 rows:
Price Action row:
Uses either Bias EMA or custom EMA on close to say:
Bullish (close > trend EMA),
Bearish (close < trend EMA),
Flat.
Ripster 34/50 Cloud row:
Uses 34/50 EMAs: bullish if 34>50, bearish if 34<50.
Ripster 5/12 Cloud row:
Uses 5/12 EMAs: bullish if 5>12, bearish if 5<12.
Then it does a vote:
Counts bullish votes (Price, 34/50, 5/12),
Counts bearish votes,
Depending on mode:
Majority (2 of 3) or Strict (3 of 3).
Output:
Overall Bullish / Bearish / Sideways.
You also get an optional label on the chart like
Overall: Bullish trend with color, and an optional background tint (green/red for bull/bear).
7. VWAP + Buy/Sell Signals
VWAP is plotted as a white line.
Fast “trend” cloud mid: average of 5 & 12 EMAs.
Slow “trend” cloud mid: average of 34 & 50 EMAs.
Buy condition:
5/12 crosses above 34/50 (bullish cloud flip),
Price > VWAP,
Optional filter: MTF Cloud 1 bullish (50/55 on higher TF),
Optional filter: RVOL >= threshold.
Sell condition:
5/12 crosses below 34/50,
Price < VWAP,
Optional same filters but bearish.
When conditions are met:
Plots BUY triangle up below price (distinct teal/green tone).
Plots SELL triangle down above price (distinct magenta/orange tone).
Alert conditions are defined for:
BUY / SELL signals,
Overall Bullish / Bearish / Sideways change,
MTF Cloud 1 trend flips.
8. Data Window metrics
For easy backtesting / inspection via TradingView’s data window, it exposes:
DTR% (Current) and DTR% Momentum,
RVOL% (Now), RVOL% (Prev), RVOL% Momentum.
TL;DR – What does this script do for you?
It turns your chart into a multi-framework trend and momentum dashboard:
Ripster EMA clouds for short/medium trend & S/R.
Saty Ribbon for higher-TF pivot structure and conviction.
RVOL + DTR/ATR for context (is this a big and well-participated move?).
SMA divergence panel for overextension/stretch.
A compact trend table that tells you Price vs 34/50 vs 5/12 in one glance.
Buy/Sell markers + alerts when:
short-term Ripster trend (5/12) flips over/under medium (34/50),
price agrees with VWAP,
plus optional filters (MTF trend and / or RVOL).
Basically: it’s a trend + confirmation + context system wrapped into one indicator, with most knobs configurable in the settings.

Impulse Day PlanOverview
This script provides a structured intraday trade plan built on three interacting components:
Impulse-based TP/SL system
Detects trend bias shifts and automatically generates Entry, TP1–TP3 and SL based on impulse range projections. Targets update dynamically and wick-touch confirmation is used for accurate ✓ tracking.
ATR day zones
A blended ATR model (Daily + selected base timeframe) produces support, balance and resistance zones derived from the previous session close. These zones provide directional context and realistic intraday expansion boundaries.
VWAP/EMA trend filter
Trend confirmation is applied using VWAP and EMA 50/200 structure. Signals are only considered aligned when price, VWAP and EMA trend agree.
The script displays a compact dashboard with the active trade plan, including:
Entry
TP1, TP2, TP3
Stop Loss
Checkmarks showing completed targets
This makes the indicator a planning framework, not a simple overlay.
How it differs from my previous publications
I previously released:
Smart Money OB + Limit Orders + Priority
SM OB Intraday Bot Assistant
Impulse TP/SL Zones
Those scripts focus on isolated concepts such as Smart Money structure, intraday automation or basic impulse mapping.
This script introduces a new integrated workflow: impulse TP/SL logic, ATR day zones and VWAP/EMA trend confirmation operating together as a single system. It does not reproduce the functionality of my previous tools and is designed as a standalone intraday planning method.
How to use
Select a base timeframe for the ATR zone model (15m, 1H, 4H).
Follow the dashboard for entry, targets and SL.
Use ATR zones to understand where targets sit within the day’s expected range.
Execute trades only when impulse signal and VWAP/EMA trend align.

Execution Heatmap v4.1 — AI EnhancedThis indicator is an AI‑style execution dashboard that compresses structure, momentum, volume, volatility, and risk into a compact heatmap panel plus BUY/SELL signals on the chart. It is specifically tuned for gold and silver, automatically adapting its thresholds to the volatility profile of XAU/GC and XAG/SI symbols.
Core architecture
The system builds a multi‑factor model in layers:
Adaptive structure engine: Tracks dynamic higher‑high / lower‑low progression using rolling reference highs and lows, classifying price as structural UP, DOWN, or NEUTRAL.
Precision VWAP bias: Uses VWAP with a small threshold band to filter out noise and label price as ABOVE, BELOW, or neutral relative to value.
Impulse & angle: Combines short‑term rate of change and normalized slope (price vs ATR over 5 bars) to detect directional thrust, then clamps values into
for stable scoring.
Volume, wicks, and patterns
Adaptive volume tiers: Uses a 20‑bar volume average with gold/silver‑specific multipliers to tag candles as SURGE, HIGH, NORMAL, or LOW volume, with distinct coloring for extremes.
Wick analytics: Measures upper/lower wick size vs total range to detect demand/supply style rejections and encode them as bullish or bearish wick signals.
AI pattern score: Blends structure, VWAP, impulse, wicks, and angle into a normalized pattern score, then classifies it as STRONG↑, NEU↑, NEU, NEU↓, or STRONG↓ with color‑coded emphasis.
AI scoring and prediction layer
Predictive engine: Uses a neural‑network‑style weighted sum of structure, VWAP, impulse, wicks, angle, volume, and pattern to generate a prediction score in
, then converts it into a percentage and arrow (↑, ↑↑, ↓, ↓↓, →) for intuitive directional bias.
Execution score: Aggregates key factors into an EXEC score (0–200+ style scale), color‑graded from weak (red) through medium (orange) to strong (green) execution context.
Uncertainty & risk: Separately models uncertainty (low impulse/angle or low conviction) and risk (fake breaks, VWAP position, uncertainty tier, low volume), then feeds them into a combined confidence calculation.
Final signal & confidence
Final classification:
BUY: High exec score, high confidence, and controlled risk.
SELL: Very low exec score, low confidence in upside, and acceptable risk.
WAIT: All other conditions where edge or clarity is insufficient.
Confidence bar: A textual mini‑bar (🟩 blocks) plus percentage shows how strong the current signal environment is, making it easy to visually gauge setup quality at a glance.
Professional heatmap panel
A two‑column table in the top‑right of the chart organizes the logic into layers:
Base layer: STRUCT, VWAP, IMPULSE, VOLUME.
AI layer: FAKE, REGIME (Trend/Pullback/Reverse/Chop), ANGLE.
Decision layer: PATTERN, PREDICT, EXEC, RISK, CONF, and FINAL direction.

NIFTY Weekly Option Seller DirectionalHere’s a straight description you can paste into the TradingView “Description” box and tweak if needed:
---
### NIFTY Weekly Option Seller – Regime + Score + Management (Single TF)
This indicator is built for **weekly option sellers** (primarily NIFTY) who want a **structured regime + scoring framework** to decide:
* Whether to trade **Iron Condor (IC)**, **Put Credit Spread (PCS)** or **Call Credit Spread (CCS)**
* How strong that regime is on the current timeframe (score 0–5)
* When to **DEFEND** existing positions and when to **HARVEST** profits
> **Note:** This is a **single timeframe** tool. The original system uses it on **4H and 1D separately**, then combines scores manually (e.g., using `min(4H, 1D)` for conviction and lot sizing).
---
## Core logic
The script classifies the market into 3 regimes:
* **IC (Iron Condor)** – range/mean-reversion conditions
* **PCS (Put Credit Spread)** – bullish/trend-up conditions
* **CCS (Call Credit Spread)** – bearish/trend-down conditions
For each regime, it builds a **0–5 score** using:
* **EMA stack (8/13/34)** – trend structure
* **ADX (custom DMI-based)** – trend strength vs range
* **Previous-day CPR** – in CPR vs break above/below
* **VWAP (session)** – near/far value
* **Camarilla H3/L3** – for IC context
* **RSI (14)** – used as a **brake**, not a primary signal
* **Daily trend / Daily ADX** – used as **hard gates**, not double-counted as extra points
Then:
* Scores for PCS / CCS / IC are **cross-penalised** (they pull each other down if conflicting)
* Final scores are **smoothed** (current + previous bar) to avoid jumpy signals
The **background colour** shows the current regime and conviction:
* Blue = IC
* Green = PCS
* Red = CCS
* Stronger tint = higher regime score
---
## Scoring details (per timeframe)
**PCS (uptrend, bullish credit spreads)**
* +2 if EMA(8) > EMA(13) > EMA(34)
* +1 if ADX > ADX_TREND
* +1 if close > CPR High
* +1 if close > VWAP
* RSI brake:
* If RSI < 50 → PCS capped at 2
* If RSI > 75 → PCS capped at 3
* Daily gating:
* If daily EMA stack is **not** uptrend → PCS capped at 2
**CCS (downtrend, bearish credit spreads)**
* +2 if EMA(8) < EMA(13) < EMA(34)
* +1 if ADX > ADX_TREND
* +1 if close < CPR Low
* +1 if close < VWAP
* RSI brake:
* If RSI > 50 → CCS capped at 2
* If RSI < 25 → CCS capped at 3
* Daily gating:
* If daily EMA stack is **not** downtrend → CCS capped at 2
**IC (range / mean-reversion)**
* +2 if ADX < ADX_RANGE (low trend)
* +1 if close inside CPR
* +1 if near VWAP
* +0.5 if inside Camarilla H3–L3
* +1 if daily ADX < ADX_RANGE (daily also range-like)
* +0.5 if RSI between 45 and 55 (classic balance zone)
* Daily gating:
* If daily ADX ≥ ADX_TREND → IC capped at 2 (no “strong IC” in strong trends)
**Cross-penalty & smoothing**
* Each regime’s raw score is reduced by **0.5 × max(other two scores)**
* Final IC / PCS / CCS scores are then **smoothed** with previous bar
* Scores are always clipped to ** **
---
## Regime selection
* If one regime has the highest score → that regime is selected.
* If there is a tie or close scores:
* When ADX is high, trend regimes (PCS/CCS) are preferred in the direction of the EMA stack.
* When ADX is low, IC is preferred.
The selected regime’s score is used for:
* Background colour intensity
* Minimum score gate for alerts
* Display in the info panel
---
## DEFEND / HARVEST / REGIME alerts
The script also defines **management signals** using ATR-based buffers and Camarilla breaks:
* **DEFEND**
* Price moving too close to short strikes (PCS/CCS/IC) relative to ATR, or
* Trend breaks through Camarilla with ADX strong
→ Suggests rolling away / widening / converting to reduce risk.
* **HARVEST**
* Price has moved far enough from your short strikes (in ATR multiples) and market is still range-compatible
→ Suggests booking profits / rolling closer / reducing risk.
* **REGIME CHANGED**
* Regime flips (IC ↔ PCS/CCS) with cooldown and minimum score gate
→ Suggests switching playbook (range vs trend) for new entries.
Each of these has a plotshape label plus an `alertcondition()` for TradingView alerts.
---
## UI / Panel
The **top-right panel** (optional) shows:
* Strategy + final regime score (IC / PCS / CCS, x/5)
* ADX / RSI values
* CPR status (Narrow / Normal / Wide + %)
* EMA Stack (Up / Down / Mixed) and EMA tightness
* VWAP proximity (Near / Away)
* Final **IC / PCS / CCS** scores (for this timeframe)
* H3/L3, H4/L4, CPR Low/High and VWAP levels (rounded)
These values are meant to be **read quickly at the decision time** (e.g. near the close of the 4H bar or daily bar).
---
## Intended workflow
1. Run the script on **4H** and **1D** charts separately.
2. For each timeframe, read the panel’s **IC / PCS / CCS scores** and regime.
3. Decide:
* Final regime (IC vs PCS vs CCS)
* Combined score (e.g. `AlignScore = min(Score_4H, Score_1D)`)
4. Map that combined score to **your own lot-size buckets** and trade rules.
5. During the life of the position, use **DEFEND / HARVEST / REGIME** alerts to adjust.
The script does **not** auto-calculate lot size or P&L. It focuses on giving a structured, consistent **market regime + strength + levels + management** layer for weekly option selling.
---
## Disclaimer
This is a discretionary **decision-support tool**, not a guarantee of profit or a replacement for risk management.
No performance is implied or promised. Always size positions and manage risk according to your own capital, rules, and regulations.

Stochastic Ensembling of OutputsStochastic Ensembling of Outputs
🙏🏻 This is a simple tool/method that would solve naturally many well known problems:
“Price reversed 1 tick before the actual level, not executing my limit order”
“I consider intraday trend change by checking whether price is above/below VWAP, but is 1 tick enough? What to do, price is now whipsawing around vwap...”.
“I want to gradually accumulate a position around a chosen anchor. But where exactly should I put my orders? And I want to automate it ofc.“
“All these DSP adepts are telling you about some kind of noise in the markets… But how can I actually see it?”
The easy fix is to make things more analog less digital, by synthesizing numerous noise instances & adding it to any price-applied metric of yours. The ones who fw techno & psytrance, and other music, probably don’t need any more explanations. Then by checking not just 2 lines or 1 process against another one, you will be checking cloud vs cloud of lines, even allowing you to introduce proxies of probabilities. More crosses -> more confirmation to act.
How-to use:
The tool has 2 inputs: source and target:
Sources should always be the underlying process. If you apply the tool to price based metric, leave it hlcc4 unless you have a better one point estimate for each bar;
Target is your target, e.g if you want to apply it to VWAP, pick VWAP as target. You can thee on the chart above how trading activity recently never exactly touched VWAP, however noised instances of VWAP 'were' touched
The code is clean and written in modular form, you can simply copy paste it to any script of yours if you don't want to have multiple study-on-study script pairs.
^^ applied to prev days highs and lows
^^ applied to MBAD extensions and basis
^^ applied to input series itself
Here’s how it works, no ML, no “AI”, no 1k lines of code, just stats:
The problem with metrics, even if they are time aware like WMA, is that they still do not directly gain information about “changes” between datapoints. If we pick noise characteristics to match these changes, we’d effectively introduce this info into our ops.
^^ this screenshot represents 2 very different processes: a sine wave and white noise, see how the noise instances learned from each process differ significantly.
Changes can be represented as AR1 process . It’s dead simple, no PHD needed, it’s just how the current datapoint is related (or not) to the previous datapoint, no more than 1, and how this relationship holds/evolves over time. Unlike the mainstream approach like MLE, I estimate this relationship (phi parameter) via MoM but giving more weights to more recent datapoints via exponential smoothing over all the data available on your charts (so I encode temporal information), algocomplexity is O(1), lighting fast, just one pass. <- that gives phi , we’d use it as color for our noise generator
Then we just need to estimate noise amplitude ( gamma ) via checking what AR1 model actually thought vs the reality, variance of these innovations. Same via exponential smoothing, time aware, O(1), one pass, it’s all it does.
Then we generate white gaussian noise, and apply 2 estimated parameters (phi and gamma), and that’s all.
Omg, I think I just made my first real DSP script xd
Just like Monte Carlo for risk management, this is so simple and natural I can’t believe so many “pros” hide it and never talk about it in open access. Sharing it here on TradingView would’ve not done anything critical for em, but many would’ve benefited.
∞

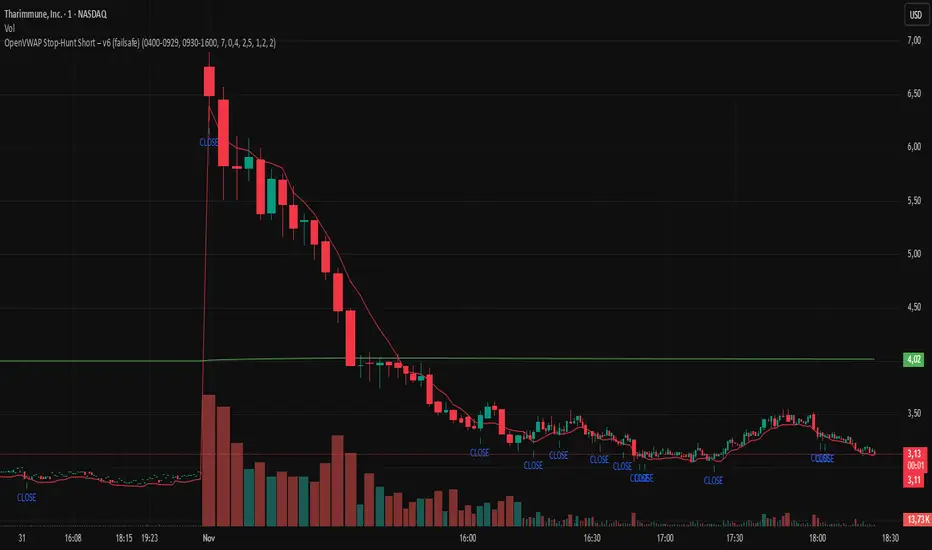
OpenVWAP Stop-Hunt Short – v6 (failsafe) ZorzOpenVWAP Stop-Hunt Short (Micro/Nano Caps)
Intraday short framework for low-float gappers (NASDAQ/NYSE), optimized for 1m (optional 15s). The script anchors VWAP to Premarket and Regular sessions, tracks PM High (PM HOD) and Open VWAP, and flags liquidity grabs.
Signal logic
SHORT when a stop-hunt above PM HOD or an Open VWAP fakeout occurs and the bar closes below Open VWAP (optional confirmation: crossunder VWMA*0.985 “long50”).
CLOSE when price reclaims Open VWAP or crosses above long50.
Inputs
Min wick%, volume spike vs SMA20, range vs ATR(1)
No-trade bars after the open (filters first noisy minutes)
Toggle ACW confirmation (VWMA*0.985)
Notes
Turn Extended Hours ON; session times are ET.
Best on micro/nano-cap gappers with high PM volume; supports alerts (“Open Short”, “Close Short”).
For research/education only; not financial advice.
Luxy BIG beautiful Dynamic ORBThis is an advanced Opening Range Breakout (ORB) indicator that tracks price breakouts from the first 5, 15, 30, and 60 minutes of the trading session. It provides complete trade management including entry signals, stop-loss placement, take-profit targets, and position sizing calculations.
The ORB strategy is based on the concept that the opening range of a trading session often acts as support/resistance, and breakouts from this range tend to lead to significant moves.
What Makes This Different?
Most ORB indicators simply draw horizontal lines and leave you to figure out the rest. This indicator goes several steps further:
Multi-Stage Tracking
Instead of just one ORB timeframe, this tracks FOUR simultaneously (5min, 15min, 30min, 60min). Each stage builds on the previous one, giving you multiple trading opportunities throughout the session.
Active Trade Management
When a breakout occurs, the indicator automatically calculates and displays entry price, stop-loss, and multiple take-profit targets. These lines extend forward and update in real-time until the trade completes.
Cycle Detection
Unlike indicators that only show the first breakout, this tracks the complete cycle: Breakout → Retest → Re-breakout. You can see when price returns to test the ORB level after breaking out (potential re-entry).
Failed Breakout Warning
If price breaks out but quickly returns inside the range (within a few bars), the label changes to "FAILED BREAK" - warning you to exit or avoid the trade.
Position Sizing Calculator
Built-in risk management that tells you exactly how many shares to buy based on your account size and risk tolerance. No more guessing or manual calculations.
Advanced Filtering
Optional filters for volume confirmation, trend alignment, and Fair Value Gaps (FVG) to reduce false signals and improve win rate.
Core Features Explained
### 1. Multi-Stage ORB Levels
The indicator builds four separate Opening Range levels:
ORB 5 - First 5 minutes (fastest signals, most volatile)
ORB 15 - First 15 minutes (balanced, most popular)
ORB 30 - First 30 minutes (slower, more reliable)
ORB 60 - First 60 minutes (slowest, most confirmed)
Each level is drawn as a horizontal range on your chart. As time progresses, the ranges expand to include more price action. You can enable or disable any stage and assign custom colors to each.
How it works: During the opening minutes, the indicator tracks the highest high and lowest low. Once the time period completes, those levels become your ORB high and low for that stage.
### 2. Breakout Detection
When price closes outside the ORB range, a label appears:
BREAK UP (green label above price) - Price closed above ORB High
BREAK DOWN (red label below price) - Price closed below ORB Low
The label shows which ORB stage triggered (ORB5, ORB15, etc.) and the cycle number if tracking multiple breakouts.
Important: Signals appear on bar close only - no repainting. What you see is what you get.
### 3. Retest Detection
After price breaks out and moves away, if it returns to test the ORB level, a "RETEST" label appears (orange). This indicates:
The original breakout level is now acting as support/resistance
Potential re-entry opportunity if you missed the first breakout
Confirmation that the level is significant
The indicator requires price to move a minimum distance away before considering it a valid retest (configurable in settings).
### 4. Failed Breakout Detection
If price breaks out but returns inside the ORB range within a few bars (before the breakout is "committed"), the original label changes to "FAILED BREAK" in orange.
This warns you:
The breakout lacked conviction
Consider exiting if already in the trade
Wait for better setup
Committed Breakout: The indicator tracks how many bars price stays outside the range. Only after staying outside for the minimum number of bars does it become a committed breakout that can be retested.
### 5. TP/SL Lines (Trade Management)
When a breakout occurs, colored horizontal lines appear showing:
Entry Line (cyan for long, orange for short) - Your entry price (the ORB level)
Stop Loss Line (red) - Where to exit if trade goes against you
TP1, TP2, TP3 Lines (same color as entry) - Profit targets at 1R, 2R, 3R
These lines extend forward as new bars form, making it easy to track your trade. When a target is hit, the line turns green and the label shows a checkmark.
Lines freeze (stop updating) when:
Stop loss is hit
The final enabled take-profit is hit
End of trading session (optional setting)
### 6. Position Sizing Dashboard
The dashboard (bottom-left corner by default) shows real-time information:
Current ORB stage and range size
Breakout status (Inside Range / Break Up / Break Down)
Volume confirmation (if filter enabled)
Trend alignment (if filter enabled)
Entry and Stop Loss prices
All enabled Take Profit levels with percentages
Risk/Reward ratio
Position sizing: Max shares to buy and total risk amount
Position Sizing Example:
If your account is $25,000 and you risk 1% per trade ($250), and the distance from entry to stop loss is $0.50, the calculator shows you can buy 500 shares (250 / 0.50 = 500).
### 7. FVG Filter (Fair Value Gap)
Fair Value Gaps are price inefficiencies - gaps left by strong momentum where one candle's high doesn't overlap with a previous candle's low (or vice versa).
When enabled, this filter:
Detects bullish and bearish FVGs
Draws semi-transparent boxes around these gaps
Only allows breakout signals if there's an FVG near the breakout level
Why this helps: FVGs indicate institutional activity. Breakouts through FVGs tend to be stronger and more reliable.
Proximity setting: Controls how close the FVG must be to the ORB level. 2.0x means the breakout can be within 2 times the FVG size - a reasonable default.
### 8. Volume & Trend Filters
Volume Filter:
Requires current volume to be above average (customizable multiplier). High volume breakouts are more likely to sustain.
Set minimum multiplier (e.g., 1.5x = 50% above average)
Set "strong volume" multiplier (e.g., 2.5x) that bypasses other filters
Dashboard shows current volume ratio
Trend Filter:
Only shows breakouts aligned with a higher timeframe trend. Choose from:
VWAP - Price above/below volume-weighted average
EMA - Price above/below exponential moving average
SuperTrend - ATR-based trend indicator
Combined modes (VWAP+EMA, VWAP+SuperTrend) for stricter filtering
### 9. Pullback Filter (Advanced)
Purpose:
Waits for price to pull back slightly after initial breakout before confirming the signal.
This reduces false breakouts from immediate reversals.
How it works:
- After breakout is detected, indicator waits for a small pullback (default 2%)
- Once pullback occurs AND price breaks out again, signal is confirmed
- If no pullback within timeout period (5 bars), signal is issued anyway
Settings:
Enable Pullback Filter: Turn this filter on/off
Pullback %: How much price must pull back (2% is balanced)
Timeout (bars): Max bars to wait for pullback (5 is standard)
When to use:
- Choppy markets with many fake breakouts
- When you want higher quality signals
- Combine with Volume filter for maximum confirmation
Trade-off:
- Better signal quality
- May miss some valid fast moves
- Slight entry delay
How to Use This Indicator
### For Beginners - Simple Setup
Add the indicator to your chart (5-minute or 15-minute timeframe recommended)
Leave all default settings - they work well for most stocks
Watch for BREAK UP or BREAK DOWN labels to appear
Check the dashboard for entry, stop loss, and targets
Use the position sizing to determine how many shares to buy
Basic Trading Plan:
Wait for a clear breakout label
Enter at the ORB level (or next candle open if you're late)
Place stop loss where the red line indicates
Take profit at TP1 (50% of position) and TP2 (remaining 50%)
### For Advanced Traders - Customized Setup
Choose which ORB stages to track (you might only want ORB15 and ORB30)
Enable filters: Volume (stocks) or Trend (trending markets)
Enable FVG filter for institutional confirmation
Set "Track Cycles" mode to catch retests and re-breakouts
Customize stop loss method (ATR for volatile stocks, ORB% for stable ones)
Adjust risk per trade and account size for accurate position sizing
Advanced Strategy Example:
Enable ORB15 only (disable others for cleaner chart)
Turn on Volume filter at 1.5x with Strong at 2.5x
Enable Trend filter using VWAP
Set Signal Mode to "Track Cycles" with Max 3 cycles
Wait for aligned breakouts (Volume + Trend + Direction)
Enter on retest if you missed the initial break
### Timeframe Recommendations
5-minute chart: Scalping, very active trading, crypto
15-minute chart: Day trading, balanced approach (most popular)
30-minute chart: Swing entries, less screen time
60-minute chart: Position trading, longer holds
The indicator works on any intraday timeframe, but ORB is fundamentally a day trading strategy. Daily charts don't make sense for ORB.
DEFAULT CONFIGURATION
ON by Default:
• All 4 ORB stages (5/15/30/60)
• Breakout Detection
• Retest Labels
• All TP levels (1/1.5/2/3)
• TP/SL Lines (Detailed mode)
• Dashboard (Bottom Left, Dark theme)
• Position Size Calculator
OFF by Default (Optional Filters):
• FVG Filter
• Pullback Filter
• Volume Filter
• Trend Filter
• HTF Bias Check
• Alerts
Recommended for Beginners:
• Leave all defaults
• Session Mode: Auto-Detect
• Signal Mode: Track Cycles
• Stop Method: ATR
• Add Volume Filter if trading stocks
Recommended for Advanced:
• Enable ORB15 + ORB30 only (disable 5 & 60)
• Enable: Volume + Trend + FVG
• Signal Mode: Track Cycles, Max 3
• Stop Method: ATR or Safer
• Enable HTF Daily bias check
## Settings Guide
The settings are organized into logical groups. Here's what each section controls:
### ORB COLORS Section
Show Edge Labels: Display "ORB 5", "ORB 15" labels at the right edge of the levels
Background: Fill the area between ORB high/low with color
Transparency: How see-through the background is (95% is nearly invisible)
Enable ORB 5/15/30/60: Turn each stage on or off individually
Colors: Assign colors to each ORB stage for easy identification
### SESSION SETTINGS Section
Session Mode: Choose trading session (Auto-Detect works for most instruments)
Custom Session Hours: Define your own hours if needed (format: HHMM-HHMM)
Auto-Detect uses the instrument's natural hours (stocks use exchange hours, crypto uses 24/7).
### BREAKOUT DETECTION Section
Enable Breakout Detection: Master switch for signals
Show Retest Labels: Display retest signals
Label Size: Visual size for all labels (Small recommended)
Enable FVG Filter: Require Fair Value Gap confirmation
Show FVG Boxes: Display the gap boxes on chart
Signal Mode: "First Only" = one signal per direction per day, "Track Cycles" = multiple signals
Max Cycles: How many breakout-retest cycles to track (6 is balanced)
Breakout Buffer: Extra distance required beyond ORB level (0.1-0.2% recommended)
Min Distance for Retest: How far price must move away before retest is valid (2% recommended)
Min Bars Outside ORB: Bars price must stay outside for committed breakout (2 is balanced)
### TARGETS & RISK Section
Enable Targets & Stop-Loss: Calculate and show trade management
TP1/TP2/TP3 checkboxes: Select which profit targets to display
Stop Method: How to calculate stop loss placement
- ATR: Based on volatility (best for most cases)
- ORB %: Fixed % of ORB range
- Swing: Recent swing high/low
- Safer: Widest of all methods
ATR Length & Multiplier: Controls ATR stop distance (14 period, 1.5x is standard)
ORB Stop %: Percentage beyond ORB for stop (20% is balanced)
Swing Bars: Lookback period for swing high/low (3 is recent)
### TP/SL LINES Section
Show TP/SL Lines: Display horizontal lines on chart
Label Format: "Short" = minimal text, "Detailed" = shows prices
Freeze Lines at EOD: Stop extending lines at session close
### DASHBOARD Section
Show Info Panel: Display the metrics dashboard
Theme: Dark or Light colors
Position: Where to place dashboard on chart
Toggle rows: Show/hide specific information rows
Calculate Position Size: Enable the position sizing calculator
Risk Mode: Risk fixed $ amount or % of account
Account Size: Your total trading capital
Risk %: Percentage to risk per trade (0.5-1% recommended)
### VOLUME FILTER Section
Enable Volume Filter: Require volume confirmation
MA Length: Average period (20 is standard)
Min Volume: Required multiplier (1.5x = 50% above average)
Strong Volume: Multiplier that bypasses other filters (2.5x)
### TREND FILTER Section
Enable Trend Filter: Require trend alignment
Trend Mode: Method to determine trend (VWAP is simple and effective)
Custom EMA Length: If using EMA mode (50 for swing, 20 for day trading)
SuperTrend settings: Period and Multiplier if using SuperTrend mode
### HIGHER TIMEFRAME Section
Check Daily Trend: Display higher timeframe bias in dashboard
Timeframe: What TF to check (D = daily, recommended)
Method: Price vs MA (stable) or Candle Direction (reactive)
MA Period: EMA length for Price vs MA method (20 is balanced)
Min Strength %: Minimum strength threshold for HTF bias to be considered
- For "Price vs MA": Minimum distance (%) from moving average
- For "Candle Direction": Minimum candle body size (%)
- 0.5% is balanced - increase for stricter filtering
- Lower values = more signals, higher values = only strong trends
### ALERTS Section
Enable Alerts: Master switch (must be ON to use any alerts)
Breakout Alerts: Notify on ORB breakouts
Retest Alerts: Notify when price retests after breakout
Failed Break Alerts: Notify on failed breakouts
Stage Complete Alerts: Notify when each ORB stage finishes forming
After enabling desired alert types, click "Create Alert" button, select this indicator, choose "Any alert() function call".
## Tips & Best Practices
### General Trading Tips
ORB works best on liquid instruments (stocks with good volume, major crypto pairs)
First hour of the session is most important - that's when ORB is forming
Breakouts WITH the trend have higher success rates - use the trend filter
Failed breakouts are common - use the "Min Bars Outside" setting to filter weak moves
Not every day produces good ORB setups - be patient and selective
### Position Sizing Best Practices
Never risk more than 1-2% of your account on a single trade
Use the built-in calculator - don't guess your position size
Update your account size monthly as it grows
Smaller accounts: use $ Amount mode for simplicity
Larger accounts: use % of Account mode for scaling
### Take Profit Strategy
Most traders use: 50% at TP1, 50% at TP2
Aggressive: Hold through TP1 for TP2 or TP3
Conservative: Full exit at TP1 (1:1 risk/reward)
After TP1 hits, consider moving stop to breakeven
TP3 rarely hits - only on strong trending days
### Filter Combinations
Maximum Quality: Volume + Trend + FVG (fewest signals, highest quality)
Balanced: Volume + Trend (good quality, reasonable frequency)
Active Trading: No filters or Volume only (many signals, lower quality)
Trending Markets: Trend filter essential (indices, crypto)
Range-Bound: Volume + FVG (avoid trend filter)
### Common Mistakes to Avoid
Chasing breakouts - wait for the bar to close, don't FOMO into wicks
Ignoring the stop loss - always use it, move it manually if needed
Over-leveraging - the calculator shows MAX shares, you can buy less
Trading every signal - quality > quantity, use filters
Not tracking results - keep a journal to see what works for YOU
## Pros and Cons
### Advantages
Complete all-in-one solution - from signal to position sizing
Multiple timeframes tracked simultaneously
Visual clarity - easy to see what's happening
Cycle tracking catches opportunities others miss
Built-in risk management eliminates guesswork
Customizable filters for different trading styles
No repainting - what you see is locked in
Works across multiple markets (stocks, forex, crypto)
### Limitations
Intraday strategy only - doesn't work on daily charts
Requires active monitoring during first 1-2 hours of session
Not suitable for after-hours or extended sessions by default
Can produce many signals in choppy markets (use filters)
Dashboard can be overwhelming for complete beginners
Performance depends on market conditions (trends vs ranges)
Requires understanding of risk management concepts
### Best For
Day traders who can watch the first 1-2 hours of market open
Traders who want systematic entry/exit rules
Those learning proper position sizing and risk management
Active traders comfortable with multiple signals per day
Anyone trading liquid instruments with clear sessions
### Not Ideal For
Swing traders holding multi-day positions
Set-and-forget / passive investors
Traders who can't watch market open
Complete beginners unfamiliar with trading concepts
Low volume / illiquid instruments
## Frequently Asked Questions
Q: Why are no signals appearing?
A: Check that you're on an intraday timeframe (5min, 15min, etc.) and that the current time is within your session hours. Also verify that "Enable Breakout Detection" is ON and at least one ORB stage is enabled. If using filters, they might be blocking signals - try disabling them temporarily.
Q: What's the best ORB stage to use?
A: ORB15 (15 minutes) is most popular and balanced. ORB5 gives faster signals but more noise. ORB30 and ORB60 are slower but more reliable. Many traders use ORB15 + ORB30 together.
Q: Should I enable all the filters?
A: Start with no filters to see all signals. If too many false signals, add Volume filter first (stocks) or Trend filter (trending markets). FVG filter is most restrictive - use for maximum quality but fewer signals.
Q: How do I know which stop loss method to use?
A: ATR works for most cases - it adapts to volatility. Use ORB% if you want predictable stop placement. Swing is for respecting chart structure. Safer gives you the most room but largest risk.
Q: Can I use this for swing trading?
A: Not really - ORB is fundamentally an intraday strategy. The ranges reset each day. For swing trading, look at weekly support/resistance or moving averages instead.
Q: Why do TP/SL lines disappear sometimes?
A: Lines freeze (stop extending) when: stop loss is hit, the last enabled take-profit is hit, or end of session arrives (if "Freeze at EOD" is enabled). This is intentional - the trade is complete.
Q: What's the difference between "First Only" and "Track Cycles"?
A: "First Only" shows one breakout UP and one DOWN per day maximum - clean but might miss opportunities. "Track Cycles" shows breakout-retest-rebreak sequences - more signals but busier chart.
Q: Is position sizing accurate for options/forex?
A: The calculator is designed for shares (stocks). For options, ignore the share count and use the risk amount. For forex, you'll need to adapt the lot size calculation manually.
Q: How much capital do I need to use this?
A: The indicator works for any account size, but practical day trading typically requires $25,000 in the US due to Pattern Day Trader rules. Adjust the "Account Size" setting to match your capital.
Q: Can I backtest this strategy?
A: This is an indicator, not a strategy script, so it doesn't have built-in backtesting. You can visually review historical signals or code a strategy script using similar logic.
Q: Why does the dashboard show different entry price than the breakout label?
A: If you're looking at an old breakout, the ORB levels may have changed when the next stage completed. The dashboard always shows the CURRENT active range and trade setup.
Q: What's a good win rate to expect?
A: ORB strategies typically see 40-60% win rate depending on market conditions and filters used. The strategy relies on positive risk/reward ratios (2:1 or better) to be profitable even with moderate win rates.
Q: Does this work on crypto?
A: Yes, but crypto trades 24/7 so you need to define what "session start" means. Use Session Mode = Custom and set your preferred daily reset time (e.g., 0000-2359 UTC).
## Credits & Transparency
### Development
This indicator was developed with the assistance of AI technology to implement complex ORB trading logic.
The strategy concept, feature specifications, and trading logic were designed by the publisher. The implementation leverages modern development tools to ensure:
Clean, efficient, and maintainable code
Comprehensive error handling and input validation
Detailed documentation and user guidance
Performance optimization
### Trading Concepts
This indicator implements several public domain trading concepts:
Opening Range Breakout (ORB): Trading strategy popularized by Toby Crabel, Mark Fisher and many more talanted traders.
Fair Value Gap (FVG): Price imbalance concept from ICT methodology
SuperTrend: ATR-based trend indicator using public formula
Risk/Reward Ratio: Standard risk management principle
All mathematical formulas and technical concepts used are in the public domain.
### Pine Script
Uses standard TradingView built-in functions:
ta.ema(), ta.atr(), ta.vwap(), ta.highest(), ta.lowest(), request.security()
No external libraries or proprietary code from other authors.
## Disclaimer
This indicator is provided for educational and informational purposes only. It is not financial advice.
Trading involves substantial risk of loss and is not suitable for every investor. Past performance shown in examples is not indicative of future results.
The indicator provides signals and calculations, but trading decisions are solely your responsibility. Always:
Test strategies on paper before using real money
Never risk more than you can afford to lose
Understand that all trading involves risk
Consider seeking advice from a licensed financial advisor
The publisher makes no guarantees regarding accuracy, profitability, or performance. Use at your own risk.
---
Version: 3.0
Pine Script Version: v6
Last Updated: October 2024
For support, questions, or suggestions, please comment below or send a private message.
---
Happy trading, and remember: consistent risk management beats perfect entry timing every time.
