Supertrend [TradingConToto]Supertrend — ADX/DI + EMA Gap + Breakout (with Mobile UI)
What makes it original
Supertrend combines trend strength (ADX/DI), multi-timeframe bias (EMA63 and EMA 200D equivalent), a structural filter based on the distance between EMA2400 and EMA4800 expressed in ATR units, and a momentum confirmation through a previous high breakout.
This is not a random mashup — it’s a sequence of filters designed to reduce trades in ranging markets and prioritize mature trends:
Direction: +DI > -DI (trend led by buyers).
Strength: ADX > mean(ADX) (avoids weak, choppy phases).
Short-term bias: Close > EMA63.
Long-term bias: Close > EMA4800 ≈ EMA200 daily on H1.
Momentum: Close > High (immediate breakout).
Structure: (EMA2400 − EMA4800) > k·ATR (ensures separation in ATR units, filters out flat phases).
Entries & exits
Entry: when all six conditions are met and no open position exists.
Exit: if +DI < -DI or Close < EMA63.
Visuals: EMA63 is painted green while in position and red otherwise, with a supertrend-style band; “BUY” labels appear below the green band and “SELL” labels above the red band.
UI: includes a compact table (mobile-friendly) showing the state of each condition.
Default parameters used in this publication
Initial capital: 10,000
Position size: 10% of equity (≤10% per trade is considered sustainable).
Commission: 0.01% per side (adjust to your broker/market).
Slippage: 1 tick
Pyramiding: 0 (only one position at a time)
Adjust commission/slippage to match your market. For US equities, commissions are often per share; for spot crypto, 0.10–0.20% total is common. I publish with 0.01% per side as a conservative example to avoid overestimating results.
Recommended backtest dataset
Timeframe: H1
Multi-cycle window (e.g. 2015–today)
Symbols with high liquidity (e.g. NASDAQ-100 large caps, or BTC/ETH spot) to generate 100+ trades. Avoid cherry-picked short windows.
Why each filter matters
+DI > -DI + ADX > mean: reduce counter-trend trades and weak signals.
Close > EMA63 + Close > EMA4800: enforce trend alignment in short and long horizons.
Breakout High : requires immediate momentum, avoids early entries.
EMA gap in ATR units: blocks flat or compressed structures where EMA200D aligns with price.
Limitations
The breakout filter may skip healthy pullbacks; the design prioritizes continuation over perfect entry price.
No fixed trailing stop/TP; exits depend on trend degradation via DI/EMA63.
Results vary with real costs (commissions, slippage, funding). Adjust defaults to your broker.
How to use
Apply it on a clean chart (no other indicators when publishing).
Keep in mind the default parameters above; if you change them, mention it in your notes and use the same values in the Strategy Tester.
Ensure your dataset produces 100+ trades for statistical validity.
ابحث في النصوص البرمجية عن "adx"

Chart-Only Scanner — Pro Table v2.5.1Chart-Only Scanner — Pro Table v2.5
User Manual (Pine Script v6)
What this tool does (in one line)
A compact, on-chart table that scores the current chart symbol (or an optional override) using momentum, volume, trend, volatility, and pattern checks—so you can quickly decide UP, DOWN, or WAIT.
Quick Start (90 seconds)
Add the indicator to any chart and timeframe (1m…1M).
Leave “Override chart symbol” = OFF to auto-use the chart’s symbol.
Choose your layout:
Row (wide horizontal strip), or Grid (title + labeled cells).
Pick a size preset (Micro, Small, Medium, Large, Mobile).
Optional: turn on “Use Higher TF (EMA 20/50)” and set HTF Multiplier (e.g., 4 ⇒ if chart is 15m, HTF is 60m).
Watch the table:
DIR (↑/↓/→), ROC%, MOM, VOL, EMA stack, HTF, REV, SCORE, ACT.
Add an alert if you want: the script fires when |SCORE| ≥ Action threshold.
What to expect
A small table appears on the chart corner you choose, updating each bar (or only at bar close if you keep default smart-update).
The ACT cell shows 🔥 (strong), 👀 (medium), or ⏳ (weak).
Panels & Settings (every option explained)
Core
Momentum Period: Lookback for rate-of-change (ROC%). Shorter = more reactive; longer = smoother.
ROC% Threshold: Minimum absolute ROC% to call direction UP (↑) or DOWN (↓); otherwise →.
Require Volume Confirmation: If ON and VOL ≤ 1.0, the SCORE is forced to 0 (prevents low-volume false positives).
Override chart symbol + Custom symbol: By default, the indicator uses the chart’s symbol. Turn this ON to lock to a specific ticker (e.g., a perpetual).
Higher TF
Use Higher TF (EMA 20/50): Compares EMA20 vs EMA50 on a higher timeframe.
HTF Multiplier: Higher TF = (chart TF × multiplier).
Example: on 3H chart with multiplier 2 ⇒ HTF = 6H.
Volatility & Oscillators
ATR Length: Used to show ATR% (ATR relative to price).
RSI Length: Standard RSI; colors: green ≤30 (oversold), red ≥70 (overbought).
Stoch %K Length: With %D = SMA(%K, 3).
MACD Fast/Slow/Signal: Standard MACD values; we display Line, Signal, Histogram (L/S/H).
ADX Length (Wilder): Wilder’s smoothing (internal derivation); also shows +DI / −DI if you enable the ADX column.
EMAs / Trend
EMA Fast/Mid/Slow: We compute EMA(20/50/200) by default (editable).
EMA Stack: Bull if Fast > Mid > Slow; Bear if Fast < Mid < Slow; Flat otherwise.
Benchmark (optional, OFF by default)
Show Relative Strength vs Benchmark: Displays RS% = ROC(symbol) − ROC(benchmark) over the Momentum Period.
Benchmark Symbol: Ticker used for comparison (e.g., BTCUSDT as a market proxy).
Columns (show/hide)
Toggle which fields appear in the table. Hiding unused fields keeps the layout clean (especially on mobile).
Display
Layout Mode:
Row = a single two-row strip; each column is a metric.
Grid = a title row plus labeled pairs (label/value) arranged in rows.
Size Preset: Micro, Small, Medium, Large, Mobile change text size and the grid density.
Table Corner: Where the panel sits (e.g., Top Right).
Opaque Table Background: ON = dark card; OFF = transparent(ish).
Update Every Bar: ON = update intra-bar; OFF = smart update (last bar / real-time / confirmed history).
Action threshold (|score|): The cutoff for 🔥 and alert firing (default 70).
How to read each field
CHART: The active symbol name (or your custom override).
DIR: ↑ (ROC% > threshold), ↓ (ROC% < −threshold), → otherwise.
ROC%: Rate of change over Momentum Period.
Formula: (Close − Close ) / Close × 100.
MOM: A scaled momentum score: min(100, |ROC%| × 10).
VOL: Volume ratio vs 20-bar SMA: Volume / SMA(Volume,20).
1.5 highlights as yellow (significant participation).
ATR%: (ATR / Close) × 100 (volatility relative to price).
RSI: Colored for extremes: ≤30 green, ≥70 red.
Stoch K/D: %K and %D numbers.
MACD L/S/H: Line, Signal, Histogram. Histogram color reflects sign (green > 0, red < 0).
ADX, +DI, −DI: Trend strength and directional components (Wilder). ADX ≥ 25 is highlighted.
EMA 20/50/200: Current EMA values (editable lengths).
STACK: Bull/Bear/Flat as defined above.
VWAP%: (Close − VWAP) / Close × 100 (premium/discount to VWAP).
HTF: ▲ if HTF EMA20 > EMA50; ▼ if <; · if flat/off.
RS%: Symbol’s ROC% − Benchmark ROC% (positive = outperforming).
REV (reversal):
🟢 Eng/Pin = bullish engulfing or bullish pin detected,
🔴 Eng/Pin = bearish engulfing or bearish pin,
· = none.
SCORE (absolute shown as a number; sign shown via DIR and ACT):
Components:
base = MOM × 0.4
volBonus = VOL > 1.5 ? 20 : VOL × 13.33
htfBonus = use_mtf ? (HTF == DIR ? 30 : HTF == 0 ? 15 : 0) : 0
trendBonus = (STACK == DIR) ? 10 : 0
macdBonus = 0 (placeholder for future versions)
scoreRaw = base + volBonus + htfBonus + trendBonus + macdBonus
SCORE = DIR ≥ 0 ? scoreRaw : −scoreRaw
If Require Volume Confirmation and VOL ≤ 1.0 ⇒ SCORE = 0.
ACT:
🔥 if |SCORE| ≥ threshold
👀 if 50 < |SCORE| < threshold
⏳ otherwise
Practical examples
Strong long (trend + participation)
DIR = ↑, ROC% = +3.2, MOM ≈ 32, VOL = 1.9, STACK = Bull, HTF = ▲, REV = 🟢
SCORE: base(12.8) + volBonus(20) + htfBonus(30) + trend(10) ≈ 73 → ACT = 🔥
Action idea: look for longs on pullbacks; confirm risk with ATR%.
Weak long (no volume)
DIR = ↑, ROC% = +1.0, but VOL = 0.8 and Require Volume Confirmation = ON
SCORE forced to 0 → ACT = ⏳
Action: wait for volume > 1.0 or turn off confirmation knowingly.
Bearish reversal warning
DIR = →, REV = 🔴 (bearish engulfing), RSI = 68, HTF = ▼
SCORE may be mid-range; ACT = 👀
Action: watch for breakdown and rising VOL.
Alerts (how to use)
The script calls alert() whenever |SCORE| ≥ Action threshold.
To receive pop-ups, sounds, or emails: click “⏰ Alerts” in TradingView, choose this indicator, and pick “Any alert() function call.”
The alert message includes: symbol, |SCORE|, DIR.
Layout, Size, and Corner tips
Row is best when you want a compact status ribbon across the top.
Grid is clearer on big screens or when you enable many columns.
Size:
Mobile = one pair per row (tall, readable)
Micro/Small = dense; good for many fields
Large = presentation/screenshots
Corner: If the table overlaps price, change the corner or set Opaque Background = OFF.
Repaint & timeframe behavior
Default smart update prefers stability (last bar / live / confirmed history).
For a stricter, “close-only” behavior (less repaint): turn Update Every Bar = OFF and avoid Heikin Ashi when you want raw market OHLC (HA modifies price inputs).
HTF logic is derived from a clean, integer multiple of your chart timeframe (via multiplier). It works with 3H/4H and any TF.
Performance notes
The script analyzes one symbol (chart or override) with multiple metrics using efficient tuple requests.
If you later want a multi-symbol grid, do it with pages (10–15 per page + rotate) to stay within platform limits (recommended future add-on).
Troubleshooting
No table visible
Ensure the indicator is added and not hidden.
Try toggling Opaque Background or switch Corner (it might be behind other drawings).
Keep Columns count reasonable for the chosen Size.
If you turned ON Override, verify the Custom symbol exists on your data provider.
Numbers look different on HA candles
Heikin Ashi modifies OHLC; switch to regular candles if you need raw price metrics.
3H/4H issues
Use integer HTF Multiplier (e.g., 2, 4). The tool builds the correct string internally; no manual timeframe strings needed.
Power user tips
Volume gating: keeping Require Volume Confirmation = ON filters most fake moves; if you’re a scalper, reduce strictness or turn it off.
Action threshold: 60–80 is typical. Higher = fewer but stronger signals.
Benchmark RS%: great for spotting leaders/laggards; positive RS% = outperformance vs benchmark.
Change policy & safety
This version doesn’t alter your historical logic you tested (no radical changes).
Any future “radical” change (score weights, HTF logic, UI hiding data) will ship with a toggle and an Impact Statement so you can keep old behavior if you prefer.
Glossary (quick)
ROC%: Percent change over N bars.
MOM: Scaled momentum (0–100).
VOL ratio: Volume vs 20-bar average.
ATR%: ATR as % of price.
ADX/DI: Trend strength / direction components (Wilder).
EMA stack: Relationship between EMAs (bullish/bearish/flat).
VWAP%: Premium/discount to VWAP.
RS%: Relative strength vs benchmark.

U Table • LITEA compact, educational version of my workflow that combines trend, momentum, trend strength, and a clean trigger:
Trend: EMA Fast vs EMA Slow (auto-lengths by chart TF)
Momentum: RSI > 50 for longs / < 50 for shorts
Strength: ADX above a user-set threshold (fallback implementation; can be replaced by ta.adx() when available)
Trigger: price crosses the Bollinger basis (center line)
Signals
LONG: crossover(close, BB basis) while EMA Fast > EMA Slow, RSI > 50, ADX > threshold
SHORT: crossunder(close, BB basis) while EMA Fast < EMA Slow, RSI < 50, ADX > threshold
Visuals
EMA Fast / EMA Slow / BB basis
Markers “L” / “S” on triggers
Latest confirmed pivot high/low (broken line style)
Small diagnostics table (ADX, EMA relation, RSI, last pivots) on the last bar
Inputs
Pivot length: pivot confirmation window (default 5)
ADX threshold: minimum trend strength to allow signals (default 20)
Notes
Signals are intended to be evaluated on bar close. Intrabar values may change until the bar closes.
Pivot lines appear after confirmation; they do not repaint once confirmed.
No external data or security() calls are used.
This LITE build focuses on clarity and speed (few calculations, overlay-friendly). It can be used as a stand-alone study or as a scaffold for your own research and risk management.

Ayman – Full Smart Suite Auto/Manual Presets + PanelIndicator Name
Ayman – Full Smart Suite (OB/BoS/Liq/FVG/Pin/ADX/HTF) + Auto/Manual Presets + Panel
This is a multi-condition trading tool for TradingView that combines advanced Smart Money Concepts (SMC) with classic technical filters.
It generates BUY/SELL signals, draws Stop Loss (SL) and Take Profit (TP1, TP2) levels, and displays a control panel with all active settings and conditions.
1. Main Features
Smart Money Concepts Filters:
Order Block (OB) Zones
Break of Structure (BoS)
Liquidity Sweeps
Fair Value Gaps (FVG)
Pin Bar patterns
ADX filter
Higher Timeframe EMA filter (HTF EMA)
Two Operating Modes:
Auto Presets: Automatically adjusts all settings (buffers, ATR multipliers, RR, etc.) based on your chart timeframe (M1/M5/M15).
Manual Mode: Fully customize all parameters yourself.
Trade Management Levels:
Stop Loss (SL)
TP1 – partial profit
TP2 – full profit
Visual Panel showing:
Current settings
Filter status
Trend direction
Last swing levels
SL/TP status
Alerts for BUY/SELL conditions
2. Entry Conditions
A BUY signal is generated when all these are true:
Trend: Price above EMA (bullish)
HTF EMA: Higher timeframe trend also bullish
ADX: Trend strength above threshold
OB: Price in a valid bullish Order Block zone
BoS: Structure break to the upside
Liquidity Sweep: Sweep of recent lows in bullish context
FVG: A bullish Fair Value Gap is present
Pin Bar: Bullish Pin Bar pattern detected (if enabled)
A SELL signal is generated when the opposite conditions are met.
3. Stop Loss & Take Profits
SL: Placed just beyond the last swing low (BUY) or swing high (SELL), with a small ATR buffer.
TP1: Partial profit target, defined as a ratio of the SL distance.
TP2: Full profit target, based on Reward:Risk ratio.
4. How to Use
Step 1 – Apply Indicator
Open TradingView
Go to your chart (recommended: XAUUSD, M1/M5 for scalping)
Add the indicator script
Step 2 – Choose Mode
AUTO Mode: Leave “Use Auto Presets” ON – parameters adapt to your timeframe.
MANUAL Mode: Turn Auto OFF and adjust all lengths, buffers, RR, and filters.
Step 3 – Filters
In the Filters On/Off section, enable/disable specific conditions (OB, BoS, Liq, FVG, Pin Bar, ADX, HTF EMA).
Step 4 – Trading the Signals
Wait for a BUY or SELL arrow to appear.
SL and TP levels will be plotted automatically.
TP1 can be used for partial close and TP2 for full exit.
Step 5 – Alerts
Set alerts via BUY Signal or SELL Signal to receive notifications.
5. Best Practices
Scalping: Use M1 or M5 with AUTO mode for gold or forex pairs.
Swing Trading: Use M15+ and adjust buffers/ATR manually.
Combine with price action confirmation before entering trades.
For higher accuracy, wait for multiple filter confirmations rather than acting on the first arrow.
6. Summary Table
Feature Purpose Can Disable?
Order Block Finds key supply/demand zones ✅
Break of Structure Detects trend continuation ✅
Liquidity Sweep Finds stop-hunt moves ✅
Fair Value Gap Confirms imbalance entries ✅
Pin Bar Price action reversal filter ✅
ADX Trend strength filter ✅
HTF EMA Higher timeframe confirmation ✅

Clarix Trend Filter Purpose
This indicator helps traders quickly identify strong bullish or bearish market conditions by combining a moving average and directional strength.
How It Works
SMMA (200): Smooths price to detect overall trend direction.
ADX (14): Measures trend strength, filtering out weak/noisy moves.
+DI / -DI: Directional movement indicators help confirm the dominant side.
Trend Logic
Bullish Trend: Price is above SMMA, ADX > threshold, and +DI > -DI
Bearish Trend: Price is below SMMA, ADX > threshold, and -DI > +DI
Otherwise, the trend is considered weak or unclear.
Features
Background shading for trend clarity
Optional buy/sell arrows based on trend confirmation
Configurable SMMA length and ADX threshold
Designed for 1-minute timeframes, but can be adjusted
Tips
Best used as a trend filter with your existing entry/exit strategy
Avoid trading signals when ADX is low (flat or ranging conditions)
Works well when combined with volume or momentum indicators

Adiyogi Trend🟢🔴 “Adiyogi” Trend — Market Alignment Visualizer
“Adiyogi” Trend is a powerful, non-intrusive trend detection system built for traders who seek clarity, discipline, and alignment with true market flow. Inspired by the meditative stillness of Adiyogi and the need for mindful, high-probability decisions, this tool offers a clean and intuitive visual guide to trending environments — without cluttering the chart or pushing forced trades.
This is not a buy/sell signal generator. Instead, it is designed as a background confirmation engine that helps you stay on the right side of the market by identifying moments of true directional strength.
🧠 Core Logic
The “Adiyogi” Trend indicator highlights the background of your chart in green or red when multiple layers of strength and structure align — including momentum, market positioning, and relative force. Only when these internal components agree does the system activate a directional state.
It’s built on three foundational energies of trend confirmation:
Strength of movement
Structure in price action
Conviction in momentum
By combining these into one visual background, the indicator filters out indecision and helps you stay focused during real trend phases — whether you're day trading, swing trading, or holding longer-term positions.
📌 Core Concepts Behind the Tool
The indicator integrates three essential market filters—each confirming a different dimension of trend strength:
ADX (Average Directional Index) – Measures trend momentum.
You’ve chosen a very responsive setting (ADX Length = 2), which helps catch the earliest possible signs of momentum emergence.
The threshold is ADX ≥ 22, ensuring that weak or sideways markets are filtered out.
SuperTrend (10,1) – Captures short-term trend direction.
This setup follows price closely and reacts quickly to reversals, making it ideal for fast-moving assets or intraday strategies.
SuperTrend acts as the structural confirmation of directional bias.
RSI (Relative Strength Index) – Measures strength based on recent price closes.
You’ve configured RSI > 50 for bullish zones and < 50 for bearish—a neutral midpoint standard often used by professional traders.
This ensures that only trades in sync with momentum and recent strength are highlighted.
🌈 How It Visually Works
Background turns GREEN when:
ADX ≥ 22, indicating strong momentum
Price is above the 20 EMA and above SuperTrend (10,1)
RSI > 50, confirming recent strength
Background turns RED when:
ADX ≥ 22, indicating strong momentum
Price is below the 20 EMA and below SuperTrend (10,1)
RSI < 50, confirming recent weakness
The background remains neutral (transparent) when trend conditions are not clearly aligned—this is the tool's way of keeping you out of indecisive markets.
A label (BULL / BEAR) appears only when the bias flips from the previous one. This helps avoid repeated or redundant alerts, focusing your attention only when something changes.
📊 Practical Uses & Benefits
✅ Stay with the trend: Perfectly filters out choppy or sideways markets by only activating when conditions align across momentum, structure, and strength.
✅ Pre-trade confirmation: Use this tool to confirm trade setups from other indicators or price action patterns.
✅ Avoid noise: Prevent overtrading by focusing only on high-quality trend conditions.
✅ Visual clarity: Unlike arrows or plots that clutter the chart, this tool subtly highlights trend conditions in the background, preserving your price action view.
📍 Important Notes
This is not a buy/sell signal generator. It is a trend-confirmation system.
Use it in conjunction with your existing entry setups—such as breakouts, order blocks, retests, or candlestick patterns.
The tool helps you stay in sync with the dominant direction, especially when combining multiple timeframes.
Can be used on any market (stocks, forex, crypto, indices) and on any timeframe.

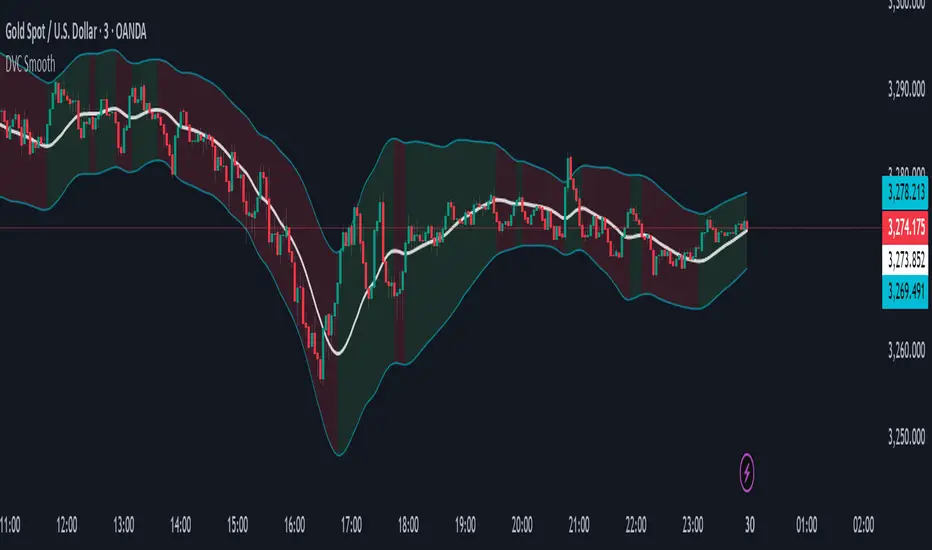
Dynamic Volatility Channel (DVC) - Smooth
The indicator's adaptability comes from a unique blend of well-known concepts:
The Adaptive Engine (ADX): The indicator uses the Average Directional Index (ADX) in the background to analyze the strength of the trend. This acts as the "brain", telling the channel whether the market is trending strongly or moving sideways.
Hybrid Volatility: This is the core of the indicator. The width of the channel is determined by a weighted mix of two volatility measures:
In trending markets (high ADX), the channel gives more weight to the Average True Range (ATR).
In ranging markets (low ADX), the channel gives more weight to Standard Deviation.
Smooth Centerline (HMA): The channel is centered around a Hull Moving Average (HMA), which is known for its smoothness and reduced lag compared to other moving averages.
Advanced Smoothing Layers: This version includes dedicated smoothing for both the volatility components (ATR and StDev) and the logic that switches between regimes. This ensures the channel expands, contracts, and adapts in a very fluid manner, eliminating sudden jumps and reducing market noise.
Mean Reversion: In ranging markets (indicated by a flatter channel), the outer bands can act as dynamic support and resistance levels. Look for opportunities to sell near the upper band and buy near the lower band, always waiting for price action confirmation like reversal candles.
Trend Following: In strong trends (indicated by a steeply sloped channel), the centerline (HMA) often serves as a dynamic level of support (in an uptrend) or resistance (in a downtrend). Pullbacks to the centerline can present opportunities to join the trend. A "band ride," where price action consistently pushes against the upper or lower band, signals a very strong trend.
Volatility Analysis: A "squeeze," where the bands come very close together, indicates low volatility and can foreshadow a significant price breakout. A sudden expansion of the bands signals an increase in volatility and the potential start of a new, powerful move.
All core parameters are fully customizable to suit your trading style and preferred assets:
You can adjust the lengths for the HMA, ATR, StDev, and the ADX filter.
You can change the multipliers for the ATR and Standard Deviation components.
Crucially, you can control the Volatility Smoothing Length and Logic Smoothing Length to find the perfect balance between responsiveness and smoothness.
Disclaimer: This indicator is provided for educational and analytical purposes only. It is not financial advice, and past performance is not indicative of future results. Always conduct your own research and backtesting before risking capital in a live market.
Algoway V4.2📌 Algoway V4.2 — Multi-layered Strategy Powered by ADX, MACD & PSO
Overview
Algoway V4.2 is a layered algorithmic strategy designed for volatility-rich assets like cryptocurrencies. While some core components (such as PSO, MACD, and ADX oscillators) are adapted from known indicator models, the original logic, state tracking, and Candle Strength Oscillator (CSO) are fully custom-developed.
This strategy is not a simple combination of tools — it implements a conditional entry-exit logic system based on ADX zone transitions, momentum structure, and MACD/PSO signal synchronization, enhanced by custom-built CSO filtering.
🧠 Key Modules and How They Work Together
PSO (Premium Stochastic Oscillator)
Used to confirm local oversold/overbought pressure. Acts as a directional filter.
MACD (Normalized)
Volatility-normalized MACD values allow consistent signal detection even on volatile pairs. It triggers entries when momentum begins shifting.
ADX Zonal Logic
Divides the market into Range / MidRange / Trend Peak zones. Entries are allowed only under specific transitions — e.g., long entries only in yellow (low volatility) zones or in trend climax zones under certain pullbacks.
CSO (Candle Strength Oscillator) — Custom Module
Designed to measure real candle momentum and price structure consistency. It avoids false breakouts and filters trend fatigue.
🔁 How Logic Works
Strategy maintains state variables to track entry type and zone.
Exit conditions depend on the entry origin: entries from "Range" exit in "Peak", while "Peak" entries exit during pullbacks or mid-strength trend reversals.
Additional logic prevents entries when signals are not aligned across modules, minimizing noise.
Optional CSO module acts as a final microstructure confirmation before executing MACD-based midpoint entries.
📊 Example Parameters (for 5M crypto scalping)
Each module is tuned to respond to 5-minute crypto volatility:
Stochastic: fast response, tight thresholds
MACD: shortened EMAs, normalized
ADX: traditional smoothing, custom thresholds for zone switching
CSO: candle-based dynamic filter with visual zone mapping
🧪 Conclusion
Algoway V4.2 is not a script merger — it is a custom logic engine using familiar technical components but governed by a proprietary decision model, with additional filters and dynamic variable tracking.
It’s suitable for scalping or swing setups, and the internal logic is optimized for real trading conditions, not just visual backtests.

Trailing Stop Loss [TradingFinder] 4 Machine Learning Methods🔵 Introduction
The trailing stop indicator dynamically adjusts stop-loss (SL) levels to lock in profits as price moves favorably. It uses pivot levels and ATR to set optimal SL points, balancing risk and reward.
Trade confirmation filters, a key feature, ensure entries align with market conditions, reducing false signals. In 2023 a study showed filtered entries improve win rates by 15% in forex. This enhances trade precision.
SL settings, ranging from very tight to very wide, adapt to volatility via ATR calculations. These settings anchor SL to previous pivot levels, ensuring alignment with market structure. This caters to diverse trading styles, from scalping to swing trading.
The indicator colors the profit zone between the entry point (EP) and SL, using light green for buy trades and light red for sell trades. This visual cue highlights profit potential. It’s ideal for traders seeking dynamic risk management.
A table displays real-time trade details, including EP, SL, and profit/loss (PNL). Backtests show trailing stops cut losses by 20% in trending markets. This transparency aids decision-making.
🔵 How to Use
🟣 SL Levels
The trailing stop indicator sets SL based on pivot levels and ATR, offering four options: very tight, tight, wide, or very wide. Very tight SLs suit scalpers, while wide SLs fit swing traders. Select the base level to match your strategy.
If price hits the SL, the trade closes, and the indicator evaluates the next trade using the selected filter. This ensures disciplined trade management. The cycle restarts with a new confirmed entry.
Very tight SLs, set near recent pivots, trigger exits early to minimize risk but limit profits in volatile markets. Wide SLs, shown as farther lines, allow more price movement but increase exposure to losses. Adjust based on ATR and conditions, noting SL breaches open new positions.
🟣 Visualization
The indicator’s visual cues, like colored profit zones, simplify monitoring, with light green showing the profit area from EP to trailed SL. Dashed lines mark entry points, while solid lines track the trailed SL, triggering new positions when breached.
When price moves into profit, the area between EP and SL is colored—light green for longs, light red for shorts. This highlights the profit zone visually. The SL trails price, locking in gains as the trade progresses.
🟣 Filters
Upon trade entry, the indicator requires confirmation via filters like SMA 2x or ADX to validate momentum. Filters reduce false entries, though no guarantee exists for improved outcomes. Monitor price action post-entry for trade validity.
Filters like Momentum or ADX assess trend strength before entry. For example, ADX above 25 confirms strong trends. Choose “none” for unfiltered entries.
🟣 Bullish Alert
For a bullish trade, the indicator opens a long position with a green SL Line (after optional filters), trailing the SL below price. Set alerts to On in the settings for notifications, or Off to monitor manually.
🟣 Bearish Alert
In a bearish trade, the indicator opens a short position with a red SL Line post-confirmation, trailing the SL above price. With alerts On in the settings, it notifies the potential reversal.
🟣 Panel
A table displays all trades’ details, including Win Rates, PNL, and trade status. This real-time data aids in tracking performance. Check the table to assess trade outcomes instantly.
Review the table regularly to evaluate trade performance and adjust settings. Consistent monitoring ensures alignment with market dynamics. This maximizes the indicator’s effectiveness.
🔵 Settings
Length (Default: 10) : Sets the pivot period for calculating SL levels, balancing sensitivity and reliability.
Base Level : Options (“Very tight,” “Tight,” “Wide,” “Very wide”) adjust SL distance via ATR.
Show EP Checkbox : Toggles visibility of the entry point on the chart.
Show PNL : Displays profit/loss data for active and closed trades.
Filter : Options (“none,” “SMA 2x,” “Momentum,” “ADX”) validate trade entries.
🔵 Conclusion
The trailing stop indicator, a dynamic risk management tool, adjusts SLs using pivot levels and ATR. Its confirmation filters reduce false entries, boosting precision. Backtests show 20% loss reduction in trending markets.
Customizable SL settings and visual profit zones enhance usability across trading styles. The real-time table provides clear trade insights, streamlining analysis. It’s ideal for forex, stocks, or crypto.
While filters like ADX improve entry accuracy, no setup guarantees success in all conditions. Contextual analysis, like trend strength, is key. This indicator empowers disciplined, data-driven trading.

ABC Market stage judgmentABC Stage Judgment Indicators · Introduction
Core ideology
The market situation is divided into three stages:
Zone B (Low Volatility Accumulation): Extremely low volatility, no trend, institutions accumulate chips.
Zone A (oscillation zone): The volatility has rebounded but there is no unilateral trend, suitable for short-term high selling and low buying.
Zone C (Trend Explosion): The volatility has significantly expanded and the trend is strong, making it profitable to follow the position.
Core Indicators
Volatility measurement
Bollinger Bands Width (BBWidth): 20 cycle moving average ± 2 σ bandwidth, reflecting relative volatility compression/release;
ATR (Average True Volatility): measures the absolute intensity of price volatility.
Trend Strength
ADX (Average Trend Index): measures the strength of a trend (without distinguishing direction),
ADX<20 → No trend (Zone B/A)
ADX>25 → Significant trend (Zone C)
Stage division logic
Zone B: Both BWidth and ATR are less than the set multiple of their respective historical means, and ADX is less than the threshold → "quiet bottoming out";
Zone C: ADX>threshold, and BBWidth or ATR>set multiple of their respective historical means, trading volume amplification → "trend takeoff";
Zone A: Time periods that do not belong to B/C are all classified as oscillation zones.
Optional enhanced filtering
Direction confirmation (+DI/- DI): avoid going against the trend;
Multi cycle verification (4H): in line with the trend of large-scale;
Momentum filtering (ROC/MACD/RSI): ensuring kinetic energy support;
ATR slope: Confirm the release of fluctuations;
Breakthrough Confirmation: Enter only after the breakthrough is confirmed at the closing level.
These filters are turned off by default and can be selected with one click for different scenarios such as "high-level oscillation", "low-level bottoming", "planting trees in the middle", etc.
usage
Multi cycle switching: Built in "5-minute/1-hour" two main cycles for free switching;
Visualization: The background color and labels display the current Zone at a glance;
Alarm: Stage switching automatically triggers an Alert, which can be pushed through mobile phones/Telegram.

KTUtilsLibrary "KTUtils"
Utility functions for technical analysis indicators, trend detection, and volatility confirmation.
MGz(close, length)
MGz
@description Moving average smoother used for signal processing
Parameters:
close (float) : float Price input (typically close)
length (int) : int Length of smoothing period
Returns: float Smoothed value
atrConf(length)
atrConf
@description Calculates Average True Range (ATR) for volatility confirmation
Parameters:
length (simple int) : int Length for ATR calculation
Returns: float ATR value
f(input)
f
@description Simple Moving Average with fixed length
Parameters:
input (float) : float Input value
Returns: float Smoothed average
bcwSMA(s, l, m)
bcwSMA
@description Custom smoothing function with weight multiplier
Parameters:
s (float) : float Signal value
l (int) : int Length of smoothing
m (int) : int Weighting multiplier
Returns: float Smoothed output
MGxx(close, length)
MGxx
@description Custom Weighted Moving Average (WMA) variant
Parameters:
close (float) : float Price input
length (int) : int Period length
Returns: float MGxx smoothed output
_PerChange(lengthTime)
_PerChange
@description Measures percentage price change over a period and range deviation
Parameters:
lengthTime (int) : int Period for change measurement
Returns: tuple Measured change, high deviation, low deviation
dirmov(len)
dirmov
@description Calculates directional movement components
Parameters:
len (simple int) : int Lookback period
Returns: tuple Plus and Minus DI values
adx(dilen, adxlen)
adx
@description Calculates Average Directional Index (ADX)
Parameters:
dilen (simple int) : int Length for DI calculation
adxlen (simple int) : int Length for ADX smoothing
Returns: float ADX value
trChopAnalysis()
trChopAnalysis
@description Identifies chop and trend phases based on True Range Bollinger Bands
Returns: tuple TR SMA, chop state, trending state
wtiAnalysis(haclose, close, filterValue)
wtiAnalysis
@description Wave Trend Indicator (WTI) with signal crossover logic
Parameters:
haclose (float) : float Heikin-Ashi close
close (float) : float Standard close
filterValue (simple int) : int Smoothing length
Returns: tuple WTI lines and direction states
basicTrend(hahigh, halow, close, open, filterValue)
basicTrend
@description Determines trend direction based on HA high/low and close
Parameters:
hahigh (float) : float Heikin-Ashi high
halow (float) : float Heikin-Ashi low
close (float) : float Standard close
open (float) : float Standard open
filterValue (simple int) : int Smoothing period
Returns: tuple Uptrend, downtrend flags
metrics(close, filterValue)
metrics
@description Common market metrics
Parameters:
close (float) : float Price input
filterValue (int) : int RSI smoothing length
Returns: tuple VWMA, SMA10, RSI, smoothed RSI
piff(close, trend_change)
piff
@description Price-Informed Forward Forecasting (PIFF) model for trend strength
Parameters:
close (float) : float Price input
trend_change (float) : float Change in trend
Returns: tuple Percent change, flags for trend direction
getMACD()
getMACD
@description Returns MACD, signal line, and histogram
Returns: tuple MACD line, Signal line, Histogram
getStoch()
getStoch
@description Returns K and D lines of Stochastic Oscillator
Returns: tuple K and D lines
getKDJ()
getKDJ
@description KDJ momentum oscillator
Returns: tuple K, D, J, Average
getBBRatio()
getBBRatio
@description Bollinger Band Ratio (BBR) and signal flags
Returns: tuple Basis, Upper, Lower, BBR, BBR Up, BBR Down
getSupertrend()
getSupertrend
@description Supertrend values and direction flags
Returns: tuple Supertrend, Direction, Up, Down

Sideways + Buy + Sell DetectionSure! Here's the plain-language description of your script without using any code.
---
### 📘 **Script Purpose**
This script is designed to detect three different types of market conditions:
1. **Sideways (range-bound) market** — useful for non-directional strategies like strangles or straddles.
2. **Bullish trend** — provides a signal to consider buying.
3. **Bearish trend** — provides a signal to consider selling.
---
### 🔧 **Indicators Used**
* **RSI (Relative Strength Index)**: Measures market momentum. It's used to determine whether the market is in a bullish, bearish, or neutral zone.
* **ADX (Average Directional Index)** along with **DI+ and DI-**: Measures the strength and direction of a trend.
* **MACD (Moving Average Convergence Divergence)**: Confirms momentum and trend direction based on moving averages.
---
### 🟪 **Sideways Market Signal**
A sideways (non-trending) signal is shown when:
* RSI indicates the market is neither overbought nor oversold (in the middle range).
* ADX shows weak trend strength.
* The ADX value is lower than both DI+ and DI-, suggesting indecision or lack of clear trend.
A purple label appears below the bar when this condition is met.
---
### 🟩 **Buy Signal**
A buy signal is generated when:
* RSI shows strong upward momentum.
* ADX confirms there is a strong trend.
* MACD confirms bullish conditions with both the MACD and signal lines above zero and in the correct crossover direction.
A green label appears below the bar when these bullish conditions align.
---
### 🟥 **Sell Signal**
A sell signal appears when:
* RSI shows strong downward momentum.
* ADX confirms a strong trend.
* MACD confirms bearish conditions, with both MACD and signal lines below zero and in the correct crossover direction.
A red label appears — currently also plotted below the bar (which you may want to move above the bar for better clarity).
---
### ✅ **Use Case**
This script is suitable for:
* Deciding when to deploy **strangle/straddle** strategies in sideways markets.
* Identifying strong **bullish or bearish trends** for directional trades.
* Filtering out weak or indecisive conditions.

Multiple (12) Strong Buy/Sell Signals + Momentum
Indicator Manual: "Multiple (12) Strong Buy/Sell Signals + Momentum"
This indicator is designed to identify strong buy and sell signals based on 12 configurable conditions, which include a variety of technical analysis methods such as trend-following indicators, pattern recognition, volume analysis, and momentum oscillators. It allows for customizable alerts and visual cues on the chart. The indicator helps traders spot potential entry and exit points by displaying buy and sell signals based on the selected conditions.
Key Observations:
• The script integrates multiple indicators and pattern recognition methods to provide comprehensive buy/sell signals.
• Trend-based indicators like EMAs and MACD are combined with pattern recognition (flags, triangles) and momentum-based signals (RSI, ADX, and volume analysis).
• User customization is a core feature, allowing adjustments to the conditions and thresholds for more tailored signals.
• The script is designed to be responsive to market conditions, with multiple conditions filtering out noise to generate reliable signals.
________________________________________
Key Features:
1. 12 Combined Buy/Sell Signal Conditions: This indicator incorporates a diverse set of conditions based on trend analysis, momentum, and price patterns.
2. Minimum Conditions Input: You can adjust the threshold of conditions that need to be met for the buy/sell signals to appear.
3. Alert Customization: Set alert thresholds for both buy and sell signals.
4. Dynamic Visualization: Buy and sell signals are shown as triangles on the chart, with momentum signals highlighted as circles.
________________________________________
Detailed Description of the 12 Conditions:
1. Exponential Moving Averages (EMA):
o Conditions: The indicator uses EMAs with periods 3, 8, and 13 for quick trend-following signals.
o Bullish Signal: EMA3 > EMA8 > EMA13 (Bullish stack).
o Bearish Signal: EMA3 < EMA8 < EMA13 (Bearish stack).
o Reversal Signal: The crossing over or under of these EMAs can signify trend reversals.
2. MACD (Moving Average Convergence Divergence):
o Fast MACD (2, 7, 3) is used to confirm trends quickly.
o Bullish Signal: When the MACD line crosses above the signal line.
o Bearish Signal: When the MACD line crosses below the signal line.
3. Donchian Channel:
o Tracks the highest high and lowest low over a given period (default 20).
o Breakout Signal: Price breaking above the upper band is bullish; breaking below the lower band is bearish.
4. VWAP (Volume-Weighted Average Price):
o Above VWAP: Bullish condition (price above VWAP).
o Below VWAP: Bearish condition (price below VWAP).
5. EMA Stacking & Reversal:
o Tracks the order of EMAs (3, 8, 13) to confirm strong trends and reversals.
o Bullish Reversal: EMA3 < EMA8 < EMA13 followed by a crossing to bullish.
o Bearish Reversal: EMA3 > EMA8 > EMA13 followed by a crossing to bearish.
6. Bull/Bear Flags:
o Bull Flag: Characterized by a strong price movement (flagpole) followed by a pullback and breakout.
o Bear Flag: Similar to Bull Flag but in the opposite direction.
7. Triangle Patterns (Ascending and Descending):
o Detects ascending and descending triangles using pivot highs and lows.
o Ascending Triangle: Higher lows and flat resistance.
o Descending Triangle: Lower highs and flat support.
8. Volume Sensitivity:
o Identifies price moves with significant volume increases.
o High Volume: When current volume is significantly above the moving average volume (set to 1.2x of the average).
9. Momentum Indicators:
o RSI (Relative Strength Index): Confirms overbought and oversold levels with thresholds set at 65 (overbought) and 35 (oversold).
o ADX (Average Directional Index): Confirms strong trends when ADX > 28.
o Momentum Up: Momentum is upward with strong volume and bullish RSI/ADX conditions.
o Momentum Down: Momentum is downward with strong volume and bearish RSI/ADX conditions.
10. Bollinger & Keltner Squeeze:
o Squeeze Condition: A contraction in both Bollinger Bands and Keltner Channels indicates low volatility, signaling a potential breakout.
o Squeeze Breakout: Price breaking above or below the squeeze bands.
11. 3 Consecutive Candles Condition:
o Bullish: Price rises for three consecutive candles with higher highs and lows.
o Bearish: Price falls for three consecutive candles with lower highs and lows.
12. Williams %R and Stochastic RSI:
o Williams %R: A momentum oscillator with signals when the line crosses certain levels.
o Stochastic RSI: Provides overbought/oversold levels with smoother signals.
o Combined Signals: You can choose whether to require both WPR and StochRSI to signal a buy/sell.
________________________________________
User Inputs (Inputs Tab):
1. Minimum Conditions for Buy/Sell:
o min_conditions: Number of conditions required to trigger a buy/sell signal on the chart (1 to 12).
o Alert_min_conditions: User-defined alert threshold (how many conditions must be met before an alert is triggered).
2. Donchian Channel Settings:
o Show Donchian: Toggle visibility of the Donchian channel.
o Donchian Length: The length of the Donchian Channel (default 20).
3. Bull/Bear Flag Settings:
o Bull Flag Flagpole Strength: ATR multiplier to define the strength of the flagpole.
o Bull Flag Pullback Length: Length of pullback for the bull flag pattern.
o Bull Flag EMA Length: EMA length used to confirm trend during bull flag pattern.
Similar settings exist for Bear Flag patterns.
4. Momentum Indicators:
o RSI Length: Period for calculating the RSI (default 9).
o RSI Overbought: Overbought threshold for the RSI (default 65).
o RSI Oversold: Oversold threshold for the RSI (default 35).
5. Bollinger/Keltner Squeeze Settings:
o Squeeze Width Threshold: The maximum width of the Bollinger and Keltner Bands for squeeze conditions.
6. Stochastic RSI Settings:
o Stochastic RSI Length: The period for calculating the Stochastic RSI.
7. WPR Settings:
o WPR Length: Period for calculating Williams %R (default 14).
________________________________________
User Inputs (Style Tab):
1. Signal Plotting:
o Control the display and colors of the buy/sell signals, momentum indicators, and pattern signals on the chart.
o Buy/Sell Signals: Can be customized with different colors and shapes (triangle up for buys, triangle down for sells).
o Momentum Signals: Custom circle placement for momentum-up or momentum-down signals.
2. Donchian Channel:
o Show Donchian: Toggle visibility of the Donchian upper, lower, and middle bands.
o Band Colors: Choose the color for each band (upper, lower, middle).
________________________________________
How to Use the Indicator:
1. Adjust Minimum Conditions: Set the minimum number of conditions that must be met for a signal to appear. For example, set it to 5 if you want only stronger signals.
2. Set Alert Threshold: Define the number of conditions needed to trigger an alert. This can be different from the minimum conditions for visual signals.
3. Customize Appearance: Modify the colors and styles of the signals to match your preferences.
________________________________________
Conclusion:
This comprehensive trading indicator uses a combination of trend-following, pattern recognition, and momentum-based conditions to help you spot potential buy and sell opportunities. By adjusting the input settings, you can fine-tune it to match your specific trading strategy, making it a versatile tool for different market conditions.
Signal Reliability Based on Condition Count
The reliability of the buy/sell signals increases as more conditions are met. Here's a breakdown of the probabilities:
1. 1-3 Conditions Met: Lower Probability
o Signals that meet only 1-3 conditions tend to have lower reliability and are considered less probable. These signals may represent false positives or weaker market movements, and traders should approach them with caution.
2. 4 Conditions Met: More Reliable Signal
o When 4 conditions are met, the signal becomes more reliable. This indicates that multiple indicators or market patterns are aligning, increasing the likelihood of a valid buy/sell opportunity. While not foolproof, it's a stronger indication that the market may be moving in a particular direction.
3. 5-6 Conditions Met: Strong Signal
o A signal meeting 5-6 conditions is considered a strong signal. This indicates a well-confirmed move, with several technical indicators and market factors aligning to suggest a higher probability of success. These are the signals that traders often prioritize.
4. 7+ Conditions Met: Rare and High-Confidence Signal
o Signals that meet 7 or more conditions are rare and should be considered high-confidence signals. These represent a significant alignment of multiple factors, and while they are less frequent, they are highly reliable when they do occur. Traders can be more confident in acting on these signals, but they should still monitor market conditions for confirmation.
________________________________________
You can adjust the number of conditions as needed, but this breakdown should give a clear structure on how the signal strength correlates with the number of conditions met!

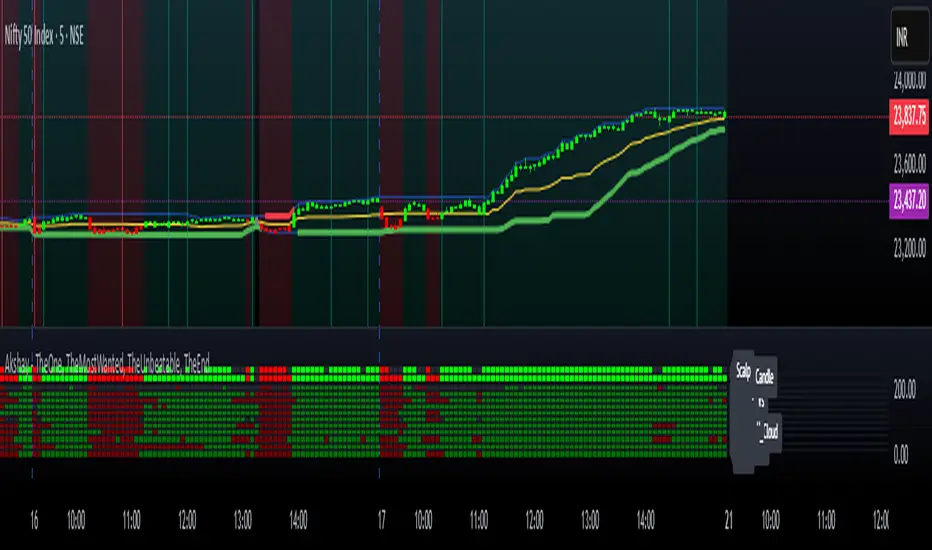
Akshay - TheOne, TheMostWanted, TheUnbeatable, TheEnd➤ All-in-One Solution (❌ No repaint):
This Technical Chart contains, MA24 Condition, Supertrend Indicator, HalfTrend Signal, Ichimoku Cloud Status, Parabolic SAR (P_SAR), First 5-Minute Candle Analysis (ORB5min), Volume-Weighted Moving Average (VWMA), Price-Volume Trend (PVT), Oscillator Composite, RSI Condition, ADX & Trend Strength.
Technicals don't lie.
🚀 Overview and Key Features
Comprehensive Multi-Indicator Approach:
The script is built to be an all-in-one technical indicator on TradingView. It integrates several well-known indicators and overlays—including Supertrend, HalfTrend, Ichimoku Cloud, various moving averages (EMA, SMA, VWMA), oscillators (Klinger, Price Oscillator, Awesome Oscillator, Chaikin Oscillator, Ultimate Oscillator, SMI Ergodic Oscillator, Chande Momentum Oscillator, Detrended Price Oscillator, Money Flow Index), ADX, and Donchian Channels—to create a composite picture of market sentiment.
Signal Generation and Alerts:
It not only calculates these indicators but also aggregates their output into “Master Candle” signals. Vertical lines are drawn on the chart with corresponding alerts to indicate potential buy or sell opportunities based on robust, combined conditions.
Visual Layering:
Through the use of colored histograms, custom candle plots, trend lines, and background color changes, the script offers a multi-layered visual representation of data, providing clarity about both short-term signals and overall market trends.
⚙️ How It Works and Functionality
MA24 Condition:
Uses the 24-period moving average as a proxy; if the price is above it, the bar is colored green, and red if below, with neutrality when conditions aren’t met.
Supertrend Indicator:
Evaluates price relative to the Supertrend level (calculated via ATR), coloring green when price is above it and red when below.
HalfTrend Signal:
Determines trend shifts by comparing the current close to a calculated trend level; green indicates an upward trend, while red suggests a downtrend.
Ichimoku Cloud Status:
Analyzes the relationship between the Conversion and Base lines; a bullish (green) signal is given when price is above both or the Conversion line is higher than the Base line.
Parabolic SAR (P_SAR):
Colors the signal based on whether the current price is above (green) or below (red) the Parabolic SAR marker, indicating stop and reverse conditions.
First 5-Minute Candle Analysis (ORB5min):
Uses key levels from the first 5-minute candle; if price exceeds the candle’s low, VWAP, and MA, it’s bullish (green), otherwise bearish (red).
Volume-Weighted Moving Average (VWMA):
Compares the current price to volume-weighted averages; a price above these levels is shown in green, below in red.
Price-Volume Trend (PVT):
Determines bullish or bearish momentum by comparing PVT to its VWAP—green when above and red when below.
Oscillator Composite:
Aggregates signals from multiple oscillators; a majority of positive results turn it green, while negative dominance results in red.
RSI Condition:
Uses a simple RSI threshold of 50, with values above signifying bullish (green) momentum and below marking bearish (red) conditions.
ADX & Trend Strength:
Reflects overall trend strength through ADX and directional movements; a combination favoring bullish conditions colors it green, with red signaling bearish pressure.
Master Candle Overall Signal:
Combines multiple indicator outputs into one “Master” signal—green for a consensus bullish trend and red for a bearish outlook.
Scalp Signal Variation:
Focused on short-term price changes, this signal adjusts quickly; green indicates improving short-term conditions, while red signals a downturn.
📊 Visualizations and 🎨 User Experience (❌ no repaint)
Dynamic Histograms & Bar Plots:
Each indicator is represented as a colored bar (with added vertical offsets) to facilitate easy comparison of their respective bullish or bearish contributions.
Clear Color-Coding & Labels:
Green (e.g., GreenFluorescent) indicates bullish sentiment.
Red (e.g., RedFluorescent) indicates bearish sentiment.
Custom labels and descriptive text accompany each bar for clarity.
Interactive Charting:
The overall background color adapts based on the “Master Candle” condition, offering an instant read on market sentiment.
The current candlestick is overlaid with color cues to reinforce the indicator’s signal, enhancing the trading experience.
Real-Time Alerts:
Vertical lines appear on signal events (buy/sell triggers), complemented by alerts that help traders stay on top of actionable market moves.
Sharp lines:
The Sharp lines are plotted based upon the EMA5 cross over with the same market trend, marks this as good time to reentry.
🔧 Settings and Customization
Flexible Timeframe Input:
Users can select their preferred timeframe for analysis, making the indicator adaptable to intraday or longer-term trading styles.
Customizable Indicator Parameters:
➤ Supertrend: Adjust ATR length and multiplier factors.
➤ HalfTrend: Tweak amplitude and channel deviation settings.
➤ Ichimoku Cloud & Oscillators: Fine-tune the conversion/base lines and oscillator lengths to match individual trading strategies.
Visual Customization:
The script’s color schemes and plotting styles can be altered as needed, giving users the freedom to tailor the interface to their taste or existing chart setups.
🌟 Uniqueness of the Concept
Integrated Multi-Indicator Synergy:
Combines a diverse range of trend, momentum, and volume-based indicators into a single cohesive system for a holistic market view.
Master Candle Aggregation:
Consolidates numerous individual signals into a "Master Candle" that filters out noise and provides a clear, consensus-based trading signal.
Layered Visual Feedback:
Uses color-coded histograms, adaptive background cues, and dynamic overlays to deliver a visually intuitive guide to market sentiment at a glance.
Customization and Flexibility:
Offers adjustable parameters for each indicator, allowing users to tailor the system to fit diverse trading styles and market conditions.
✅ Conclusion:
Robust Trading Tool & Non-Repainting Reliability:
This versatile technical analysis tool computes an extensive range of indicators, aggregates them into a stable, non-repainting “Master Candle” signal, and maintains consistent, verifiable outputs on historical data.
Holistic Market Insight & Consistent Signal Generation:
By combining trend detection, momentum oscillators, and volume analysis, the indicator delivers a comprehensive snapshot of market conditions and generates dependable signals across varying timeframes.
User-Centric Design with Rich Visual Feedback:
Customizable settings, clear color-coded outputs, adaptive backgrounds, and real-time alerts work together to provide actionable, transparent feedback—enhancing the overall trading experience.
A Unique All-in-One Solution:
The integrated approach not only simplifies complex market dynamics into an easy-to-read visual guide but also empowers systematic traders with a powerful, adaptable asset for accurate decision-making.
❤️ Credits:
Pine Script™ User Manual
Supertrend
Ichimoku Cloud
Parabolic SAR
Price Volume Trend (PVT)
Average Directional Index (ADX)
Volume Oscillator
HalfTrend
Donchian Trend
7-Channel Trend Meter v3🔥 7-Channel Trend Meter – Ultimate Trend Confirmation Tool 💹
Purpose: Supplementary indicator used as confirmation
The 7-Channel Trend Meter offers an all-in-one confirmation system that combines 7 high-accuracy indicators into one easy-to-read visual tool. Say goodbye to guesswork and unnecessary tab-switching—just clear, actionable signals for smarter trades. Whether you're trading stocks, crypto, or forex, this indicator streamlines your decision-making process and enhances your strategy’s performance.
⚙️ What’s Inside The Box?
Here is each tool that the Trend Meter uses, and why/how they're used:
Average Directional Index: Confirms market strength ✅
Directional Movement Index: Confirms trend direction ✅
EMA Cross: Confirms reversals in trend through average price ✅
Relative Strength Index: Confirms trend through divergences ✅
Stochastic Oscillator: Confirms shifts in momentum ✅
Supertrend: Confirms trend-following using ATR calculations ✅
Volume Delta: Confirms buying/selling pressure weight by finding differences ✅
🧾 How To Read It:
🟨 Bar 1 – Market Strength Meter:
Light Gold 🟡: Strong market with trending conditions.
Dark Gold 🟤: Weakening market or consolidation—proceed with caution.
📊 Bars 2 to 7 – Trend Direction Confirmations:
🟩 Green: Bullish signal, uptrend likely.
🟥 Red: Bearish signal, downtrend likely.
💯 Why it's helpful to traders:
✅ 7 Confirmations in 1 View: No need to flip between multiple charts.
✅ Visual Clarity: Spot trends instantly with a quick glance.
✅ Perfect for Entry Confirmation: Confirm trade signals before pulling the trigger.
✅ Boosts Your Win Rate: Make data-backed decisions, not guesses.
✅ Works Across Multiple Markets: Stocks, crypto, forex—you name it 🌍.
🤔 "What's with the indicator mashup/How do these components work together? 🤔
The 7-Channel Trend Meter is designed as an original and useful tool that integrates multiple indicators to enhance trading decisions, rather than merely combining existing tools without logical coherence. This strategic mashup creates a comprehensive analysis framework that offers deeper insights into market conditions by capitalizing on each component's unique strengths. The careful integration of seven indicators creates a unified system that eliminates conflicting signals and enhances the decision-making process. Rather than simply merging indicators for the sake of it, the 7-Channel Trend Meter is designed to streamline trading strategies, making it a practical tool for traders across various markets. By leveraging the combined strengths of these indicators, traders can act with greater confidence, backed by comprehensive data rather than fragmented insights. Here’s how they synergistically work together:
Average Directional Index (ADX) and Directional Movement Index (DMI): The reason for this mashup is because ADX indicates the strength of the prevailing trend, while the DMI pinpoints its direction. Together, they equip traders with a dual framework that not only identifies whether to engage with a trend but also quantifies its strength, allowing for more decisive trading strategies.
EMA Cross: The reason for this addition to the mashup is because this tool signals potential trend reversals by identifying moving average crossovers. When combined with the ADX and DMI, traders can better differentiate between genuine trend shifts and market noise, leading to more accurate entries.
Relative Strength Index (RSI) and Stochastic Oscillator: The reason for this mashup is because by using both momentum indicators, traders gain a multifaceted view of market dynamics. The RSI assesses overbought or oversold conditions, while the Stochastic Oscillator confirms momentum shifts. When both agree with the trend signals from the DMI, it enhances the reliability of reversal or continuation strategies.
Supertrend: The reason for this addition to the mashup is because as a trailing stop based on market volatility, the Supertrend indicator works hand-in-hand with the ADX’s strength assessment, allowing traders to ride strong trends while managing risk. This cohesion prevents premature exits during minor pullbacks.
Volume Delta: The reason for this addition to the mashup is because integrating volume analysis helps validate signals from the price action indicators. Significant volume behind a price movement reinforces the likelihood of its continuation, ensuring that traders can act on well-supported signals.
🔍 How it does what it says it does 🔍
While the exact calculations remain proprietary, the following outlines how the components synergistically work to aid traders in making informed decisions:
Market Strength Assessment: Average Directional Index (ADX)
This component is used as confirmation by measuring the strength of the market trend on a scale from 0 to 100. A reading above 20 generally indicates a strong trend, while readings below 20 suggest sideways movement. The Trend Meter flags strong trends, effectively helping traders identify optimal conditions for entering positions.
Trend Direction Confirmation: Directional Movement Index (DMI)
This component is used as confirmation by distinguishing between bullish and bearish trends by evaluating price movements. This combination allows traders to confirm not only if a trend exists but also its direction, informing whether to buy or sell.
Trend Reversal Detection: Exponential Moving Average (EMA) Cross
This component is used as confirmation by calculating two EMAs (one shorter and one longer) to identify potential reversal points. When the shorter EMA crosses above the longer EMA, it signals a bullish reversal, and vice versa for bearish reversals. This helps traders pinpoint optimal entry or exit points.
Momentum Analysis: Relative Strength Index (RSI) and Stochastic Oscillator
These components are used as confirmation by providing insights into momentum. The RSI assesses the speed and change of price movements, indicating overbought or oversold conditions. The Stochastic Oscillator compares a particular closing price to a range of prices over a specified period. This helps identify whether momentum is slowing or speeding up, offering a clear view of potential reversal points. When both the RSI and Stochastic Oscillator converge on signals, it increases the reliability of those signals in trading decisions.
Volatility-Based Trend Following: Supertrend
This component is used as confirmation by utilizing Average True Range (ATR) calculations to help traders stay in momentum-driven trades by providing dynamic support and resistance levels that adapt to volatility. This enables better risk management while allowing traders to capture stronger trends.
Volume Confirmation: Volume Delta
This component is used as confirmation by analyzing buying and selling pressure by measuring the difference between buy and sell volumes, offering critical insights into market sentiment. Significant volume behind a price movement increases confidence in the sustainability of that move.
🧠 Pro Tip:
When all 7 bars line up in green or red, it’s time to take action: load up for a confirmed move or sit back and wait for market confirmation. Let the Trend Meter guide your strategy with precision.
Conclusion:
Integrate the 7-Channel Trend Meter as useful confirmation for your TradingView strategy and stop trading like the average retail trader. This tool eliminates the noise and helps you stay focused on high-confidence trades.

Multi-Indicator Trading DashboardMulti-Indicator Trading Dashboard: Comprehensive Analysis and Actionable Signals
This Pine Script indicator, "Multi-Indicator Trading Dashboard," provides a comprehensive overview of key market indicators and generates actionable trading signals, all presented in a clear, easy-to-read table format on your TradingView chart.
Key Features:
Real-time Indicator Analysis: The dashboard displays real-time values and signals for:
RSI (Relative Strength Index): Tracks overbought and oversold conditions.
MACD (Moving Average Convergence Divergence): Identifies trend changes and momentum.
ADX (Average Directional Index): Measures trend strength.
Volatility (ATR-based): Estimates volatility as a percentage, acting as a VIX proxy for single-symbol charts.
Trend Determination: Analyzes 20, 50, and 200-period EMAs to provide a clear trend assessment (Strong Bullish, Cautious Bullish, Cautious Bearish, Strong Bearish).
Combined Trading Signals: Integrates signals from RSI, MACD, ADX, and trend analysis to generate a combined "Buy," "Sell," or "Neutral" action signal.
User-Friendly Table Display: Presents all information in a neatly organized table, positioned at the top-right of your chart.
Visual Chart Overlays: Plots 20, 50, and 200-period EMAs directly on the chart for visual trend confirmation.
Background Color Alerts: Colors the chart's background based on the "Buy" or "Sell" action signal for quick visual cues.
Customizable Inputs: Allows you to adjust key parameters like RSI lengths, MACD settings, ADX thresholds, and EMA periods.
How It Works:
Indicator Calculations: The script calculates RSI, MACD, ADX, and a volatility proxy (ATR) using standard Pine Script functions.
Trend Analysis: It compares 20, 50, and 200-period EMAs to determine the overall trend direction.
Individual Signal Generation: It generates individual "Buy," "Sell," or "Neutral" signals based on RSI, MACD, and ADX values.
Combined Signal Logic: It combines the individual signals and trend analysis, assigning a "Buy" or "Sell" action only when at least two indicators align.
Table Display: It creates a table and populates it with the calculated values, signals, and trend information.
Chart Overlays: It plots the EMAs on the chart and colors the background based on the combined action signal.
Use Cases:
Quick Market Overview: Get a snapshot of key market indicators and trend direction at a glance.
Confirmation Tool: Use the combined signals to confirm your existing trading strategies.
Educational Purpose: Learn how different indicators interact and influence trading decisions.
Automated Alerting: Set up alerts based on the "Buy" or "Sell" action signals.
Customization:
Adjust the input parameters to fine-tune the indicator's sensitivity to your trading style and the specific market you're analyzing.
Disclaimer:
This indicator is for informational and educational purposes only and should not be considered financial advice. Always conduct thorough research and consult with 1 a qualified professional before making any 2 trading decisions.
