Dema AFR | viResearchDema AFR | viResearch
Conceptual Foundation and Innovation
The "Dema AFR" indicator combines the Double Exponential Moving Average (DEMA) with an Average True Range (ATR)-based adaptive factor to create a responsive and adaptable trend-following system. The DEMA is known for its ability to smooth price data while reducing lag, making it highly effective for trend detection. By incorporating the ATR as a volatility factor, this indicator adapts dynamically to market conditions, allowing traders to capture trends while accounting for changes in volatility. The result is the Adaptive Factor Range (AFR), which provides clear signals for potential trend shifts and helps manage risk through its adaptive nature. This combination of DEMA smoothing and an ATR-based factor enables traders to follow trends more effectively while maintaining sensitivity to changing market conditions.
Technical Composition and Calculation
The "Dema AFR" script consists of two main components: the Double Exponential Moving Average (DEMA) and the Adaptive Factor Range (AFR). The DEMA is calculated over a user-defined length, smoothing out price fluctuations while reducing lag compared to traditional moving averages. The ATR is used to create a dynamic factor that adjusts the AFR based on market volatility. The factor is calculated by multiplying the ATR by a user-defined factor value, which scales the ATR to define upper and lower bounds for the AFR. The Adaptive Factor Range is derived from the DEMA, with upper and lower bounds set by adding or subtracting the ATR-based factor from the DEMA. When the price moves outside these bounds, the AFR is adjusted, and signals are generated. If the lower bound is exceeded, the AFR adjusts upward, while exceeding the upper bound causes the AFR to adjust downward. This dynamic adjustment helps the indicator stay responsive to market movements.
Features and User Inputs
The "Dema AFR" script provides several customizable inputs, allowing traders to tailor the indicator to their strategies. The DEMA Length controls the smoothing period for the DEMA, while the ATR Period defines the window for calculating the Average True Range. The ATR Factor determines the scale of the adaptive factor, controlling how much the AFR adjusts to volatility. Additionally, customizable bar colors and alert conditions allow traders to visualize the trend direction and receive notifications when key trend shifts occur.
Practical Applications
The "Dema AFR" indicator is designed for traders who want to capture trends while adapting to market volatility. The adaptive nature of the AFR makes it responsive to trend changes, providing early signals of potential trend reversals as the AFR adjusts to market movements. By incorporating ATR into the AFR calculation, the indicator adjusts to changing volatility, helping traders manage risk by staying aligned with market conditions. The AFR also helps confirm whether a price move is supported by momentum, improving the accuracy of trade entries and exits.
Advantages and Strategic Value
The "Dema AFR" script offers a significant advantage by combining the smoothness of the DEMA with the adaptability of the ATR-based factor. This dynamic combination allows the indicator to adjust to market conditions, providing more reliable trend signals in both trending and volatile markets. The adaptive nature of the AFR reduces the risk of false signals and helps traders stay on the right side of the trend while managing risk through volatility-adjusted ranges.
Alerts and Visual Cues
The script includes alert conditions that notify traders of key trend changes. The "Dema AFR Long" alert is triggered when the AFR indicates a potential upward trend, while the "Dema AFR Short" alert signals a potential downward trend. Visual cues such as color changes in the bar chart help traders quickly identify shifts in trend direction, allowing them to make informed decisions in real time.
Summary and Usage Tips
The "Dema AFR | viResearch" indicator provides traders with a powerful tool for trend analysis by combining DEMA smoothing with an ATR-based adaptive factor. This script helps traders stay aligned with trends while accounting for market volatility, improving their ability to detect trend reversals and manage risk. By incorporating this indicator into your trading strategy, you can make more informed decisions, whether in trending or volatile market environments. The "Dema AFR" offers a reliable and flexible solution for traders at all levels.
Note: Backtests are based on past results and are not indicative of future performance.
ابحث في النصوص البرمجية عن "backtest"

Ema Z-score | viResearchEma Z-score | viResearch
Conceptual Foundation and Innovation
The "Ema Z-score" indicator introduces a novel method of analyzing price deviations from the mean by combining the Exponential Moving Average (EMA) with a Z-score calculation. The Z-score is a statistical measure that quantifies how far a value deviates from the mean in terms of standard deviations. By applying the Z-score to an EMA, this indicator provides traders with insights into the strength and momentum of price movements relative to a smoothed average. This enables better detection of overbought and oversold conditions, as well as potential trend reversals.
The use of the Z-score helps filter out noise and provides more robust signals by highlighting extreme deviations from the mean, allowing traders to make more informed decisions in both trending and ranging markets.
Technical Composition and Calculation
The "Ema Z-score" script consists of two main components: the Exponential Moving Average (EMA) and the Z-score calculation. The EMA is calculated over a user-defined length, smoothing price movements to provide a clearer trend line. The Z-score is then derived by measuring the deviation of the current EMA value from the mean of the EMA over a lookback period, divided by the standard deviation of the EMA during that same period.
For the Z-score calculation, the script first computes the mean EMA over the lookback period using the ta.ema function. It then calculates the standard deviation of the EMA over the same period using the ta.stdev function. The Z-score is determined by subtracting the mean EMA from the current EMA value and dividing by the standard deviation, producing a normalized measure of deviation from the average.
Features and User Inputs
The "Ema Z-score" script offers several customizable inputs that allow traders to adjust the indicator according to their strategies. The EMA Length controls the smoothing period of the EMA, while the Lookback Period defines how far back the script looks when calculating the mean and standard deviation for the Z-score. Customizable thresholds allow traders to define when the Z-score signals potential uptrends or downtrends, based on their chosen levels of deviation.
Practical Applications
The "Ema Z-score" indicator is designed for traders who want to better understand price deviations from the mean and use those insights to identify potential trading opportunities. This tool is particularly effective for:
Identifying Overbought and Oversold Conditions: The Z-score provides a quantitative measure of how far the price has deviated from the mean, helping traders spot extreme conditions that could lead to reversals. Detecting Trend Reversals: By monitoring when the Z-score crosses certain thresholds, traders can identify potential trend reversals early and adjust their positions accordingly. Confirming Trend Strength: The Z-score can help confirm whether a price move is backed by momentum or is likely to revert to the mean, providing additional context for trade entries and exits.
Advantages and Strategic Value
The "Ema Z-score" script offers a significant advantage by combining the smoothing effect of the EMA with the precision of Z-score analysis. This approach reduces the impact of market noise while highlighting meaningful deviations from the norm. The ability to quantify deviations in terms of standard deviations gives traders a statistical edge in identifying overbought or oversold conditions and potential trend shifts. This makes the "Ema Z-score" an effective tool for both trend-following and contrarian strategies.
Alerts and Visual Cues
The script includes alert conditions to notify traders of key Z-score threshold crossings. The "Ema Z-score Long" alert is triggered when the Z-score exceeds the upper threshold, signaling a potential upward trend. Conversely, the "Ema Z-score Short" alert signals a possible downward trend when the Z-score falls below the lower threshold. Visual cues such as color changes in the bar chart and Z-score plot help traders easily identify these conditions on the chart.
Summary and Usage Tips
The "Ema Z-score | viResearch" indicator offers a unique combination of EMA smoothing and Z-score analysis, giving traders a statistical measure of price deviations and improving their ability to detect overbought or oversold conditions, trend reversals, and trend confirmations. By incorporating this script into your trading strategy, you can better quantify price extremes and make more informed decisions in both volatile and stable markets. Whether you're focused on spotting early reversals or confirming ongoing trends, the "Ema Z-score" provides a reliable and customizable solution.
Note: Backtests are based on past results and are not indicative of future performance.

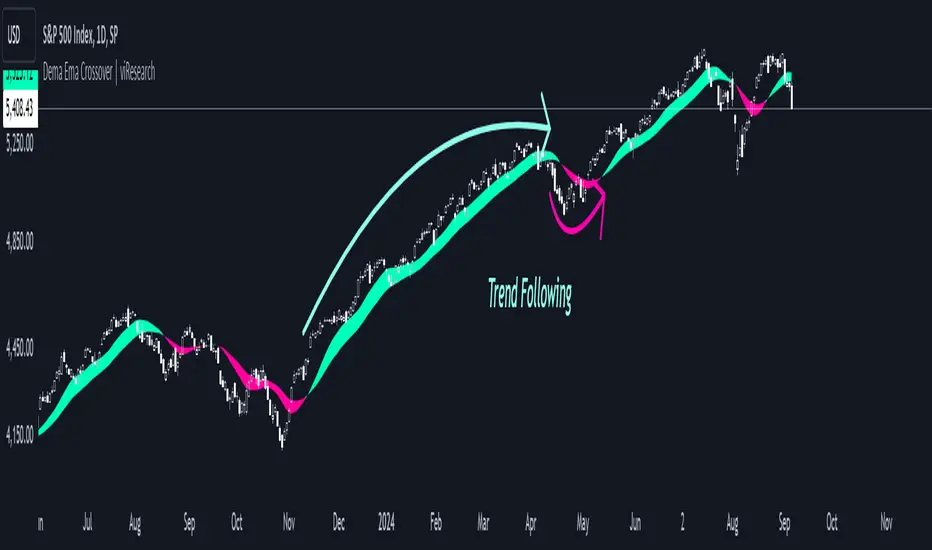
Dema Ema Crossover | viResearchDema Ema Crossover | viResearch
Conceptual Foundation and Innovation
The "Dema Ema Crossover" indicator combines the strengths of the Double Exponential Moving Average (DEMA) with an Exponential Moving Average (EMA) crossover strategy. The DEMA is well-known for its ability to reduce lag compared to standard moving averages, offering smoother trend-following signals. In this script, the DEMA is used as the foundation, with two EMAs applied on top of it to further refine the trend detection and crossover points. This combination provides traders with a robust tool for identifying trend shifts and potential entry or exit points.
By leveraging the faster responsiveness of the DEMA and using EMA crossovers, the "Dema Ema Crossover" indicator helps traders detect and act on trend reversals more efficiently, making it a powerful solution for capturing both short- and long-term market movements.
Technical Composition and Calculation
The "Dema Ema Crossover" script consists of three main components: the Double Exponential Moving Average (DEMA), the fast EMA, and the slow EMA. The DEMA is calculated based on the selected length and source price, providing a smooth representation of market trends. Two EMAs are then applied to the DEMA, with one being faster (shorter period) and the other slower (longer period). The crossover between these two EMAs generates the signals for trend changes.
For the DEMA, the calculation uses the ta.dema function, which reduces lag while maintaining smoothness in the moving average. The fast and slow EMAs are calculated using the ta.ema function, with the fast EMA responding more quickly to price changes, while the slow EMA captures broader trends. The crossover between these two EMAs is used to generate buy and sell signals based on the direction of the crossover.
Features and User Inputs
The "Dema Ema Crossover" script offers several customizable inputs that allow traders to tailor the indicator to their trading strategies. The DEMA Length controls how smooth the DEMA is, with a longer length creating a slower-moving average and a shorter length providing a more responsive one. The Fast EMA Length and Slow EMA Length are also customizable, allowing traders to adjust the sensitivity of the crossover signals based on their market outlook and preferred trading timeframe.
Practical Applications
The "Dema Ema Crossover" indicator is designed for traders looking for a reliable crossover strategy that combines the responsiveness of the DEMA with the precision of EMA crossovers. This tool is particularly effective for:
Identifying Trend Reversals: The crossover between the fast and slow EMAs applied to the DEMA provides early signals of potential trend reversals, allowing traders to position themselves in the market more effectively. Confirming Trend Direction: The combined effect of the DEMA and EMA crossovers helps confirm the strength of a trend, improving decision-making around trade entries and exits. Adapting to Different Market Conditions: The customizable parameters allow traders to adjust the sensitivity of the crossover signals, making the indicator suitable for both fast-moving markets and slower, trending environments.
Advantages and Strategic Value
The "Dema Ema Crossover" script offers a significant advantage by combining the smoothness of the DEMA with the accuracy of EMA crossovers. The DEMA’s ability to reduce lag while maintaining responsiveness makes it ideal for trend-following strategies, while the crossover between the fast and slow EMAs provides precise entry and exit points. This combination reduces false signals and helps traders adapt to changing market conditions, resulting in a more reliable and efficient trend-following system.
Alerts and Visual Cues
The script includes alert conditions to notify traders of key crossover events. The "Dema Ema Crossover Long" alert is triggered when the fast EMA crosses above the slow EMA, signaling a potential upward trend. Conversely, the "Dema Ema Crossover Short" alert signals a possible downward trend when the fast EMA crosses below the slow EMA. Visual cues such as colored fills between the two EMAs highlight these crossover points on the chart, helping traders quickly identify trend shifts.
Summary and Usage Tips
The "Dema Ema Crossover | viResearch" indicator provides traders with a powerful combination of the DEMA and EMA crossovers, offering a smooth yet responsive tool for detecting trend reversals and confirming trend direction. By incorporating this script into your trading strategy, you can improve your ability to capture trend changes with greater accuracy, reducing the impact of market noise. Whether you are focused on short-term market moves or long-term trends, the "Dema Ema Crossover" indicator offers a flexible and reliable solution for traders at all levels.
Note: Backtests are based on past results and are not indicative of future performance.
Hull For Loop | viResearchHull For Loop | viResearch
Conceptual Foundation and Innovation
The "Hull For Loop" indicator brings together the smoothness and responsiveness of the Hull Moving Average (HMA) with a dynamic loop-based scoring system. The HMA is known for its ability to reduce lag while maintaining smooth trend representation, making it a popular choice for traders looking for a responsive and reliable moving average. By incorporating a for loop system that compares current and past HMA values over a user-defined range, the "Hull For Loop" script generates a score that allows traders to detect potential trend changes and assess the strength of ongoing trends. This combination of the HMA and a loop-based evaluation system provides traders with a powerful tool for understanding market momentum and making informed trading decisions.
Technical Composition and Calculation
The "Hull For Loop" script consists of two key elements: the Hull Moving Average (HMA) and the For Loop Scoring System. The HMA is calculated using a weighted moving average (WMA) of the price data, adjusted to reduce lag and provide a smoother trend line. The for loop compares the current HMA to past values over a customizable range, generating a score based on whether the current HMA is higher or lower than previous values.
For the Hull Moving Average, the calculation involves applying a WMA to the source price over the selected length. The result is then used in a secondary WMA calculation to further smooth the output and reduce lag. The For Loop Scoring System evaluates the HMA over a defined range (from and to) by adding or subtracting from the score depending on whether the current HMA is higher or lower than past values. This final score reflects the overall trend strength and direction.
Features and User Inputs
The "Hull For Loop" script offers several customizable inputs, allowing traders to tailor the indicator to their strategies. The Hull Length controls the period over which the HMA is calculated, affecting how quickly the indicator responds to price changes. The Loop Range (From and To) defines the range over which the for loop compares past HMA values, offering flexibility in assessing trend strength over different timeframes. Additionally, customizable thresholds allow traders to define when the score signals an uptrend or downtrend, providing control over the indicator's sensitivity to market conditions.
Practical Applications
The "Hull For Loop" indicator is designed for traders looking to capitalize on the smooth trend representation of the HMA while gaining insights into market momentum through a loop-based scoring system. This tool is particularly effective for identifying trend reversals, as the for loop scoring system provides early signals of potential trend reversals by comparing the current HMA to past values, giving traders an advantage in volatile markets. By analyzing the HMA across a range of past values, the indicator helps confirm whether trends are gaining or losing strength, improving trade entry and exit points. The customizable parameters allow traders to adjust the indicator to different market conditions, making it suitable for both short-term and long-term strategies.
Advantages and Strategic Value
The "Hull For Loop" script provides a significant advantage by combining the smoothness of the HMA with a dynamic scoring system. The HMA's ability to reduce lag while providing a clear trend signal makes it ideal for trend-following strategies, while the loop-based scoring system adds a layer of analysis that helps reduce false signals. This combination results in a reliable tool for identifying and confirming trends, allowing traders to adapt more effectively to changing market conditions.
Alerts and Visual Cues
The script includes alert conditions to notify traders of key trend changes. The "Hull For Loop Long" alert is triggered when the score crosses the upper threshold, signaling a potential upward trend. Conversely, the "Hull For Loop Short" alert signals a possible downward trend when the score crosses below the lower threshold. Visual cues, such as changes in the background color, highlight these trend shifts on the chart, helping traders quickly identify potential market reversals.
Summary and Usage Tips
The "Hull For Loop | viResearch" indicator offers traders a robust tool for trend analysis by combining the benefits of the Hull Moving Average with a dynamic loop-based scoring system. By incorporating this script into your trading strategy, you can improve your ability to detect and confirm trends with greater accuracy, reducing the impact of market noise. Whether you are focused on identifying early trend reversals or confirming ongoing trends, the "Hull For Loop" provides a reliable and customizable solution for traders of all levels.
Note: Backtests are based on past results and are not indicative of future performance.

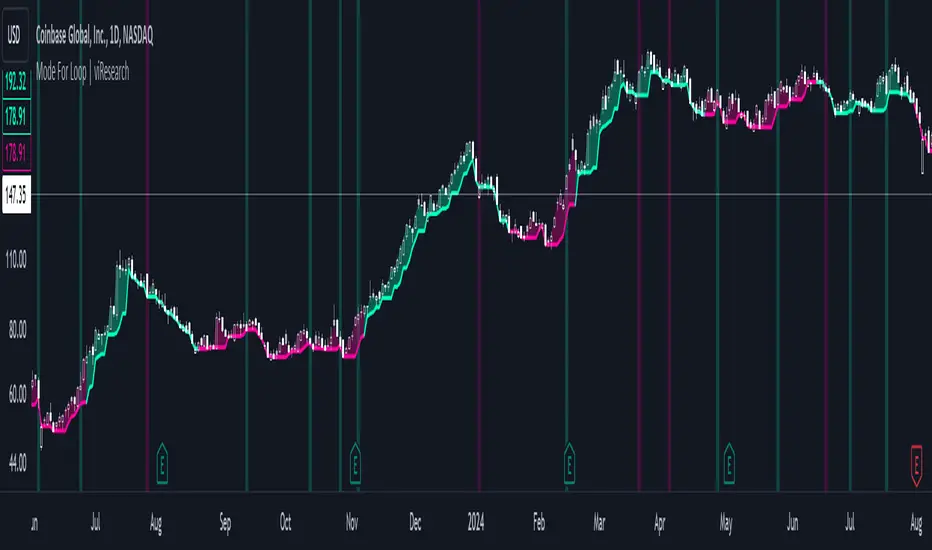
Mode For Loop | viResearchMode For Loop | viResearch
Conceptual Foundation and Innovation
The "Mode For Loop" indicator introduces a novel approach to market analysis by incorporating the mode calculation into a dynamic scoring system. The mode, which represents the most frequent price over a specified period, provides a robust measure of price centrality that can filter out random fluctuations and offer a clear picture of market trends. Combined with a loop-based evaluation system, this indicator generates a score that helps traders identify potential trend reversals and the strength of ongoing trends. By comparing the current mode with past values over a defined range, the "Mode For Loop" script offers traders a comprehensive tool for understanding market momentum and trend dynamics.
Technical Composition and Calculation
The "Mode For Loop" script consists of two key elements: Mode Calculation and the For Loop Scoring System. The mode represents the most frequent price point within a user-defined length. This value is calculated from the selected source price (e.g., close) and provides a smoothed central price that reflects market consensus over the period. The for loop compares the current mode to historical mode values over a customizable range. The score is calculated by evaluating whether the current mode is higher or lower than past values. A positive score indicates upward momentum, while a negative score suggests downward momentum.
For the Mode Calculation, the mode is determined using the ta.mode function, which identifies the most common price over the selected length. The loop iterates over the defined range (from and to), comparing the current mode to historical values. The score is updated by adding or subtracting based on whether the current mode is greater than or less than the past values, resulting in a total score that reflects the trend direction.
Features and User Inputs
The "Mode For Loop" script offers multiple customizable inputs, allowing traders to fine-tune the indicator to suit their strategies. The Mode Length defines the period over which the mode is calculated, controlling how the indicator smooths out price fluctuations and identifies central price trends. The Loop Range (From and To) allows users to set the range over which the mode is compared to previous values, offering flexibility in assessing trend strength over different time horizons. Customizable thresholds determine when the score signals an uptrend or downtrend, allowing traders to adjust the indicator’s sensitivity to market conditions.
Practical Applications
The "Mode For Loop" indicator is designed for traders who want to leverage the mode’s ability to filter out noise and focus on the most frequent price points. This tool can be particularly effective for detecting trend reversals, as the loop-based scoring system provides early signals of potential reversals by comparing the current mode with past values. This helps traders act before significant market shifts occur. The indicator also excels at confirming trend strength. By analyzing the mode across a range of past values, it offers a clearer view of the strength and sustainability of trends, improving trade entry and exit points. The customizable parameters enable traders to adapt the indicator to various market conditions, making it suitable for both short-term and long-term trading strategies.
Advantages and Strategic Value
The key advantage of the "Mode For Loop" script is its ability to provide a more stable and central measure of price trends using the mode calculation, while also applying a dynamic scoring system for enhanced trend detection. This combination offers traders a more reliable tool for reducing false signals and improving the accuracy of trend-following strategies. The mode’s focus on the most frequent price makes it a robust choice for understanding true market behavior, while the loop-based evaluation ensures that trends are analyzed comprehensively.
Alerts and Visual Cues
The script includes alert conditions to notify traders of key trend signals. The "Mode For Loop Long" alert signals a potential upward trend when the score exceeds the upper threshold, while the "Mode For Loop Short" alert indicates a possible downward trend when the score falls below the lower threshold. The indicator also includes visual cues, with background colors changing when the score crosses key levels, helping traders quickly identify potential shifts in market direction.
Summary and Usage Tips
The "Mode For Loop | viResearch" indicator offers a powerful combination of mode-based price smoothing and dynamic trend scoring, giving traders a detailed and responsive tool for trend analysis. By incorporating this script into your trading system, you can improve your ability to detect and confirm trends while minimizing the impact of market noise. Whether you're focused on capturing early trend reversals or confirming ongoing trends, this indicator provides a reliable and flexible solution.
Note: Backtests are based on past results and are not indicative of future performance.
Median For Loop | viResearchMedian For Loop | viResearch
Conceptual Foundation and Innovation
The "Median For Loop" indicator provides an innovative approach to analyzing market data by combining the power of the Median Price with a dynamic scoring system based on a for loop mechanism. This unique script evaluates the median price of the market over a user-defined period, then applies a loop function to generate a score that helps traders detect trends, reversals, and market momentum.
The median, being a robust measure of central tendency, helps filter out noise and better represent the middle of a price range. By applying a loop function that compares the current median to historical values, this script offers a detailed view of price momentum, allowing traders to detect potential trend changes with improved accuracy.
Technical Composition and Calculation
The "Median For Loop" script is composed of two primary components:
Median Calculation: The indicator calculates the median price of the market based on the chosen input source (default is HLC3: the average of high, low, and close) and the specified length. This creates a central value around which market movements can be evaluated.
For Loop Scoring System: This system compares the current median value with past values within a user-defined range, generating a score that reflects how the market is trending. The loop mechanism dynamically sums the score based on whether the current median is higher or lower than historical medians, providing a clear signal of trend strength and direction.
Key Calculations:
Median Calculation: The median is calculated using the percentile_nearest_rank function, providing the 50th percentile of the selected price data over the given length.
For Loop Scoring:
The loop evaluates the median over a defined range (from and to), comparing the current median to historical values.
If the current median is higher than a previous value, a positive score is added; if it is lower, a negative score is added. This forms the final total score, indicating the trend strength.
Features and User Inputs
The "Median For Loop" script offers flexibility and customization options for traders to adapt it to various market conditions and trading strategies:
Median Length: Control the period over which the median price is calculated, affecting the responsiveness of the indicator to price changes.
Loop Range (From and To): Define the range over which the loop evaluates historical median values, allowing traders to adjust how far back the script looks when assessing momentum.
Thresholds: User-defined thresholds are available to specify when the score indicates an uptrend or downtrend. This provides traders with control over the sensitivity of the trend signals.
Practical Applications
The "Median For Loop" indicator is ideal for traders seeking a balanced, noise-filtered approach to trend detection. It is particularly effective for:
Detecting Early Trend Reversals: The loop-based scoring system offers early signals of potential reversals by comparing the current median with past medians, giving traders an advantage in volatile markets.
Confirming Trend Strength: By analyzing the median over time, the script helps confirm whether trends are gaining or losing momentum, improving the accuracy of trade entries and exits.
Strategic Positioning: The customizable parameters allow traders to adapt the script to various market conditions, enhancing their ability to position themselves effectively in both trending and ranging markets.
Advantages and Strategic Value
The key advantage of the "Median For Loop" script is its ability to reduce market noise by focusing on the median price while providing a dynamic scoring system for trend detection. The combination of median calculation and loop-based evaluation offers a more refined view of market momentum, reducing false signals and increasing the reliability of trend identification. This makes it a valuable tool for traders aiming to enhance their market timing and strategy development.
Alerts and Visual Cues
The script includes built-in alerts to notify traders of potential trend changes:
Median For Loop Long: Triggers when the score exceeds the upper threshold, indicating a possible upward trend.
Median For Loop Short: Triggers when the score falls below the lower threshold, signaling a potential downward trend.
Visual cues are also provided, with background colors highlighting potential trend shifts when the score crosses certain levels, offering traders an easy-to-read signal on the chart.
Summary and Usage Tips
The "Median For Loop | viResearch" indicator provides a powerful combination of median price smoothing and dynamic trend scoring, allowing traders to gain a clearer understanding of market momentum. By incorporating this script into your trading strategy, you can improve your ability to detect trends and reversals while reducing the noise that often affects price data. Whether you're focusing on early reversals or confirming the strength of existing trends, this indicator offers a reliable and customizable solution.
Note: Backtests are based on past results and are not indicative of future performance.

Lsma For Loop | viResearchLsma For Loop | viResearch
Conceptual Foundation and Innovation
The "Lsma For Loop" indicator offers a unique combination of the Least Squares Moving Average (LSMA) with a dynamic scoring system based on a loop function. By comparing the current LSMA value with historical values over a user-defined range, this indicator generates a detailed score that helps detect trend strength and potential reversals. This approach provides traders with a more nuanced analysis of price action, allowing them to identify trends earlier and with more accuracy.
The LSMA, which minimizes lag compared to traditional moving averages, is ideal for detecting trends as it provides a smooth and quick-to-respond line. When combined with the loop-based scoring system, traders can benefit from a powerful tool for analyzing market momentum and capturing profitable trends.
Technical Composition and Calculation
The "Lsma For Loop" script features two essential components:
Least Squares Moving Average (LSMA): The LSMA is calculated over a user-defined length using a linear regression model. It provides a smooth line that follows price trends more closely, reducing the noise that is often present in simple moving averages.
For Loop Scoring System: This system evaluates the LSMA over a range of previous values, generating a score based on whether the current LSMA is higher or lower than its previous values within the specified range. The resulting score reflects the strength of the trend, with higher scores indicating a stronger uptrend and lower scores signaling a downtrend.
Key Calculations:
LSMA Calculation: The LSMA is derived from the closing price over the selected period (len), providing a smooth moving average that fits the price data closely.
For Loop Scoring:
The loop iterates over a range of previous LSMA values, comparing the current LSMA to each past value.
If the current LSMA is higher than a previous value, a positive score is added; if it is lower, a negative score is added. The sum of these comparisons forms the overall score.
Features and User Inputs
The "Lsma For Loop" script offers a range of customization options, allowing traders to tailor the indicator to their specific trading strategies and market conditions:
LSMA Length: Adjust the length of the LSMA, controlling the smoothness of the indicator and how quickly it reacts to price changes.
Loop Range (From and To): Define the range over which the for loop evaluates LSMA values. This provides flexibility in assessing momentum over different timeframes.
Thresholds: Customizable threshold levels are used to define when the score indicates an uptrend or downtrend. This allows traders to fine-tune the sensitivity of the indicator to market movements.
Practical Applications
The "Lsma For Loop" is a versatile tool for traders who want to leverage the advantages of LSMA smoothing while gaining a more detailed view of trend strength. This indicator is particularly useful for:
Identifying Trend Reversals: The loop-based scoring system provides an early indication of potential trend reversals, allowing traders to react before major market movements.
Confirming Trend Strength: By evaluating the LSMA against a range of previous values, the script helps confirm whether a trend is strengthening or weakening.
Enhanced Market Positioning: The customizable range and thresholds enable traders to adapt the script to different market conditions, whether they are day trading or swing trading.
Advantages and Strategic Value
The primary advantage of the "Lsma For Loop" script lies in its ability to provide a more granular analysis of LSMA behavior through the use of the for loop. This dynamic approach reduces the likelihood of false signals and offers greater accuracy in detecting trends. The indicator’s versatility makes it a valuable tool for both short-term and long-term trading strategies.
Alerts and Visual Cues
The script includes built-in alert conditions to notify traders of key trend changes:
Lsma For Loop Long: Indicates a potential upward trend when the score exceeds the upper threshold.
Lsma For Loop Short: Signals a potential downward trend when the score falls below the lower threshold.
Additionally, visual cues such as background color changes highlight when the score crosses certain key levels, providing an easy-to-read representation of market trends directly on the chart.
Summary and Usage Tips
The "Lsma For Loop | viResearch" indicator provides traders with a powerful tool that combines LSMA smoothing with a dynamic loop-based scoring system for trend detection. Incorporating this script into your trading strategy can help improve trend identification and enhance decision-making around entries and exits. Whether you are trading in trending markets or looking for early reversal signals, this script offers a reliable and flexible solution.
Note: Backtests are based on past results and are not indicative of future performance.

Dema Vstop | viResearchTitle: Dema Vstop | viResearch
Conceptual Foundation and Innovation
The "Dema Vstop" indicator combines the Double Exponential Moving Average (DEMA) with the Volatility Stop (Vstop) concept to improve trend-following and trend-reversal signals. This script provides a more responsive and dynamic approach to identifying trends and capturing market movements by integrating these two powerful tools. It is particularly effective for traders who seek a balance between smoothing out price action and quickly adapting to volatile changes in the market.
The DEMA smooths the price action more effectively than a traditional moving average, while the Vstop introduces a volatility-adjusted stop-loss mechanism, allowing traders to adapt to the market's changing conditions. The result is a robust system that captures both trend direction and potential reversal points with improved precision.
Technical Composition and Calculation
At the core of the "Dema Vstop" script are two primary components:
Double Exponential Moving Average (DEMA): This is used to smooth the source price over a user-defined period (dema_len), making it ideal for trend identification.
Volatility Stop (Vstop): The Vstop mechanism uses the Average True Range (ATR) to adjust stop-loss levels based on market volatility, allowing the indicator to account for changes in market conditions.
Key Calculations:
DEMA Calculation: Based on the selected length and source, the DEMA smooths the price data.
Vstop Calculation: The ATR (with customizable length) is used to adjust the stop distance, and the Vstop level is calculated based on whether the price is trending up or down.
Features and User Inputs
The "Dema Vstop" script offers a high degree of customization:
DEMA Length and Source: Control the smoothness of the DEMA and the price data being smoothed.
Vstop Length: Customize the length of the ATR calculation to control how reactive the Vstop is to price volatility.
Multiplier: Adjust the sensitivity of the Vstop to market volatility. A higher multiplier results in a wider stop, while a lower multiplier tightens the stop, making it more sensitive to price changes.
Practical Applications
The "Dema Vstop" is designed for traders looking for a hybrid trend-following system that is both smooth and responsive. It can be particularly useful for:
Identifying Trends: The combination of DEMA and Vstop makes trend-following easier, helping traders stay in profitable positions longer.
Volatility Protection: The Vstop dynamically adjusts based on market volatility, providing a built-in risk management tool that reduces exposure to volatile markets.
Reversals and Entries: The Vstop helps identify potential reversals by flipping its stop level when the trend direction changes, making it effective for signaling entries and exits with improved accuracy.
Advantages and Strategic Value
The key advantage of the "Dema Vstop" script lies in its ability to offer smoother trend detection through the DEMA while dynamically adapting to volatility using the Vstop. This combination reduces false signals, providing traders with a more stable and reliable tool for trend trading. Additionally, the customizable parameters allow traders to fine-tune the indicator to suit different trading styles and market conditions.
Alerts and Visual Cues
The script comes with built-in alert conditions that trigger when a trend shift is detected:
- Dema Vstop Long: Signals a potential upward trend.
- Dema Vstop Short: Signals a potential downward trend.
These alerts ensure that traders can stay informed about critical market changes without constantly monitoring the chart.
Summary and Usage Tips
The "Dema Vstop | viResearch" script is an innovative trend-following tool that combines the smoothness of DEMA with the adaptive qualities of Vstop. By offering a customizable and dynamic system, this indicator helps traders navigate the complexities of volatile markets while reducing noise and false signals. Incorporating this script into your trading strategy can improve trend analysis and increase the accuracy of entries and exits.
Note: Backtests are based on past results and are not indicative of future performance.

Median Standard Deviation | viResearchMedian Standard Deviation | viResearch
The "Median Standard Deviation" indicator, developed by viResearch, introduces a unique combination of median smoothing and standard deviation to detect trends and volatility in market data. This tool provides traders with a stable and accurate measure of price trends by integrating median smoothing with a customized calculation of the standard deviation. This innovative approach allows for enhanced sensitivity to market fluctuations while filtering out short-term price noise.
Technical Composition and Calculation:
The "Median Standard Deviation" indicator incorporates median smoothing and dynamic standard deviation calculations to build upon traditional volatility measures.
Median Smoothing:
DEMA Calculation (len_dema): The script applies a Double Exponential Moving Average (DEMA) to smooth the price data over a user-defined period, reducing noise and helping traders focus on broader market trends.
Median Calculation (median_len): The smoothed DEMA data is further refined by calculating the 50th percentile (median) over a specified length, ensuring that the central tendency of price data is captured more accurately than with a simple moving average.
Volatility Measurement:
ATR Calculation (atr_len, atr_mul): The script incorporates the Average True Range (ATR) to measure market volatility. The user-defined ATR multiplier is applied to this value to calculate upper and lower trend bands around the median, providing a dynamic measure of potential price movement based on recent volatility.
Standard Deviation Analysis:
Standard Deviation Calculation (len_sd): The script calculates the standard deviation of the median over a user-defined length, providing another layer of volatility measurement. The upper and lower standard deviation bands (sdd, sdl) act as additional indicators of price extremes.
Trend Detection:
Trend Logic: The indicator uses the calculated bands to identify whether the price is moving within or outside the standard deviation and ATR bands. Crosses above or below these bands are used to signal potential uptrends or downtrends, offering traders a clear view of market direction.
Features and User Inputs:
The "Median Standard Deviation" script offers a variety of user inputs to customize the indicator to suit traders' styles and market conditions:
DEMA Length: Allows traders to adjust the sensitivity of the DEMA smoothing to control the amount of noise filtered from the price data.
Median Length: Users can define the length over which the median price is calculated, providing flexibility in capturing short-term or long-term trends.
ATR Length and Multiplier: These inputs let traders fine-tune the ATR calculation, affecting the size of the dynamic upper and lower bands.
Standard Deviation Length: Controls how the standard deviation is calculated, allowing for further customization in detecting price volatility.
Practical Applications:
The "Median Standard Deviation" indicator is particularly effective in volatile markets where price swings can lead to false signals using traditional methods. By combining median smoothing and standard deviation, this tool provides a more robust analysis of trends and price movements.
Key Uses:
Trend Following: The upper and lower bands provide clear signals for entering and exiting trades based on whether the price is moving outside the calculated ranges.
Volatility Detection: The integration of ATR and standard deviation bands allows traders to assess market volatility in real time, enabling more informed trading decisions.
Noise Reduction: The use of median smoothing ensures that short-term price fluctuations do not interfere with broader trend analysis, making this indicator ideal for traders looking to avoid whipsaws in volatile markets.
Advantages and Strategic Value:
The "Median Standard Deviation" indicator offers several key advantages:
Precision in Trend Detection: The combination of median smoothing and standard deviation allows traders to detect trends with greater accuracy, reducing the risk of false signals.
Customization: With several adjustable parameters, traders can fine-tune the indicator to suit different timeframes and trading strategies.
Volatility Sensitivity: By incorporating ATR and standard deviation, this indicator provides an adaptive measure of market volatility, ensuring that traders are always aware of potential price swings.
Summary and Usage Tips:
The "Median Standard Deviation" indicator is a powerful tool for traders looking to refine their analysis of market trends and volatility. Its combination of median smoothing and standard deviation provides a nuanced view of market movements, helping traders make better-informed decisions. It's recommended to experiment with the various input parameters to optimize the indicator for specific needs, whether used for trend detection, volatility analysis, or noise reduction. The "Median Standard Deviation" offers a reliable and adaptable solution for modern trading strategies.
Please keep in mind the following text: Backtests are based on past results and are not indicative of future performance.

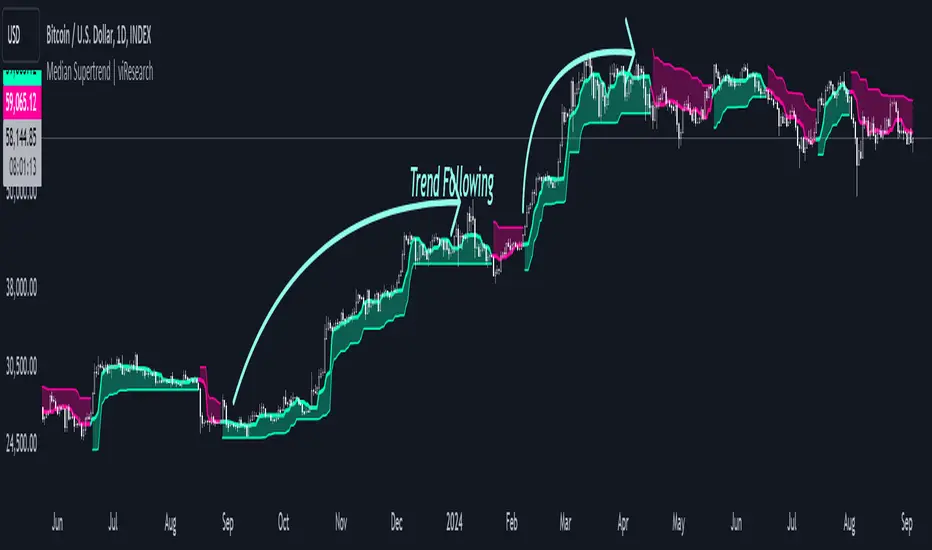
Median Supertrend | viResearchMedian Supertrend | viResearch
Conceptual Foundation and Innovation
The "Median Supertrend" indicator, developed by viResearch, offers a unique approach to identifying trends by combining a median-based smoothing mechanism with a modified Supertrend calculation. Unlike the traditional Supertrend, which relies solely on price data, this version calculates a median percentile of the closing price over a specified length, resulting in a more accurate representation of underlying trends.
Technical Composition and Calculation
The "Median Supertrend" enhances the conventional Supertrend formula by introducing improvements to minimize lag and improve responsiveness to market volatility.
Median Smoothing:
The script uses the 50th percentile of the closing price over a user-defined period to provide a smoother representation of price movements, reducing the influence of short-term price spikes or dips for more stable trend analysis.
Supertrend Calculation:
The indicator applies the Average True Range (ATR) to determine the upper and lower trend bands, which are then shifted above or below the smoothed price (median) by a multiple of the ATR, customizable by users to adjust sensitivity.
Trend Logic:
The script uses the upper and lower bands to detect whether the price is trending upwards or downwards and introduces persistence logic to prevent excessive shifting of the bands during consolidating market phases. This mechanism ensures that once the trend changes, the bands adjust smoothly rather than oscillating with each price movement.
Directional Analysis:
Based on price action relative to the trend bands, a directional variable (d) is computed to track whether the price crosses above or below these bands, signaling uptrends or downtrends. The script also includes events to detect transitions from bullish to bearish trends and vice versa, with the option to set alerts for timely decision-making.
Features and User Inputs
The "Median Supertrend" offers several customizable parameters to suit different trading styles:
Supertrend Length: Defines the period used to calculate the smoothing, allowing users to adjust the indicator's sensitivity based on market conditions.
Multiplier: Controls how far the trend bands are placed from the median price. Traders can increase the multiplier for less frequent trend changes or decrease it for more sensitive detection.
Median Length: Governs the length over which the median price is calculated, providing further customization to balance responsiveness and stability.
Practical Applications
The "Median Supertrend" is particularly useful in markets with rapid trend reversals and high volatility, offering an effective way to filter out noise and capture significant trend changes promptly.
Key Uses:
Trend Following: The indicator's primary function is to identify prevailing trends and guide traders in aligning with the market's direction, with its smoothing mechanism helping to ensure reliable trend signals.
Trend Reversal Detection: By tracking crossovers and crossunders relative to the Supertrend bands, the indicator helps traders detect potential reversals early, making it valuable in fast-moving markets.
Strategic Positioning: With adjustable sensitivity and real-time alerts, the "Median Supertrend" can adapt to a variety of trading strategies, from scalping to longer-term trend-following.
Advantages and Strategic Value
The "Median Supertrend" offers advantages over traditional trend indicators:
Reduced Noise: Median smoothing reduces noise from extreme price movements, ensuring more reliable trend signals.
Customizability: With adjustable length and multiplier settings, the indicator allows traders to fine-tune its sensitivity for different market conditions.
Responsiveness: Median-based smoothing, coupled with the ATR, provides a more responsive and adaptive measure of trend direction, particularly valuable in volatile markets.
Summary and Usage Tips
The "Median Supertrend" indicator is a potent tool for capturing market trends with increased precision and reduced lag. It combines the best features of traditional Supertrend indicators with the added stability of median-based smoothing, making it highly effective in volatile markets. Traders are encouraged to experiment with the length and multiplier settings to optimize the indicator for their specific trading strategies, while alerts and visual cues further enhance its utility.
Please keep in mind the following text: Backtests are based on past results and are not indicative of future performance.
Enhanced Local Polynomial Regression [Yosiet]Local Polynomial Regression (LPR) is an advanced statistical method that offers a flexible approach to estimating the underlying trend in financial time series data.
The Mathematical Explanation
The core idea of LPR is to fit a polynomial of degree p at each point x using weighted least squares. The weight of each data point decreases with its distance from x, controlled by a kernel function and a bandwidth parameter.
The general form of the local polynomial estimator is:
β̂(x) = argmin Σ K((Xi - x) / h) (Yi - β0 - β1(Xi - x) - ... - βp(Xi - x)^p)^2
Where:
β̂(x) is the vector of estimated coefficients
K is the kernel function
h is the bandwidth
Xi and Yi are the predictor and response variables
p is the degree of the polynomial
Our implementation uses the Epanechnikov kernel:
K(u) = 3/4 * (1 - u^2) for |u| ≤ 1, 0 otherwise
The Implementation
This script implements LPR for the easier way to interpret its values with the following key components:
Input Parameters: Can adjust the lookback period, bandwidth, and polynomial degree.
Kernel Function: The Epanechnikov kernel is used for weighting.
LPR Function: Implements the core algorithm using matrix operations.
Signal Generation: Generates buy/sell signals based on crossovers of smoothed price and LPR results.
How to Use
Apply the indicator to your chart in TradingView.
Adjust the input parameters:
Lookback Period: Controls how many past bars are considered.
Bandwidth: Affects the smoothness of the regression line.
Polynomial Degree: Determines the complexity of the local fit.
Signal Smoothing Length: Adjusts the responsiveness of buy/sell signals.
Monitor buy/sell signals for potential trade entries.
Limitations
Sensitivity to Parameters: The choice of bandwidth and polynomial degree significantly impacts the results.
Lag: Like all trend-following indicators, LPR may lag behind rapid price movements.
Edge Effects: The indicator may be less reliable at the edges of the data (recent bars).
Recommendations
Parameter Optimization: Experiment with different lookback periods, bandwidths, and polynomial degrees to find the best fit for your trading style and timeframe.
Combine with Other Indicators: Use LPR in conjunction with momentum oscillators or volume indicators for confirmation.
Multiple Timeframes: Apply LPR on different timeframes to gain a more comprehensive view of the trend.
Avoid Overfitting: Be cautious of using high polynomial degrees, as they may lead to overfitting on historical data.
Consider Market Conditions: LPR works best in trending markets; be aware of its limitations in ranging or highly volatile conditions.
Backtest Thoroughly: Always backtest strategies based on LPR across different market conditions before live trading.
Conclusion
Local Polynomial Regression offers a sophisticated approach to trend analysis in financial markets. By providing a flexible, adaptive trend line, it can help traders identify potential entry and exit points with greater precision than traditional moving averages. However, like all technical indicators, it should be used as part of a comprehensive trading strategy that includes proper risk management and consideration of fundamental factors.
if you have an strategy or idea and need to make it real through an indicator or trading bot, you can DM or comment

Price Close ProbabilityThe Price Close Probability Indicator is designed to help traders estimate the likelihood of price closing above or below specified levels within a given bar. By placing two levels on your chart, you can quickly gauge the probability of the current price bar closing above or below these levels in real-time.
Key Features:
Dynamic Probability Calculation: The indicator continuously updates the probability of price closing above or below your set levels as the current bar progresses, providing you with timely insights as the bar approaches its close.
Customizable Standard Deviation : Adjust the length of the Standard Deviation used in the calculations to tailor the probability estimates to your preferred settings.
User-Friendly Probability Table : A clean, easy-to-read table displays the calculated probabilities, helping you make informed trading decisions at a glance.
Assumptions and Considerations:
While the indicator assumes that returns are normally distributed, which may not fully reflect reality, it still offers a valuable approximation of the probabilities for price movement within the current bar.
Future Enhancements (Coming Soon):
Multi-Bar Probability: Calculate probabilities across multiple bars to enhance your forecasting capabilities.
Additional Levels: Set more than two levels for a broader analysis of price movements.
Refined Distribution Modeling: Improve the accuracy of probability calculations by adjusting for more realistic return distributions.
Disclaimer
Please remember that past performance may not be indicative of future results.
Due to various factors, including changing market conditions, the strategy may no longer perform as well as in historical backtesting.
This post and the script don’t provide any financial advice.

All Harmonic Patterns [theEccentricTrader]█ OVERVIEW
This indicator automatically draws and sends alerts for all of the harmonic patterns in my public library as they occur. The patterns included are as follows:
• Bearish 5-0
• Bullish 5-0
• Bearish ABCD
• Bullish ABCD
• Bearish Alternate Bat
• Bullish Alternate Bat
• Bearish Bat
• Bullish Bat
• Bearish Butterfly
• Bullish Butterfly
• Bearish Cassiopeia A
• Bullish Cassiopeia A
• Bearish Cassiopeia B
• Bullish Cassiopeia B
• Bearish Cassiopeia C
• Bullish Cassiopeia C
• Bearish Crab
• Bullish Crab
• Bearish Deep Crab
• Bullish Deep Crab
• Bearish Cypher
• Bullish Cypher
• Bearish Gartley
• Bullish Gartley
• Bearish Shark
• Bullish Shark
• Bearish Three-Drive
• Bullish Three-Drive
█ CONCEPTS
Green and Red Candles
• A green candle is one that closes with a close price equal to or above the price it opened.
• A red candle is one that closes with a close price that is lower than the price it opened.
Swing Highs and Swing Lows
• A swing high is a green candle or series of consecutive green candles followed by a single red candle to complete the swing and form the peak.
• A swing low is a red candle or series of consecutive red candles followed by a single green candle to complete the swing and form the trough.
Peak and Trough Prices
• The peak price of a complete swing high is the high price of either the red candle that completes the swing high or the high price of the preceding green candle, depending on which is higher.
• The trough price of a complete swing low is the low price of either the green candle that completes the swing low or the low price of the preceding red candle, depending on which is lower.
Historic Peaks and Troughs
The current, or most recent, peak and trough occurrences are referred to as occurrence zero. Previous peak and trough occurrences are referred to as historic and ordered numerically from right to left, with the most recent historic peak and trough occurrences being occurrence one.
Upper Trends
• A return line uptrend is formed when the current peak price is higher than the preceding peak price.
• A downtrend is formed when the current peak price is lower than the preceding peak price.
• A double-top is formed when the current peak price is equal to the preceding peak price.
Lower Trends
• An uptrend is formed when the current trough price is higher than the preceding trough price.
• A return line downtrend is formed when the current trough price is lower than the preceding trough price.
• A double-bottom is formed when the current trough price is equal to the preceding trough price.
Range
The range is simply the difference between the current peak and current trough prices, generally expressed in terms of points or pips.
Wave Cycles
A wave cycle is here defined as a complete two-part move between a swing high and a swing low, or a swing low and a swing high. The first swing high or swing low will set the course for the sequence of wave cycles that follow; for example a chart that begins with a swing low will form its first complete wave cycle upon the formation of the first complete swing high and vice versa.
Figure 1.
Retracement and Extension Ratios
Retracement and extension ratios are calculated by dividing the current range by the preceding range and multiplying the answer by 100. Retracement ratios are those that are equal to or below 100% of the preceding range and extension ratios are those that are above 100% of the preceding range.
Fibonacci Retracement and Extension Ratios
The Fibonacci sequence is a series of numbers in which each number is the sum of the two preceding numbers, starting with 0 and 1. For example 0 + 1 = 1, 1 + 1 = 2, 1 + 2 = 3, and so on. Ultimately, we could go on forever but the first few numbers in the sequence are as follows: 0 , 1, 1, 2, 3, 5, 8, 13, 21, 34, 55, 89, 144.
The extension ratios are calculated by dividing each number in the sequence by the number preceding it. For example 0/1 = 0, 1/1 = 1, 2/1 = 2, 3/2 = 1.5, 5/3 = 1.6666..., 8/5 = 1.6, 13/8 = 1.625, 21/13 = 1.6153..., 34/21 = 1.6190..., 55/34 = 1.6176..., 89/55 = 1.6181..., 144/89 = 1.6179..., and so on. The retracement ratios are calculated by inverting this process and dividing each number in the sequence by the number proceeding it. For example 0/1 = 0, 1/1 = 1, 1/2 = 0.5, 2/3 = 0.666..., 3/5 = 0.6, 5/8 = 0.625, 8/13 = 0.6153..., 13/21 = 0.6190..., 21/34 = 0.6176..., 34/55 = 0.6181..., 55/89 = 0.6179..., 89/144 = 0.6180..., and so on.
Fibonacci ranges are typically drawn from left to right, with retracement levels representing ratios inside of the current range and extension levels representing ratios extended outside of the current range. If the current wave cycle ends on a swing low, the Fibonacci range is drawn from peak to trough. If the current wave cycle ends on a swing high the Fibonacci range is drawn from trough to peak.
Measurement Tolerances
Tolerance refers to the allowable variation or deviation from a specific value or dimension. It is the range within which a particular measurement is considered to be acceptable or accurate. I have applied this concept in my pattern detection logic and have set default tolerances where applicable, as perfect patterns are, needless to say, very rare.
Chart Patterns
Generally speaking price charts are nothing more than a series of swing highs and swing lows. When demand outweighs supply over a period of time prices swing higher and when supply outweighs demand over a period of time prices swing lower. These swing highs and swing lows can form patterns that offer insight into the prevailing supply and demand dynamics at play at the relevant moment in time.
‘Let us assume… that you the reader, are not a member of that mysterious inner circle known to the boardrooms as “the insiders”… But it is fairly certain that there are not nearly so many “insiders” as amateur trader supposes and… It is even more certain that insiders can be wrong… Any success they have, however, can be accomplished only by buying and selling… hey can do neither without altering the delicate poise of supply and demand that governs prices. Whatever they do is sooner or later reflected on the charts where you… can detect it. Or detect, at least, the way in which the supply-demand equation is being affected… So, you do not need to be an insider to ride with them frequently… prices move in trends. Some of those trends are straight, some are curved; some are brief and some are long and continued… produced in a series of action and reaction waves of great uniformity. Sooner or later, these trends change direction; they may reverse (as from up to down), or they may be interrupted by some sort of sideways movement and then, after a time, proceed again in their former direction… when a price trend is in the process of reversal… a characteristic area or pattern takes shape on the chart, which becomes recognisable as a reversal formation… Needless to say, the first and most important task of the technical chart analyst is to learn to know the important reversal formations and to judge what they may signify in terms of trading opportunities’ (Edwards & Magee, 1948).
This is as true today as it was when Edwards and Magee were writing in the first half of the last Century, study your patterns and make judgements for yourself about what their implications truly are on the markets and timeframes you are interested in trading.
Over the years, traders have come to discover a multitude of chart and candlestick patterns that are supposed to pertain information on future price movements. However, it is never so clear cut in practice and patterns that where once considered to be reversal patterns are now considered to be continuation patterns and vice versa. Bullish patterns can have bearish implications and bearish patterns can have bullish implications. As such, I would highly encourage you to do your own backtesting.
There is no denying that chart patterns exist, but their implications will vary from market to market and timeframe to timeframe. So it is down to you as an individual to study them and make decisions about how they may be used in a strategic sense.
Harmonic Patterns
The concept of harmonic patterns in trading was first introduced by H.M. Gartley in his book "Profits in the Stock Market", published in 1935. Gartley observed that markets have a tendency to move in repetitive patterns, and he identified several specific patterns that he believed could be used to predict future price movements. The bullish and bearish Gartley patterns are the oldest recognized harmonic patterns in trading and all the other harmonic patterns are modifications of the original Gartley patterns. Gartley patterns are fundamentally composed of 5 points, or 4 waves.
Since then, many other traders and analysts have built upon Gartley's work and developed their own variations of harmonic patterns. One such contributor is Larry Pesavento, who developed his own methods for measuring harmonic patterns using Fibonacci ratios. Pesavento has written several books on the subject of harmonic patterns and Fibonacci ratios in trading. Another notable contributor to harmonic patterns is Scott Carney, who developed his own approach to harmonic trading in the late 1990s and also popularised the use of Fibonacci ratios to measure harmonic patterns. Carney expanded on Gartley's work and also introduced several new harmonic patterns, such as the Shark pattern and the 5-0 pattern.
█ INPUTS
• Change pattern and label colours
• Show or hide patterns individually
• Adjust pattern tolerances
• Set or remove alerts for individual patterns
█ NOTES
You can test the patterns with your own strategies manually by applying the indicator to your chart while in bar replay mode and playing through the history. You could also automate this process with PineScript by using the conditions from my swing and pattern libraries as entry conditions in the strategy tester or your own custom made strategy screener.
█ LIMITATIONS
All green and red candle calculations are based on differences between open and close prices, as such I have made no attempt to account for green candles that gap lower and close below the close price of the preceding candle, or red candles that gap higher and close above the close price of the preceding candle. This may cause some unexpected behaviour on some markets and timeframes. I can only recommend using 24-hour markets, if and where possible, as there are far fewer gaps and, generally, more data to work with.
█ SOURCES
Edwards, R., & Magee, J. (1948) Technical Analysis of Stock Trends (10th edn). Reprint, Boca Raton, Florida: Taylor and Francis Group, CRC Press: 2013.

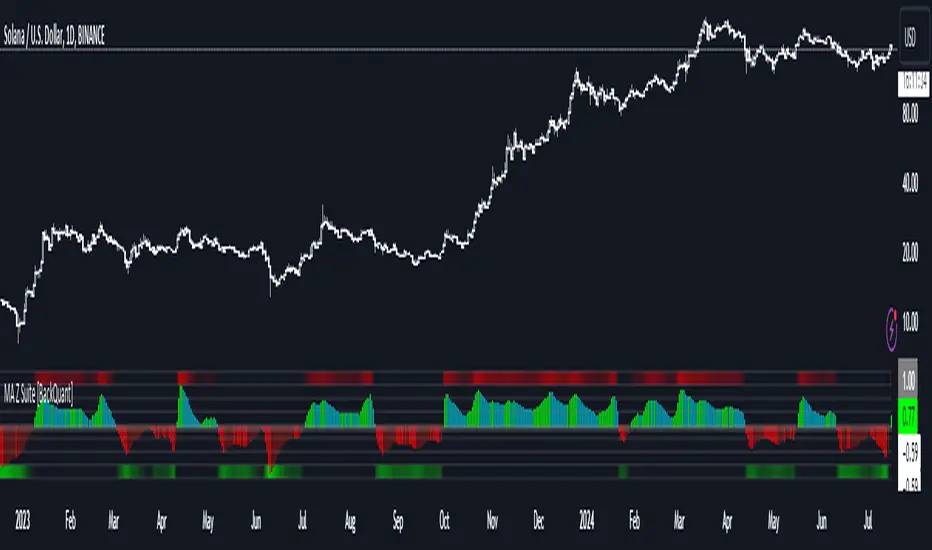
Moving Average Z-Score Suite [BackQuant]Moving Average Z-Score Suite
1. What is this indicator
The Moving Average Z-Score Suite is a versatile indicator designed to help traders identify and capitalize on market trends by utilizing a variety of moving averages. This indicator transforms selected moving averages into a Z-Score oscillator, providing clear signals for potential buy and sell opportunities. The indicator includes options to choose from eleven different moving average types, each offering unique benefits and characteristics. It also provides additional features such as standard deviation levels, extreme levels, and divergence detection, enhancing its utility in various market conditions.
2. What is a Z-Score
A Z-Score is a statistical measurement that describes a value's relationship to the mean of a group of values. It is measured in terms of standard deviations from the mean. For instance, a Z-Score of 1.0 means the value is one standard deviation above the mean, while a Z-Score of -1.0 indicates it is one standard deviation below the mean. In the context of financial markets, Z-Scores can be used to identify overbought or oversold conditions by determining how far a particular value (such as a moving average) deviates from its historical mean.
3. What moving averages can be used
The Moving Average Z-Score Suite allows users to select from the following eleven moving averages:
Simple Moving Average (SMA)
Hull Moving Average (HMA)
Exponential Moving Average (EMA)
Weighted Moving Average (WMA)
Double Exponential Moving Average (DEMA)
Running Moving Average (RMA)
Linear Regression Curve (LINREG) (This script can be found standalone )
Triple Exponential Moving Average (TEMA)
Arnaud Legoux Moving Average (ALMA)
Kalman Hull Moving Average (KHMA)
T3 Moving Average
Each of these moving averages has distinct properties and reacts differently to price changes, allowing traders to select the one that best fits their trading style and market conditions.
4. Why Turning a Moving Average into a Z-Score is Innovative and Its Benefits
Transforming a moving average into a Z-Score is an innovative approach because it normalizes the moving average values, making them more comparable across different periods and instruments. This normalization process helps in identifying extreme price movements and mean-reversion opportunities more effectively. By converting the moving average into a Z-Score, traders can better gauge the relative strength or weakness of a trend and detect potential reversals. This method enhances the traditional moving average analysis by adding a statistical perspective, providing clearer and more objective trading signals.
5. How It Can Be Used in the Context of a Trading System
In a trading system, it can be used to generate buy and sell signals based on the Z-Score values. When the Z-Score crosses above zero, it indicates a potential buying opportunity, suggesting that the price is above its mean and possibly trending upward. Conversely, a Z-Score crossing below zero signals a potential selling opportunity, indicating that the price is below its mean and might be trending downward. Additionally, the indicator's ability to show standard deviation levels and extreme levels helps traders set profit targets and stop-loss levels, improving risk management and trade planning.
6. How It Can Be Used for Trend Following
For trend-following strategies, it can be particularly useful. The Z-Score oscillator helps traders identify the strength and direction of a trend. By monitoring the Z-Score and its rate of change, traders can confirm the persistence of a trend and make informed decisions to enter or exit trades. The indicator's divergence detection feature further enhances trend-following by identifying potential reversals before they occur, allowing traders to capitalize on trend shifts. By providing a clear and quantifiable measure of trend strength, this indicator supports disciplined and systematic trend-following strategies.
No backtests for this indicator due to the many options and ways it can be used,
Enjoy
Multiple Instrument Automation ScreenerI have developed a Pine Script indicator on TradingView designed to demonstrate how to automate execution for ten instruments. This example utilizes a straightforward, Simple Moving Average (SMA) indicator. You can use it as a template, but use your indicator.
The indicator computes long/short signals based on the crossing of the SMA using the security function
It acts as a screener, presenting calculation results in an organized table format.
Utilizing the varip variable, the indicator sends alerts for multiple instruments sequentially rather than simultaneously.
For every generated signal, the indicator builds and sends a JSON execution command to a third-party tool, ensuring seamless integration and automation. You can use your own format.
Sent alerts look like this:
{"ticker": "DOGEBTC","action": "buy","price": "0.00000199","time": "1719754620658"}
Details and Limitations
Instrument Limit: The example is configured for ten instruments for simplicity. However, it can be expanded to handle up to 40 instruments.
Alert Rate Limit: There is a rate limit of 15 alerts in 3 minutes. Exceeding this limit may cause some alerts to be stopped. This can be managed by tracking the alert times and delaying some alerts, though this may affect the entry prices.
Timing of Signal Generation : The indicator processes signals at the bar close to the active instrument. Due to its computational complexity, there is a slight delay in collecting all records, potentially causing signals to reflect a few seconds before the bar closes. Care should be taken when executing based on these signals.
Disclaimer
Please remember that past performance may not be indicative of future results.
Due to various factors, including changing market conditions, the strategy may no longer perform as well as in historical backtesting.
This post and the script don’t provide any financial advice.

Multiple Indicators Screener v2After taking the approval of Mr. QuantNomad
Multiple Indicators Screener by QuantNomad
New lists have been modified and added
Built-in indicators:
RSI (Relative Strength Index): Provides trading opportunities based on overbought or oversold market conditions.
MFI (Cash Flow Index): Measures the flow of cash into or from assets, which helps in identifying buying and selling areas.
Williams Percent Range (WPR): Measures how high or low the price has been in the last time period, giving signals of periods of saturation.
Supertrend: Used to determine market direction and potential entry and exit locations.
Volume Change Percentage: Provides an analysis of the volume change percentage, which helps in identifying demand and supply changes for assets.
How to use:
Users can choose which symbols they want to monitor and analyze using a variety of built-in indicators.
The indicator provides visual signals that help traders identify potential trading opportunities based on the selected settings.
RSI in purple = buy weak liquidity (safe entry).
MFI in yellow = Liquidity
WPR in blue = RSI, MFI and WPR in oversold areas for all.
Allows users to customize the display locations and appearance of the cursor to their personal preferences.
Disclaimer
Please remember that past performance may not be indicative of future results.
Due to various factors, including changing market conditions, the strategy may no longer perform as well as in historical backtesting.
This post and the script don’t provide any financial advice.
=========================================================================
فاحص لمؤشرات متعددة مع مخرجات جدول شاملة لتسهيل مراقبة الكثير من العملات تصل الى 99 في وقت واحد
بختصر الشرح
ظهور اللون البنفسجي يعني كمية الشراء ضعف السيولة .
ظهور اللون الازرق جميع المؤشرات وصلة الى مرحلة التشبع البيعي ( دخول آمن )
ظهور اللون الاصفر يعني السيولة ضعفين الشراء ( عكس اتجاه قريب ) == ركزو على هاللون خصوصا مع عملات الخفيفة

Bearish Cassiopeia C Harmonic Patterns [theEccentricTrader]█ OVERVIEW
This indicator automatically detects and draws bearish Cassiopeia C harmonic patterns and price projections derived from the ranges that constitute the patterns.
Cassiopeia A, B and C harmonic patterns are patterns that I created/discovered myself. They are all inspired by the Cassiopeia constellation and each one is based on different rotations of the constellation as it moves through the sky. The range ratios are also based on the constellation's right ascension and declination listed on Wikipedia:
Right ascension 22h 57m 04.5897s–03h 41m 14.0997s
Declination 77.6923447°–48.6632690°
en.wikipedia.org
I actually developed this idea quite a while ago now but have not felt audacious enough to introduce a new harmonic pattern, let alone 3 at the same time! But I have since been able to run backtests on tick data going back to 2002 across a variety of market and timeframe combinations and have learned that the Cassiopeia patterns can certainly hold their own against the currently known harmonic patterns.
I would also point out that the Cassiopeia constellation does actually look like a harmonic pattern and the Cassiopeia A star is literally the 'strongest source of radio emission in the sky beyond the solar system', so its arguably more of a real harmonic phenomenon than the current patterns.
www.britannica.com
chandra.si.edu
█ CONCEPTS
Green and Red Candles
• A green candle is one that closes with a close price equal to or above the price it opened.
• A red candle is one that closes with a close price that is lower than the price it opened.
Swing Highs and Swing Lows
• A swing high is a green candle or series of consecutive green candles followed by a single red candle to complete the swing and form the peak.
• A swing low is a red candle or series of consecutive red candles followed by a single green candle to complete the swing and form the trough.
Peak and Trough Prices (Basic)
• The peak price of a complete swing high is the high price of either the red candle that completes the swing high or the high price of the preceding green candle, depending on which is higher.
• The trough price of a complete swing low is the low price of either the green candle that completes the swing low or the low price of the preceding red candle, depending on which is lower.
Historic Peaks and Troughs
The current, or most recent, peak and trough occurrences are referred to as occurrence zero. Previous peak and trough occurrences are referred to as historic and ordered numerically from right to left, with the most recent historic peak and trough occurrences being occurrence one.
Range
The range is simply the difference between the current peak and current trough prices, generally expressed in terms of points or pips.
Upper Trends
• A return line uptrend is formed when the current peak price is higher than the preceding peak price.
• A downtrend is formed when the current peak price is lower than the preceding peak price.
• A double-top is formed when the current peak price is equal to the preceding peak price.
Lower Trends
• An uptrend is formed when the current trough price is higher than the preceding trough price.
• A return line downtrend is formed when the current trough price is lower than the preceding trough price.
• A double-bottom is formed when the current trough price is equal to the preceding trough price.
Muti-Part Upper and Lower Trends
• A multi-part return line uptrend begins with the formation of a new return line uptrend and continues until a new downtrend ends the trend.
• A multi-part downtrend begins with the formation of a new downtrend and continues until a new return line uptrend ends the trend.
• A multi-part uptrend begins with the formation of a new uptrend and continues until a new return line downtrend ends the trend.
• A multi-part return line downtrend begins with the formation of a new return line downtrend and continues until a new uptrend ends the trend.
Double Trends
• A double uptrend is formed when the current trough price is higher than the preceding trough price and the current peak price is higher than the preceding peak price.
• A double downtrend is formed when the current peak price is lower than the preceding peak price and the current trough price is lower than the preceding trough price.
Muti-Part Double Trends
• A multi-part double uptrend begins with the formation of a new uptrend that proceeds a new return line uptrend, and continues until a new downtrend or return line downtrend ends the trend.
• A multi-part double downtrend begins with the formation of a new downtrend that proceeds a new return line downtrend, and continues until a new uptrend or return line uptrend ends the trend.
Wave Cycles
A wave cycle is here defined as a complete two-part move between a swing high and a swing low, or a swing low and a swing high. The first swing high or swing low will set the course for the sequence of wave cycles that follow; for example a chart that begins with a swing low will form its first complete wave cycle upon the formation of the first complete swing high and vice versa.
Figure 1.
Retracement and Extension Ratios
Retracement and extension ratios are calculated by dividing the current range by the preceding range and multiplying the answer by 100. Retracement ratios are those that are equal to or below 100% of the preceding range and extension ratios are those that are above 100% of the preceding range.
Fibonacci Retracement and Extension Ratios
The Fibonacci sequence is a series of numbers in which each number is the sum of the two preceding numbers, starting with 0 and 1. For example 0 + 1 = 1, 1 + 1 = 2, 1 + 2 = 3, and so on. Ultimately, we could go on forever but the first few numbers in the sequence are as follows: 0 , 1, 1, 2, 3, 5, 8, 13, 21, 34, 55, 89, 144.
The extension ratios are calculated by dividing each number in the sequence by the number preceding it. For example 0/1 = 0, 1/1 = 1, 2/1 = 2, 3/2 = 1.5, 5/3 = 1.6666..., 8/5 = 1.6, 13/8 = 1.625, 21/13 = 1.6153..., 34/21 = 1.6190..., 55/34 = 1.6176..., 89/55 = 1.6181..., 144/89 = 1.6179..., and so on. The retracement ratios are calculated by inverting this process and dividing each number in the sequence by the number proceeding it. For example 0/1 = 0, 1/1 = 1, 1/2 = 0.5, 2/3 = 0.666..., 3/5 = 0.6, 5/8 = 0.625, 8/13 = 0.6153..., 13/21 = 0.6190..., 21/34 = 0.6176..., 34/55 = 0.6181..., 55/89 = 0.6179..., 89/144 = 0.6180..., and so on.
1.618 is considered to be the 'golden ratio', found in many natural phenomena such as the growth of seashells and the branching of trees. Some now speculate the universe oscillates at a frequency of 0,618 Hz, which could help to explain such phenomena, but this theory has yet to be proven.
Traders and analysts use Fibonacci retracement and extension indicators, consisting of horizontal lines representing different Fibonacci ratios, for identifying potential levels of support and resistance. Fibonacci ranges are typically drawn from left to right, with retracement levels representing ratios inside of the current range and extension levels representing ratios extended outside of the current range. If the current wave cycle ends on a swing low, the Fibonacci range is drawn from peak to trough. If the current wave cycle ends on a swing high the Fibonacci range is drawn from trough to peak.
Harmonic Patterns
The concept of harmonic patterns in trading was first introduced by H.M. Gartley in his book "Profits in the Stock Market", published in 1935. Gartley observed that markets have a tendency to move in repetitive patterns, and he identified several specific patterns that he believed could be used to predict future price movements.
Since then, many other traders and analysts have built upon Gartley's work and developed their own variations of harmonic patterns. One such contributor is Larry Pesavento, who developed his own methods for measuring harmonic patterns using Fibonacci ratios. Pesavento has written several books on the subject of harmonic patterns and Fibonacci ratios in trading. Another notable contributor to harmonic patterns is Scott Carney, who developed his own approach to harmonic trading in the late 1990s and also popularised the use of Fibonacci ratios to measure harmonic patterns. Carney expanded on Gartley's work and also introduced several new harmonic patterns, such as the Shark pattern and the 5-0 pattern.
The bullish and bearish Gartley patterns are the oldest recognized harmonic patterns in trading and all the other harmonic patterns are ultimately modifications of the original Gartley patterns. Gartley patterns are fundamentally composed of 5 points, or 4 waves.
Bullish and Bearish Cassiopeia C Harmonic Patterns
• Bullish Cassiopeia C patterns are fundamentally composed of three troughs and two peaks. The second peak being higher than the first peak. And the third trough being lower than both the first and second troughs, while the second trough is higher than the first.
• Bearish Cassiopeia C patterns are fundamentally composed of three peaks and two troughs. The second trough being lower than the first trough. And the third peak being higher than both the first and second peaks, while the second peak is lower than the first.
The ratio measurements I use to detect the patterns are as follows:
• Wave 1 of the pattern, generally referred to as XA, has no specific ratio requirements.
• Wave 2 of the pattern, generally referred to as AB, should retrace by at least 11.34%, but no further than 22.31% of the range set by wave 1.
• Wave 3 of the pattern, generally referred to as BC, should extend by at least 225.7%, but no further than 341% of the range set by wave 2.
• Wave 4 of the pattern, generally referred to as CD, should retrace by at least 77.69%, but no further than 88.66% of the range set by wave 3.
Measurement Tolerances
In general, tolerance in measurements refers to the allowable variation or deviation from a specific value or dimension. It is the range within which a particular measurement is considered to be acceptable or accurate. In this script I have applied this concept to the measurement of harmonic pattern ratios to increase to the frequency of pattern occurrences.
For example, the AB measurement of Gartley patterns is generally set at around 61.8%, but with such specificity in the measuring requirements the patterns are very rare. We can increase the frequency of pattern occurrences by setting a tolerance. A tolerance of 10% to both downside and upside, which is the default setting for all tolerances, means we would have a tolerable measurement range between 51.8-71.8%, thus increasing the frequency of occurrence.
█ FEATURES
Inputs
• AB Lower Tolerance
• AB Upper Tolerance
• BC Lower Tolerance
• BC Upper Tolerance
• CD Lower Tolerance
• CD Upper Tolerance
• Pattern Color
• Label Color
• Show Projections
• Extend Current Projection Lines
Alerts
Users can set alerts for when the patterns occur.
█ LIMITATIONS
All green and red candle calculations are based on differences between open and close prices, as such I have made no attempt to account for green candles that gap lower and close below the close price of the preceding candle, or red candles that gap higher and close above the close price of the preceding candle. This may cause some unexpected behaviour on some markets and timeframes. I can only recommend using 24-hour markets, if and where possible, as there are far fewer gaps and, generally, more data to work with.
█ NOTES
I know a few people have been requesting a single indicator that contains all my patterns and I definitely hear you on that one. However, I have been very busy working on other projects while trying to trade and be a human at the same time. For now I am going to maintain my original approach of releasing each pattern individually so as to maintain consistency. But I am now also working on getting my some of my libraries ready for public release and in doing so I will finally be able to fit all patterns into one script. I will also be giving my scripts some TLC by making them cleaner once I have the libraries up and running. Please bear with me in the meantime, this may take a while. Cheers!

Bullish Cassiopeia C Harmonic Patterns [theEccentricTrader]█ OVERVIEW
This indicator automatically detects and draws bullish Cassiopeia C harmonic patterns and price projections derived from the ranges that constitute the patterns.
Cassiopeia A, B and C harmonic patterns are patterns that I created/discovered myself. They are all inspired by the Cassiopeia constellation and each one is based on different rotations of the constellation as it moves through the sky. The range ratios are also based on the constellation's right ascension and declination listed on Wikipedia:
Right ascension 22h 57m 04.5897s–03h 41m 14.0997s
Declination 77.6923447°–48.6632690°
en.wikipedia.org
I actually developed this idea quite a while ago now but have not felt audacious enough to introduce a new harmonic pattern, let alone 3 at the same time! But I have since been able to run backtests on tick data going back to 2002 across a variety of market and timeframe combinations and have learned that the Cassiopeia patterns can certainly hold their own against the currently known harmonic patterns.
I would also point out that the Cassiopeia constellation does actually look like a harmonic pattern and the Cassiopeia A star is literally the 'strongest source of radio emission in the sky beyond the solar system', so its arguably more of a real harmonic phenomenon than the current patterns.
www.britannica.com
chandra.si.edu
█ CONCEPTS
Green and Red Candles
• A green candle is one that closes with a close price equal to or above the price it opened.
• A red candle is one that closes with a close price that is lower than the price it opened.
Swing Highs and Swing Lows
• A swing high is a green candle or series of consecutive green candles followed by a single red candle to complete the swing and form the peak.
• A swing low is a red candle or series of consecutive red candles followed by a single green candle to complete the swing and form the trough.
Peak and Trough Prices (Basic)
• The peak price of a complete swing high is the high price of either the red candle that completes the swing high or the high price of the preceding green candle, depending on which is higher.
• The trough price of a complete swing low is the low price of either the green candle that completes the swing low or the low price of the preceding red candle, depending on which is lower.
Historic Peaks and Troughs
The current, or most recent, peak and trough occurrences are referred to as occurrence zero. Previous peak and trough occurrences are referred to as historic and ordered numerically from right to left, with the most recent historic peak and trough occurrences being occurrence one.
Range
The range is simply the difference between the current peak and current trough prices, generally expressed in terms of points or pips.
Upper Trends
• A return line uptrend is formed when the current peak price is higher than the preceding peak price.
• A downtrend is formed when the current peak price is lower than the preceding peak price.
• A double-top is formed when the current peak price is equal to the preceding peak price.
Lower Trends
• An uptrend is formed when the current trough price is higher than the preceding trough price.
• A return line downtrend is formed when the current trough price is lower than the preceding trough price.
• A double-bottom is formed when the current trough price is equal to the preceding trough price.
Muti-Part Upper and Lower Trends
• A multi-part return line uptrend begins with the formation of a new return line uptrend and continues until a new downtrend ends the trend.
• A multi-part downtrend begins with the formation of a new downtrend and continues until a new return line uptrend ends the trend.
• A multi-part uptrend begins with the formation of a new uptrend and continues until a new return line downtrend ends the trend.
• A multi-part return line downtrend begins with the formation of a new return line downtrend and continues until a new uptrend ends the trend.
Double Trends
• A double uptrend is formed when the current trough price is higher than the preceding trough price and the current peak price is higher than the preceding peak price.
• A double downtrend is formed when the current peak price is lower than the preceding peak price and the current trough price is lower than the preceding trough price.
Muti-Part Double Trends
• A multi-part double uptrend begins with the formation of a new uptrend that proceeds a new return line uptrend, and continues until a new downtrend or return line downtrend ends the trend.
• A multi-part double downtrend begins with the formation of a new downtrend that proceeds a new return line downtrend, and continues until a new uptrend or return line uptrend ends the trend.
Wave Cycles
A wave cycle is here defined as a complete two-part move between a swing high and a swing low, or a swing low and a swing high. The first swing high or swing low will set the course for the sequence of wave cycles that follow; for example a chart that begins with a swing low will form its first complete wave cycle upon the formation of the first complete swing high and vice versa.
Figure 1.
Retracement and Extension Ratios
Retracement and extension ratios are calculated by dividing the current range by the preceding range and multiplying the answer by 100. Retracement ratios are those that are equal to or below 100% of the preceding range and extension ratios are those that are above 100% of the preceding range.
Fibonacci Retracement and Extension Ratios
The Fibonacci sequence is a series of numbers in which each number is the sum of the two preceding numbers, starting with 0 and 1. For example 0 + 1 = 1, 1 + 1 = 2, 1 + 2 = 3, and so on. Ultimately, we could go on forever but the first few numbers in the sequence are as follows: 0 , 1, 1, 2, 3, 5, 8, 13, 21, 34, 55, 89, 144.
The extension ratios are calculated by dividing each number in the sequence by the number preceding it. For example 0/1 = 0, 1/1 = 1, 2/1 = 2, 3/2 = 1.5, 5/3 = 1.6666..., 8/5 = 1.6, 13/8 = 1.625, 21/13 = 1.6153..., 34/21 = 1.6190..., 55/34 = 1.6176..., 89/55 = 1.6181..., 144/89 = 1.6179..., and so on. The retracement ratios are calculated by inverting this process and dividing each number in the sequence by the number proceeding it. For example 0/1 = 0, 1/1 = 1, 1/2 = 0.5, 2/3 = 0.666..., 3/5 = 0.6, 5/8 = 0.625, 8/13 = 0.6153..., 13/21 = 0.6190..., 21/34 = 0.6176..., 34/55 = 0.6181..., 55/89 = 0.6179..., 89/144 = 0.6180..., and so on.
1.618 is considered to be the 'golden ratio', found in many natural phenomena such as the growth of seashells and the branching of trees. Some now speculate the universe oscillates at a frequency of 0,618 Hz, which could help to explain such phenomena, but this theory has yet to be proven.
Traders and analysts use Fibonacci retracement and extension indicators, consisting of horizontal lines representing different Fibonacci ratios, for identifying potential levels of support and resistance. Fibonacci ranges are typically drawn from left to right, with retracement levels representing ratios inside of the current range and extension levels representing ratios extended outside of the current range. If the current wave cycle ends on a swing low, the Fibonacci range is drawn from peak to trough. If the current wave cycle ends on a swing high the Fibonacci range is drawn from trough to peak.
Harmonic Patterns
The concept of harmonic patterns in trading was first introduced by H.M. Gartley in his book "Profits in the Stock Market", published in 1935. Gartley observed that markets have a tendency to move in repetitive patterns, and he identified several specific patterns that he believed could be used to predict future price movements.
Since then, many other traders and analysts have built upon Gartley's work and developed their own variations of harmonic patterns. One such contributor is Larry Pesavento, who developed his own methods for measuring harmonic patterns using Fibonacci ratios. Pesavento has written several books on the subject of harmonic patterns and Fibonacci ratios in trading. Another notable contributor to harmonic patterns is Scott Carney, who developed his own approach to harmonic trading in the late 1990s and also popularised the use of Fibonacci ratios to measure harmonic patterns. Carney expanded on Gartley's work and also introduced several new harmonic patterns, such as the Shark pattern and the 5-0 pattern.
The bullish and bearish Gartley patterns are the oldest recognized harmonic patterns in trading and all the other harmonic patterns are ultimately modifications of the original Gartley patterns. Gartley patterns are fundamentally composed of 5 points, or 4 waves.
Bullish and Bearish Cassiopeia C Harmonic Patterns
• Bullish Cassiopeia C patterns are fundamentally composed of three troughs and two peaks. The second peak being higher than the first peak. And the third trough being lower than both the first and second troughs, while the second trough is higher than the first.
• Bearish Cassiopeia C patterns are fundamentally composed of three peaks and two troughs. The second trough being lower than the first trough. And the third peak being higher than both the first and second peaks, while the second peak is lower than the first.
The ratio measurements I use to detect the patterns are as follows:
• Wave 1 of the pattern, generally referred to as XA, has no specific ratio requirements.
• Wave 2 of the pattern, generally referred to as AB, should retrace by at least 11.34%, but no further than 22.31% of the range set by wave 1.
• Wave 3 of the pattern, generally referred to as BC, should extend by at least 225.7%, but no further than 341% of the range set by wave 2.
• Wave 4 of the pattern, generally referred to as CD, should retrace by at least 77.69%, but no further than 88.66% of the range set by wave 3.
Measurement Tolerances
In general, tolerance in measurements refers to the allowable variation or deviation from a specific value or dimension. It is the range within which a particular measurement is considered to be acceptable or accurate. In this script I have applied this concept to the measurement of harmonic pattern ratios to increase to the frequency of pattern occurrences.
For example, the AB measurement of Gartley patterns is generally set at around 61.8%, but with such specificity in the measuring requirements the patterns are very rare. We can increase the frequency of pattern occurrences by setting a tolerance. A tolerance of 10% to both downside and upside, which is the default setting for all tolerances, means we would have a tolerable measurement range between 51.8-71.8%, thus increasing the frequency of occurrence.
█ FEATURES
Inputs
• AB Lower Tolerance
• AB Upper Tolerance
• BC Lower Tolerance
• BC Upper Tolerance
• CD Lower Tolerance
• CD Upper Tolerance
• Pattern Color
• Label Color
• Show Projections
• Extend Current Projection Lines
Alerts
Users can set alerts for when the patterns occur.
█ LIMITATIONS
All green and red candle calculations are based on differences between open and close prices, as such I have made no attempt to account for green candles that gap lower and close below the close price of the preceding candle, or red candles that gap higher and close above the close price of the preceding candle. This may cause some unexpected behaviour on some markets and timeframes. I can only recommend using 24-hour markets, if and where possible, as there are far fewer gaps and, generally, more data to work with.
█ NOTES
I know a few people have been requesting a single indicator that contains all my patterns and I definitely hear you on that one. However, I have been very busy working on other projects while trying to trade and be a human at the same time. For now I am going to maintain my original approach of releasing each pattern individually so as to maintain consistency. But I am now also working on getting my some of my libraries ready for public release and in doing so I will finally be able to fit all patterns into one script. I will also be giving my scripts some TLC by making them cleaner once I have the libraries up and running. Please bear with me in the meantime, this may take a while. Cheers!

Bearish Cassiopeia B Harmonic Patterns [theEccentricTrader]█ OVERVIEW
This indicator automatically detects and draws bearish Cassiopeia B harmonic patterns and price projections derived from the ranges that constitute the patterns.
Cassiopeia A, B and C harmonic patterns are patterns that I created/discovered myself. They are all inspired by the Cassiopeia constellation and each one is based on different rotations of the constellation as it moves through the sky. The range ratios are also based on the constellation's right ascension and declination listed on Wikipedia:
Right ascension 22h 57m 04.5897s–03h 41m 14.0997s
Declination 77.6923447°–48.6632690°
en.wikipedia.org
I actually developed this idea quite a while ago now but have not felt audacious enough to introduce a new harmonic pattern, let alone 3 at the same time! But I have since been able to run backtests on tick data going back to 2002 across a variety of market and timeframe combinations and have learned that the Cassiopeia patterns can certainly hold their own against the currently known harmonic patterns.
I would also point out that the Cassiopeia constellation does actually look like a harmonic pattern and the Cassiopeia A star is literally the 'strongest source of radio emission in the sky beyond the solar system', so its arguably more of a real harmonic phenomenon than the current patterns.
www.britannica.com
chandra.si.edu
█ CONCEPTS
Green and Red Candles
• A green candle is one that closes with a close price equal to or above the price it opened.
• A red candle is one that closes with a close price that is lower than the price it opened.
Swing Highs and Swing Lows
• A swing high is a green candle or series of consecutive green candles followed by a single red candle to complete the swing and form the peak.
• A swing low is a red candle or series of consecutive red candles followed by a single green candle to complete the swing and form the trough.
Peak and Trough Prices (Basic)
• The peak price of a complete swing high is the high price of either the red candle that completes the swing high or the high price of the preceding green candle, depending on which is higher.
• The trough price of a complete swing low is the low price of either the green candle that completes the swing low or the low price of the preceding red candle, depending on which is lower.
Historic Peaks and Troughs
The current, or most recent, peak and trough occurrences are referred to as occurrence zero. Previous peak and trough occurrences are referred to as historic and ordered numerically from right to left, with the most recent historic peak and trough occurrences being occurrence one.
Range
The range is simply the difference between the current peak and current trough prices, generally expressed in terms of points or pips.
Upper Trends
• A return line uptrend is formed when the current peak price is higher than the preceding peak price.
• A downtrend is formed when the current peak price is lower than the preceding peak price.
• A double-top is formed when the current peak price is equal to the preceding peak price.
Lower Trends
• An uptrend is formed when the current trough price is higher than the preceding trough price.
• A return line downtrend is formed when the current trough price is lower than the preceding trough price.
• A double-bottom is formed when the current trough price is equal to the preceding trough price.
Muti-Part Upper and Lower Trends
• A multi-part return line uptrend begins with the formation of a new return line uptrend and continues until a new downtrend ends the trend.
• A multi-part downtrend begins with the formation of a new downtrend and continues until a new return line uptrend ends the trend.
• A multi-part uptrend begins with the formation of a new uptrend and continues until a new return line downtrend ends the trend.
• A multi-part return line downtrend begins with the formation of a new return line downtrend and continues until a new uptrend ends the trend.
Double Trends
• A double uptrend is formed when the current trough price is higher than the preceding trough price and the current peak price is higher than the preceding peak price.
• A double downtrend is formed when the current peak price is lower than the preceding peak price and the current trough price is lower than the preceding trough price.
Muti-Part Double Trends
• A multi-part double uptrend begins with the formation of a new uptrend that proceeds a new return line uptrend, and continues until a new downtrend or return line downtrend ends the trend.
• A multi-part double downtrend begins with the formation of a new downtrend that proceeds a new return line downtrend, and continues until a new uptrend or return line uptrend ends the trend.
Wave Cycles
A wave cycle is here defined as a complete two-part move between a swing high and a swing low, or a swing low and a swing high. The first swing high or swing low will set the course for the sequence of wave cycles that follow; for example a chart that begins with a swing low will form its first complete wave cycle upon the formation of the first complete swing high and vice versa.
Figure 1.
Retracement and Extension Ratios
Retracement and extension ratios are calculated by dividing the current range by the preceding range and multiplying the answer by 100. Retracement ratios are those that are equal to or below 100% of the preceding range and extension ratios are those that are above 100% of the preceding range.
Fibonacci Retracement and Extension Ratios
The Fibonacci sequence is a series of numbers in which each number is the sum of the two preceding numbers, starting with 0 and 1. For example 0 + 1 = 1, 1 + 1 = 2, 1 + 2 = 3, and so on. Ultimately, we could go on forever but the first few numbers in the sequence are as follows: 0 , 1, 1, 2, 3, 5, 8, 13, 21, 34, 55, 89, 144.
The extension ratios are calculated by dividing each number in the sequence by the number preceding it. For example 0/1 = 0, 1/1 = 1, 2/1 = 2, 3/2 = 1.5, 5/3 = 1.6666..., 8/5 = 1.6, 13/8 = 1.625, 21/13 = 1.6153..., 34/21 = 1.6190..., 55/34 = 1.6176..., 89/55 = 1.6181..., 144/89 = 1.6179..., and so on. The retracement ratios are calculated by inverting this process and dividing each number in the sequence by the number proceeding it. For example 0/1 = 0, 1/1 = 1, 1/2 = 0.5, 2/3 = 0.666..., 3/5 = 0.6, 5/8 = 0.625, 8/13 = 0.6153..., 13/21 = 0.6190..., 21/34 = 0.6176..., 34/55 = 0.6181..., 55/89 = 0.6179..., 89/144 = 0.6180..., and so on.
1.618 is considered to be the 'golden ratio', found in many natural phenomena such as the growth of seashells and the branching of trees. Some now speculate the universe oscillates at a frequency of 0,618 Hz, which could help to explain such phenomena, but this theory has yet to be proven.
Traders and analysts use Fibonacci retracement and extension indicators, consisting of horizontal lines representing different Fibonacci ratios, for identifying potential levels of support and resistance. Fibonacci ranges are typically drawn from left to right, with retracement levels representing ratios inside of the current range and extension levels representing ratios extended outside of the current range. If the current wave cycle ends on a swing low, the Fibonacci range is drawn from peak to trough. If the current wave cycle ends on a swing high the Fibonacci range is drawn from trough to peak.
Harmonic Patterns
The concept of harmonic patterns in trading was first introduced by H.M. Gartley in his book "Profits in the Stock Market", published in 1935. Gartley observed that markets have a tendency to move in repetitive patterns, and he identified several specific patterns that he believed could be used to predict future price movements.
Since then, many other traders and analysts have built upon Gartley's work and developed their own variations of harmonic patterns. One such contributor is Larry Pesavento, who developed his own methods for measuring harmonic patterns using Fibonacci ratios. Pesavento has written several books on the subject of harmonic patterns and Fibonacci ratios in trading. Another notable contributor to harmonic patterns is Scott Carney, who developed his own approach to harmonic trading in the late 1990s and also popularised the use of Fibonacci ratios to measure harmonic patterns. Carney expanded on Gartley's work and also introduced several new harmonic patterns, such as the Shark pattern and the 5-0 pattern.
The bullish and bearish Gartley patterns are the oldest recognized harmonic patterns in trading and all the other harmonic patterns are ultimately modifications of the original Gartley patterns. Gartley patterns are fundamentally composed of 5 points, or 4 waves.
Bullish and Bearish Cassiopeia B Harmonic Patterns
• Bullish Cassiopeia B patterns are fundamentally composed of three troughs and two peaks. The second peak being lower than the first peak. And the third trough being lower than both the first and second troughs, while the second trough is also lower than the first.
• Bearish Cassiopeia B patterns are fundamentally composed of three peaks and two troughs. The second trough being higher than the first trough. And the third peak being higher than both the first and second peaks, while the second peak is also higher than the first.
The ratio measurements I use to detect the patterns are as follows:
• Wave 1 of the pattern, generally referred to as XA, has no specific ratio requirements.
• Wave 2 of the pattern, generally referred to as AB, should retrace by at least 11.34%, but no further than 22.31% of the range set by wave 1.
• Wave 3 of the pattern, generally referred to as BC, should extend by at least 225.7%, but no further than 341% of the range set by wave 2.
• Wave 4 of the pattern, generally referred to as CD, should retrace by at least 77.69%, but no further than 88.66% of the range set by wave 3.
Measurement Tolerances
In general, tolerance in measurements refers to the allowable variation or deviation from a specific value or dimension. It is the range within which a particular measurement is considered to be acceptable or accurate. In this script I have applied this concept to the measurement of harmonic pattern ratios to increase to the frequency of pattern occurrences.
For example, the AB measurement of Gartley patterns is generally set at around 61.8%, but with such specificity in the measuring requirements the patterns are very rare. We can increase the frequency of pattern occurrences by setting a tolerance. A tolerance of 10% to both downside and upside, which is the default setting for all tolerances, means we would have a tolerable measurement range between 51.8-71.8%, thus increasing the frequency of occurrence.
█ FEATURES
Inputs
• AB Lower Tolerance
• AB Upper Tolerance
• BC Lower Tolerance
• BC Upper Tolerance
• CD Lower Tolerance
• CD Upper Tolerance
• Pattern Color
• Label Color
• Show Projections
• Extend Current Projection Lines
Alerts
Users can set alerts for when the patterns occur.
█ LIMITATIONS
All green and red candle calculations are based on differences between open and close prices, as such I have made no attempt to account for green candles that gap lower and close below the close price of the preceding candle, or red candles that gap higher and close above the close price of the preceding candle. This may cause some unexpected behaviour on some markets and timeframes. I can only recommend using 24-hour markets, if and where possible, as there are far fewer gaps and, generally, more data to work with.
█ NOTES
I know a few people have been requesting a single indicator that contains all my patterns and I definitely hear you on that one. However, I have been very busy working on other projects while trying to trade and be a human at the same time. For now I am going to maintain my original approach of releasing each pattern individually so as to maintain consistency. But I am now also working on getting my some of my libraries ready for public release and in doing so I will finally be able to fit all patterns into one script. I will also be giving my scripts some TLC by making them cleaner once I have the libraries up and running. Please bear with me in the meantime, this may take a while. Cheers!

Bullish Cassiopeia B Harmonic Patterns [theEccentricTrader]█ OVERVIEW
This indicator automatically detects and draws bullish Cassiopeia B harmonic patterns and price projections derived from the ranges that constitute the patterns.
Cassiopeia A, B and C harmonic patterns are patterns that I created/discovered myself. They are all inspired by the Cassiopeia constellation and each one is based on different rotations of the constellation as it moves through the sky. The range ratios are also based on the constellation's right ascension and declination listed on Wikipedia:
Right ascension 22h 57m 04.5897s–03h 41m 14.0997s
Declination 77.6923447°–48.6632690°
en.wikipedia.org
I actually developed this idea quite a while ago now but have not felt audacious enough to introduce a new harmonic pattern, let alone 3 at the same time! But I have since been able to run backtests on tick data going back to 2002 across a variety of market and timeframe combinations and have learned that the Cassiopeia patterns can certainly hold their own against the currently known harmonic patterns.
I would also point out that the Cassiopeia constellation does actually look like a harmonic pattern and the Cassiopeia A star is literally the 'strongest source of radio emission in the sky beyond the solar system', so its arguably more of a real harmonic phenomenon than the current patterns.
www.britannica.com
chandra.si.edu
█ CONCEPTS
Green and Red Candles
• A green candle is one that closes with a close price equal to or above the price it opened.
• A red candle is one that closes with a close price that is lower than the price it opened.
Swing Highs and Swing Lows
• A swing high is a green candle or series of consecutive green candles followed by a single red candle to complete the swing and form the peak.
• A swing low is a red candle or series of consecutive red candles followed by a single green candle to complete the swing and form the trough.
Peak and Trough Prices (Basic)
• The peak price of a complete swing high is the high price of either the red candle that completes the swing high or the high price of the preceding green candle, depending on which is higher.
• The trough price of a complete swing low is the low price of either the green candle that completes the swing low or the low price of the preceding red candle, depending on which is lower.
Historic Peaks and Troughs
The current, or most recent, peak and trough occurrences are referred to as occurrence zero. Previous peak and trough occurrences are referred to as historic and ordered numerically from right to left, with the most recent historic peak and trough occurrences being occurrence one.
Range
The range is simply the difference between the current peak and current trough prices, generally expressed in terms of points or pips.
Upper Trends
• A return line uptrend is formed when the current peak price is higher than the preceding peak price.
• A downtrend is formed when the current peak price is lower than the preceding peak price.
• A double-top is formed when the current peak price is equal to the preceding peak price.
Lower Trends
• An uptrend is formed when the current trough price is higher than the preceding trough price.
• A return line downtrend is formed when the current trough price is lower than the preceding trough price.
• A double-bottom is formed when the current trough price is equal to the preceding trough price.
Muti-Part Upper and Lower Trends
• A multi-part return line uptrend begins with the formation of a new return line uptrend and continues until a new downtrend ends the trend.
• A multi-part downtrend begins with the formation of a new downtrend and continues until a new return line uptrend ends the trend.
• A multi-part uptrend begins with the formation of a new uptrend and continues until a new return line downtrend ends the trend.
• A multi-part return line downtrend begins with the formation of a new return line downtrend and continues until a new uptrend ends the trend.
Double Trends
• A double uptrend is formed when the current trough price is higher than the preceding trough price and the current peak price is higher than the preceding peak price.
• A double downtrend is formed when the current peak price is lower than the preceding peak price and the current trough price is lower than the preceding trough price.
Muti-Part Double Trends
• A multi-part double uptrend begins with the formation of a new uptrend that proceeds a new return line uptrend, and continues until a new downtrend or return line downtrend ends the trend.
• A multi-part double downtrend begins with the formation of a new downtrend that proceeds a new return line downtrend, and continues until a new uptrend or return line uptrend ends the trend.
Wave Cycles
A wave cycle is here defined as a complete two-part move between a swing high and a swing low, or a swing low and a swing high. The first swing high or swing low will set the course for the sequence of wave cycles that follow; for example a chart that begins with a swing low will form its first complete wave cycle upon the formation of the first complete swing high and vice versa.
Figure 1.
Retracement and Extension Ratios
Retracement and extension ratios are calculated by dividing the current range by the preceding range and multiplying the answer by 100. Retracement ratios are those that are equal to or below 100% of the preceding range and extension ratios are those that are above 100% of the preceding range.
Fibonacci Retracement and Extension Ratios
The Fibonacci sequence is a series of numbers in which each number is the sum of the two preceding numbers, starting with 0 and 1. For example 0 + 1 = 1, 1 + 1 = 2, 1 + 2 = 3, and so on. Ultimately, we could go on forever but the first few numbers in the sequence are as follows: 0 , 1, 1, 2, 3, 5, 8, 13, 21, 34, 55, 89, 144.
The extension ratios are calculated by dividing each number in the sequence by the number preceding it. For example 0/1 = 0, 1/1 = 1, 2/1 = 2, 3/2 = 1.5, 5/3 = 1.6666..., 8/5 = 1.6, 13/8 = 1.625, 21/13 = 1.6153..., 34/21 = 1.6190..., 55/34 = 1.6176..., 89/55 = 1.6181..., 144/89 = 1.6179..., and so on. The retracement ratios are calculated by inverting this process and dividing each number in the sequence by the number proceeding it. For example 0/1 = 0, 1/1 = 1, 1/2 = 0.5, 2/3 = 0.666..., 3/5 = 0.6, 5/8 = 0.625, 8/13 = 0.6153..., 13/21 = 0.6190..., 21/34 = 0.6176..., 34/55 = 0.6181..., 55/89 = 0.6179..., 89/144 = 0.6180..., and so on.
1.618 is considered to be the 'golden ratio', found in many natural phenomena such as the growth of seashells and the branching of trees. Some now speculate the universe oscillates at a frequency of 0,618 Hz, which could help to explain such phenomena, but this theory has yet to be proven.
Traders and analysts use Fibonacci retracement and extension indicators, consisting of horizontal lines representing different Fibonacci ratios, for identifying potential levels of support and resistance. Fibonacci ranges are typically drawn from left to right, with retracement levels representing ratios inside of the current range and extension levels representing ratios extended outside of the current range. If the current wave cycle ends on a swing low, the Fibonacci range is drawn from peak to trough. If the current wave cycle ends on a swing high the Fibonacci range is drawn from trough to peak.
Harmonic Patterns
The concept of harmonic patterns in trading was first introduced by H.M. Gartley in his book "Profits in the Stock Market", published in 1935. Gartley observed that markets have a tendency to move in repetitive patterns, and he identified several specific patterns that he believed could be used to predict future price movements.
Since then, many other traders and analysts have built upon Gartley's work and developed their own variations of harmonic patterns. One such contributor is Larry Pesavento, who developed his own methods for measuring harmonic patterns using Fibonacci ratios. Pesavento has written several books on the subject of harmonic patterns and Fibonacci ratios in trading. Another notable contributor to harmonic patterns is Scott Carney, who developed his own approach to harmonic trading in the late 1990s and also popularised the use of Fibonacci ratios to measure harmonic patterns. Carney expanded on Gartley's work and also introduced several new harmonic patterns, such as the Shark pattern and the 5-0 pattern.
The bullish and bearish Gartley patterns are the oldest recognized harmonic patterns in trading and all the other harmonic patterns are ultimately modifications of the original Gartley patterns. Gartley patterns are fundamentally composed of 5 points, or 4 waves.
Bullish and Bearish Cassiopeia B Harmonic Patterns
• Bullish Cassiopeia B patterns are fundamentally composed of three troughs and two peaks. The second peak being lower than the first peak. And the third trough being lower than both the first and second troughs, while the second trough is also lower than the first.
• Bearish Cassiopeia B patterns are fundamentally composed of three peaks and two troughs. The second trough being higher than the first trough. And the third peak being higher than both the first and second peaks, while the second peak is also higher than the first.
The ratio measurements I use to detect the patterns are as follows:
• Wave 1 of the pattern, generally referred to as XA, has no specific ratio requirements.
• Wave 2 of the pattern, generally referred to as AB, should retrace by at least 11.34%, but no further than 22.31% of the range set by wave 1.
• Wave 3 of the pattern, generally referred to as BC, should extend by at least 225.7%, but no further than 341% of the range set by wave 2.
• Wave 4 of the pattern, generally referred to as CD, should retrace by at least 77.69%, but no further than 88.66% of the range set by wave 3.
Measurement Tolerances
In general, tolerance in measurements refers to the allowable variation or deviation from a specific value or dimension. It is the range within which a particular measurement is considered to be acceptable or accurate. In this script I have applied this concept to the measurement of harmonic pattern ratios to increase to the frequency of pattern occurrences.
For example, the AB measurement of Gartley patterns is generally set at around 61.8%, but with such specificity in the measuring requirements the patterns are very rare. We can increase the frequency of pattern occurrences by setting a tolerance. A tolerance of 10% to both downside and upside, which is the default setting for all tolerances, means we would have a tolerable measurement range between 51.8-71.8%, thus increasing the frequency of occurrence.
█ FEATURES
Inputs
• AB Lower Tolerance
• AB Upper Tolerance
• BC Lower Tolerance
• BC Upper Tolerance
• CD Lower Tolerance
• CD Upper Tolerance
• Pattern Color
• Label Color
• Show Projections
• Extend Current Projection Lines
Alerts
Users can set alerts for when the patterns occur.
█ LIMITATIONS
All green and red candle calculations are based on differences between open and close prices, as such I have made no attempt to account for green candles that gap lower and close below the close price of the preceding candle, or red candles that gap higher and close above the close price of the preceding candle. This may cause some unexpected behaviour on some markets and timeframes. I can only recommend using 24-hour markets, if and where possible, as there are far fewer gaps and, generally, more data to work with.
█ NOTES
I know a few people have been requesting a single indicator that contains all my patterns and I definitely hear you on that one. However, I have been very busy working on other projects while trying to trade and be a human at the same time. For now I am going to maintain my original approach of releasing each pattern individually so as to maintain consistency. But I am now also working on getting my some of my libraries ready for public release and in doing so I will finally be able to fit all patterns into one script. I will also be giving my scripts some TLC by making them cleaner once I have the libraries up and running. Please bear with me in the meantime, this may take a while. Cheers!
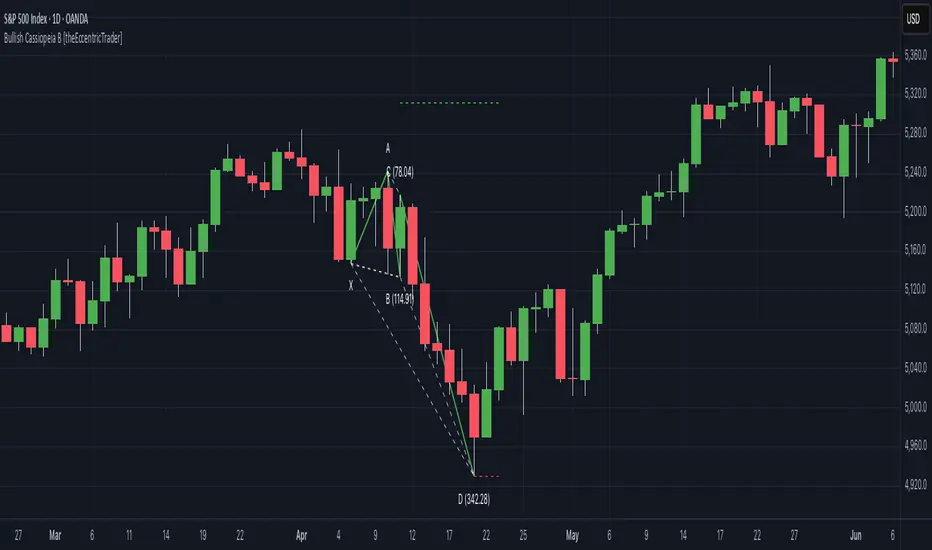
Bearish Cassiopeia A Harmonic Patterns [theEccentricTrader]█ OVERVIEW
This indicator automatically detects and draws bearish Cassiopeia A harmonic patterns and price projections derived from the ranges that constitute the patterns.
Cassiopeia A, B and C harmonic patterns are patterns that I created/discovered myself. They are all inspired by the Cassiopeia constellation and each one is based on different rotations of the constellation as it moves through the sky. The range ratios are also based on the constellation's right ascension and declination listed on Wikipedia:
Right ascension 22h 57m 04.5897s–03h 41m 14.0997s
Declination 77.6923447°–48.6632690°
en.wikipedia.org
I actually developed this idea quite a while ago now but have not felt audacious enough to introduce a new harmonic pattern, let alone 3 at the same time! But I have since been able to run backtests on tick data going back to 2002 across a variety of market and timeframe combinations and have learned that the Cassiopeia patterns can certainly hold their own against the currently known harmonic patterns.
I would also point out that the Cassiopeia constellation does actually look like a harmonic pattern and the Cassiopeia A star is literally the 'strongest source of radio emission in the sky beyond the solar system', so its arguably more of a real harmonic phenomenon than the current patterns.
www.britannica.com
chandra.si.edu
█ CONCEPTS
Green and Red Candles
• A green candle is one that closes with a close price equal to or above the price it opened.
• A red candle is one that closes with a close price that is lower than the price it opened.
Swing Highs and Swing Lows
• A swing high is a green candle or series of consecutive green candles followed by a single red candle to complete the swing and form the peak.
• A swing low is a red candle or series of consecutive red candles followed by a single green candle to complete the swing and form the trough.
Peak and Trough Prices (Basic)
• The peak price of a complete swing high is the high price of either the red candle that completes the swing high or the high price of the preceding green candle, depending on which is higher.
• The trough price of a complete swing low is the low price of either the green candle that completes the swing low or the low price of the preceding red candle, depending on which is lower.
Historic Peaks and Troughs
The current, or most recent, peak and trough occurrences are referred to as occurrence zero. Previous peak and trough occurrences are referred to as historic and ordered numerically from right to left, with the most recent historic peak and trough occurrences being occurrence one.
Range
The range is simply the difference between the current peak and current trough prices, generally expressed in terms of points or pips.
Upper Trends
• A return line uptrend is formed when the current peak price is higher than the preceding peak price.
• A downtrend is formed when the current peak price is lower than the preceding peak price.
• A double-top is formed when the current peak price is equal to the preceding peak price.
Lower Trends
• An uptrend is formed when the current trough price is higher than the preceding trough price.
• A return line downtrend is formed when the current trough price is lower than the preceding trough price.
• A double-bottom is formed when the current trough price is equal to the preceding trough price.
Muti-Part Upper and Lower Trends
• A multi-part return line uptrend begins with the formation of a new return line uptrend and continues until a new downtrend ends the trend.
• A multi-part downtrend begins with the formation of a new downtrend and continues until a new return line uptrend ends the trend.
• A multi-part uptrend begins with the formation of a new uptrend and continues until a new return line downtrend ends the trend.
• A multi-part return line downtrend begins with the formation of a new return line downtrend and continues until a new uptrend ends the trend.
Double Trends
• A double uptrend is formed when the current trough price is higher than the preceding trough price and the current peak price is higher than the preceding peak price.
• A double downtrend is formed when the current peak price is lower than the preceding peak price and the current trough price is lower than the preceding trough price.
Muti-Part Double Trends
• A multi-part double uptrend begins with the formation of a new uptrend that proceeds a new return line uptrend, and continues until a new downtrend or return line downtrend ends the trend.
• A multi-part double downtrend begins with the formation of a new downtrend that proceeds a new return line downtrend, and continues until a new uptrend or return line uptrend ends the trend.
Wave Cycles
A wave cycle is here defined as a complete two-part move between a swing high and a swing low, or a swing low and a swing high. The first swing high or swing low will set the course for the sequence of wave cycles that follow; for example a chart that begins with a swing low will form its first complete wave cycle upon the formation of the first complete swing high and vice versa.
Figure 1.
Retracement and Extension Ratios
Retracement and extension ratios are calculated by dividing the current range by the preceding range and multiplying the answer by 100. Retracement ratios are those that are equal to or below 100% of the preceding range and extension ratios are those that are above 100% of the preceding range.
Fibonacci Retracement and Extension Ratios
The Fibonacci sequence is a series of numbers in which each number is the sum of the two preceding numbers, starting with 0 and 1. For example 0 + 1 = 1, 1 + 1 = 2, 1 + 2 = 3, and so on. Ultimately, we could go on forever but the first few numbers in the sequence are as follows: 0 , 1, 1, 2, 3, 5, 8, 13, 21, 34, 55, 89, 144.
The extension ratios are calculated by dividing each number in the sequence by the number preceding it. For example 0/1 = 0, 1/1 = 1, 2/1 = 2, 3/2 = 1.5, 5/3 = 1.6666..., 8/5 = 1.6, 13/8 = 1.625, 21/13 = 1.6153..., 34/21 = 1.6190..., 55/34 = 1.6176..., 89/55 = 1.6181..., 144/89 = 1.6179..., and so on. The retracement ratios are calculated by inverting this process and dividing each number in the sequence by the number proceeding it. For example 0/1 = 0, 1/1 = 1, 1/2 = 0.5, 2/3 = 0.666..., 3/5 = 0.6, 5/8 = 0.625, 8/13 = 0.6153..., 13/21 = 0.6190..., 21/34 = 0.6176..., 34/55 = 0.6181..., 55/89 = 0.6179..., 89/144 = 0.6180..., and so on.
1.618 is considered to be the 'golden ratio', found in many natural phenomena such as the growth of seashells and the branching of trees. Some now speculate the universe oscillates at a frequency of 0,618 Hz, which could help to explain such phenomena, but this theory has yet to be proven.
Traders and analysts use Fibonacci retracement and extension indicators, consisting of horizontal lines representing different Fibonacci ratios, for identifying potential levels of support and resistance. Fibonacci ranges are typically drawn from left to right, with retracement levels representing ratios inside of the current range and extension levels representing ratios extended outside of the current range. If the current wave cycle ends on a swing low, the Fibonacci range is drawn from peak to trough. If the current wave cycle ends on a swing high the Fibonacci range is drawn from trough to peak.
Harmonic Patterns
The concept of harmonic patterns in trading was first introduced by H.M. Gartley in his book "Profits in the Stock Market", published in 1935. Gartley observed that markets have a tendency to move in repetitive patterns, and he identified several specific patterns that he believed could be used to predict future price movements.
Since then, many other traders and analysts have built upon Gartley's work and developed their own variations of harmonic patterns. One such contributor is Larry Pesavento, who developed his own methods for measuring harmonic patterns using Fibonacci ratios. Pesavento has written several books on the subject of harmonic patterns and Fibonacci ratios in trading. Another notable contributor to harmonic patterns is Scott Carney, who developed his own approach to harmonic trading in the late 1990s and also popularised the use of Fibonacci ratios to measure harmonic patterns. Carney expanded on Gartley's work and also introduced several new harmonic patterns, such as the Shark pattern and the 5-0 pattern.
The bullish and bearish Gartley patterns are the oldest recognized harmonic patterns in trading and all the other harmonic patterns are ultimately modifications of the original Gartley patterns. Gartley patterns are fundamentally composed of 5 points, or 4 waves.
Bullish and Bearish Cassiopeia A Harmonic Patterns
• Bullish Cassiopeia A patterns are fundamentally composed of three troughs and two peaks. The second peak being higher than the first peak. And the third trough being higher than both the first and second troughs, while the second trough is also higher than the first.
• Bearish Cassiopeia A patterns are fundamentally composed of three peaks and two troughs. The second trough being lower than the first trough. And the third peak being lower than both the first and second peaks, while the second peak is also lower than the first.
The ratio measurements I use to detect the patterns are as follows:
• Wave 1 of the pattern, generally referred to as XA, has no specific ratio requirements.
• Wave 2 of the pattern, generally referred to as AB, should retrace by at least 11.34%, but no further than 22.31% of the range set by wave 1.
• Wave 3 of the pattern, generally referred to as BC, should extend by at least 225.7%, but no further than 341% of the range set by wave 2.
• Wave 4 of the pattern, generally referred to as CD, should retrace by at least 77.69%, but no further than 88.66% of the range set by wave 3.
Measurement Tolerances
In general, tolerance in measurements refers to the allowable variation or deviation from a specific value or dimension. It is the range within which a particular measurement is considered to be acceptable or accurate. In this script I have applied this concept to the measurement of harmonic pattern ratios to increase to the frequency of pattern occurrences.
For example, the AB measurement of Gartley patterns is generally set at around 61.8%, but with such specificity in the measuring requirements the patterns are very rare. We can increase the frequency of pattern occurrences by setting a tolerance. A tolerance of 10% to both downside and upside, which is the default setting for all tolerances, means we would have a tolerable measurement range between 51.8-71.8%, thus increasing the frequency of occurrence.
█ FEATURES
Inputs
• AB Lower Tolerance
• AB Upper Tolerance
• BC Lower Tolerance
• BC Upper Tolerance
• CD Lower Tolerance
• CD Upper Tolerance
• Pattern Color
• Label Color
• Show Projections
• Extend Current Projection Lines
Alerts
Users can set alerts for when the patterns occur.
█ LIMITATIONS
All green and red candle calculations are based on differences between open and close prices, as such I have made no attempt to account for green candles that gap lower and close below the close price of the preceding candle, or red candles that gap higher and close above the close price of the preceding candle. This may cause some unexpected behaviour on some markets and timeframes. I can only recommend using 24-hour markets, if and where possible, as there are far fewer gaps and, generally, more data to work with.
█ NOTES
I know a few people have been requesting a single indicator that contains all my patterns and I definitely hear you on that one. However, I have been very busy working on other projects while trying to trade and be a human at the same time. For now I am going to maintain my original approach of releasing each pattern individually so as to maintain consistency. But I am now also working on getting my some of my libraries ready for public release and in doing so I will finally be able to fit all patterns into one script. I will also be giving my scripts some TLC by making them cleaner once I have the libraries up and running. Please bear with me in the meantime, this may take a while. Cheers!
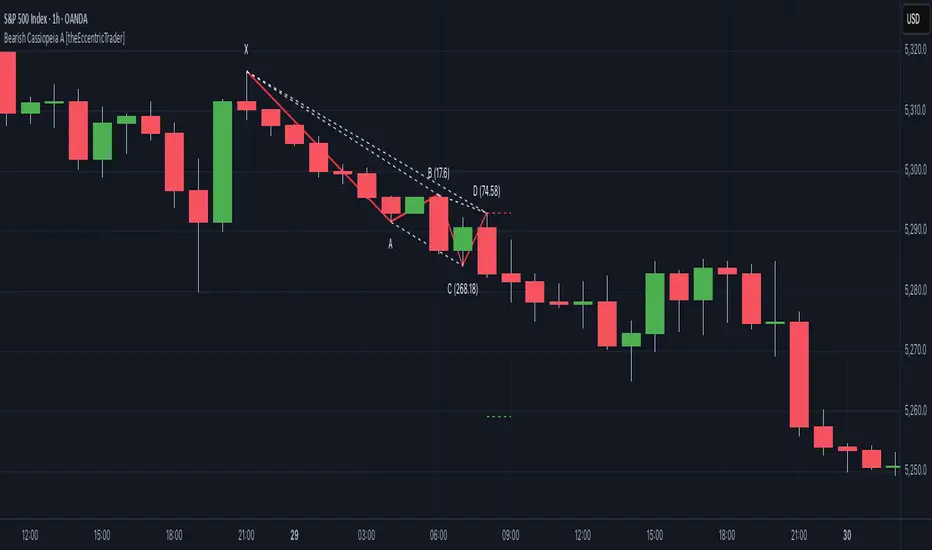
Bullish Cassiopeia A Harmonic Patterns [theEccentricTrader]█ OVERVIEW
This indicator automatically detects and draws bullish Cassiopeia A harmonic patterns and price projections derived from the ranges that constitute the patterns.
Cassiopeia A, B and C harmonic patterns are patterns that I created/discovered myself. They are all inspired by the Cassiopeia constellation and each one is based on different rotations of the constellation as it moves through the sky. The range ratios are also based on the constellation's right ascension and declination listed on Wikipedia:
Right ascension 22h 57m 04.5897s–03h 41m 14.0997s
Declination 77.6923447°–48.6632690°
en.wikipedia.org
I actually developed this idea quite a while ago now but have not felt audacious enough to introduce a new harmonic pattern, let alone 3 at the same time! But I have since been able to run backtests on tick data going back to 2002 across a variety of market and timeframe combinations and have learned that the Cassiopeia patterns can certainly hold their own against the currently known harmonic patterns. As can be seen in the picture above the bullish Cassiopeia A caught the 2009 bear market bottom almost perfectly.
I would also point out that the Cassiopeia constellation does actually look like a harmonic pattern and the Cassiopeia A star is literally the 'strongest source of radio emission in the sky beyond the solar system', so its arguably more of a real harmonic phenomenon than the current patterns.
www.britannica.com
chandra.si.edu
█ CONCEPTS
Green and Red Candles
• A green candle is one that closes with a close price equal to or above the price it opened.
• A red candle is one that closes with a close price that is lower than the price it opened.
Swing Highs and Swing Lows
• A swing high is a green candle or series of consecutive green candles followed by a single red candle to complete the swing and form the peak.
• A swing low is a red candle or series of consecutive red candles followed by a single green candle to complete the swing and form the trough.
Peak and Trough Prices (Basic)
• The peak price of a complete swing high is the high price of either the red candle that completes the swing high or the high price of the preceding green candle, depending on which is higher.
• The trough price of a complete swing low is the low price of either the green candle that completes the swing low or the low price of the preceding red candle, depending on which is lower.
Historic Peaks and Troughs
The current, or most recent, peak and trough occurrences are referred to as occurrence zero. Previous peak and trough occurrences are referred to as historic and ordered numerically from right to left, with the most recent historic peak and trough occurrences being occurrence one.
Range
The range is simply the difference between the current peak and current trough prices, generally expressed in terms of points or pips.
Upper Trends
• A return line uptrend is formed when the current peak price is higher than the preceding peak price.
• A downtrend is formed when the current peak price is lower than the preceding peak price.
• A double-top is formed when the current peak price is equal to the preceding peak price.
Lower Trends
• An uptrend is formed when the current trough price is higher than the preceding trough price.
• A return line downtrend is formed when the current trough price is lower than the preceding trough price.
• A double-bottom is formed when the current trough price is equal to the preceding trough price.
Muti-Part Upper and Lower Trends
• A multi-part return line uptrend begins with the formation of a new return line uptrend and continues until a new downtrend ends the trend.
• A multi-part downtrend begins with the formation of a new downtrend and continues until a new return line uptrend ends the trend.
• A multi-part uptrend begins with the formation of a new uptrend and continues until a new return line downtrend ends the trend.
• A multi-part return line downtrend begins with the formation of a new return line downtrend and continues until a new uptrend ends the trend.
Double Trends
• A double uptrend is formed when the current trough price is higher than the preceding trough price and the current peak price is higher than the preceding peak price.
• A double downtrend is formed when the current peak price is lower than the preceding peak price and the current trough price is lower than the preceding trough price.
Muti-Part Double Trends
• A multi-part double uptrend begins with the formation of a new uptrend that proceeds a new return line uptrend, and continues until a new downtrend or return line downtrend ends the trend.
• A multi-part double downtrend begins with the formation of a new downtrend that proceeds a new return line downtrend, and continues until a new uptrend or return line uptrend ends the trend.
Wave Cycles
A wave cycle is here defined as a complete two-part move between a swing high and a swing low, or a swing low and a swing high. The first swing high or swing low will set the course for the sequence of wave cycles that follow; for example a chart that begins with a swing low will form its first complete wave cycle upon the formation of the first complete swing high and vice versa.
Figure 1.
Retracement and Extension Ratios
Retracement and extension ratios are calculated by dividing the current range by the preceding range and multiplying the answer by 100. Retracement ratios are those that are equal to or below 100% of the preceding range and extension ratios are those that are above 100% of the preceding range.
Fibonacci Retracement and Extension Ratios
The Fibonacci sequence is a series of numbers in which each number is the sum of the two preceding numbers, starting with 0 and 1. For example 0 + 1 = 1, 1 + 1 = 2, 1 + 2 = 3, and so on. Ultimately, we could go on forever but the first few numbers in the sequence are as follows: 0 , 1, 1, 2, 3, 5, 8, 13, 21, 34, 55, 89, 144.
The extension ratios are calculated by dividing each number in the sequence by the number preceding it. For example 0/1 = 0, 1/1 = 1, 2/1 = 2, 3/2 = 1.5, 5/3 = 1.6666..., 8/5 = 1.6, 13/8 = 1.625, 21/13 = 1.6153..., 34/21 = 1.6190..., 55/34 = 1.6176..., 89/55 = 1.6181..., 144/89 = 1.6179..., and so on. The retracement ratios are calculated by inverting this process and dividing each number in the sequence by the number proceeding it. For example 0/1 = 0, 1/1 = 1, 1/2 = 0.5, 2/3 = 0.666..., 3/5 = 0.6, 5/8 = 0.625, 8/13 = 0.6153..., 13/21 = 0.6190..., 21/34 = 0.6176..., 34/55 = 0.6181..., 55/89 = 0.6179..., 89/144 = 0.6180..., and so on.
1.618 is considered to be the 'golden ratio', found in many natural phenomena such as the growth of seashells and the branching of trees. Some now speculate the universe oscillates at a frequency of 0,618 Hz, which could help to explain such phenomena, but this theory has yet to be proven.
Traders and analysts use Fibonacci retracement and extension indicators, consisting of horizontal lines representing different Fibonacci ratios, for identifying potential levels of support and resistance. Fibonacci ranges are typically drawn from left to right, with retracement levels representing ratios inside of the current range and extension levels representing ratios extended outside of the current range. If the current wave cycle ends on a swing low, the Fibonacci range is drawn from peak to trough. If the current wave cycle ends on a swing high the Fibonacci range is drawn from trough to peak.
Harmonic Patterns
The concept of harmonic patterns in trading was first introduced by H.M. Gartley in his book "Profits in the Stock Market", published in 1935. Gartley observed that markets have a tendency to move in repetitive patterns, and he identified several specific patterns that he believed could be used to predict future price movements.
Since then, many other traders and analysts have built upon Gartley's work and developed their own variations of harmonic patterns. One such contributor is Larry Pesavento, who developed his own methods for measuring harmonic patterns using Fibonacci ratios. Pesavento has written several books on the subject of harmonic patterns and Fibonacci ratios in trading. Another notable contributor to harmonic patterns is Scott Carney, who developed his own approach to harmonic trading in the late 1990s and also popularised the use of Fibonacci ratios to measure harmonic patterns. Carney expanded on Gartley's work and also introduced several new harmonic patterns, such as the Shark pattern and the 5-0 pattern.
The bullish and bearish Gartley patterns are the oldest recognized harmonic patterns in trading and all the other harmonic patterns are ultimately modifications of the original Gartley patterns. Gartley patterns are fundamentally composed of 5 points, or 4 waves.
Bullish and Bearish Cassiopeia A Harmonic Patterns
• Bullish Cassiopeia A patterns are fundamentally composed of three troughs and two peaks. The second peak being higher than the first peak. And the third trough being higher than both the first and second troughs, while the second trough is also higher than the first.
• Bearish Cassiopeia A patterns are fundamentally composed of three peaks and two troughs. The second trough being lower than the first trough. And the third peak being lower than both the first and second peaks, while the second peak is also lower than the first.
The ratio measurements I use to detect the patterns are as follows:
• Wave 1 of the pattern, generally referred to as XA, has no specific ratio requirements.
• Wave 2 of the pattern, generally referred to as AB, should retrace by at least 11.34%, but no further than 22.31% of the range set by wave 1.
• Wave 3 of the pattern, generally referred to as BC, should extend by at least 225.7%, but no further than 341% of the range set by wave 2.
• Wave 4 of the pattern, generally referred to as CD, should retrace by at least 77.69%, but no further than 88.66% of the range set by wave 3.
Measurement Tolerances
In general, tolerance in measurements refers to the allowable variation or deviation from a specific value or dimension. It is the range within which a particular measurement is considered to be acceptable or accurate. In this script I have applied this concept to the measurement of harmonic pattern ratios to increase to the frequency of pattern occurrences.
For example, the AB measurement of Gartley patterns is generally set at around 61.8%, but with such specificity in the measuring requirements the patterns are very rare. We can increase the frequency of pattern occurrences by setting a tolerance. A tolerance of 10% to both downside and upside, which is the default setting for all tolerances, means we would have a tolerable measurement range between 51.8-71.8%, thus increasing the frequency of occurrence.
█ FEATURES
Inputs
• AB Lower Tolerance
• AB Upper Tolerance
• BC Lower Tolerance
• BC Upper Tolerance
• CD Lower Tolerance
• CD Upper Tolerance
• Pattern Color
• Label Color
• Show Projections
• Extend Current Projection Lines
Alerts
Users can set alerts for when the patterns occur.
█ LIMITATIONS
All green and red candle calculations are based on differences between open and close prices, as such I have made no attempt to account for green candles that gap lower and close below the close price of the preceding candle, or red candles that gap higher and close above the close price of the preceding candle. This may cause some unexpected behaviour on some markets and timeframes. I can only recommend using 24-hour markets, if and where possible, as there are far fewer gaps and, generally, more data to work with.
█ NOTES
I know a few people have been requesting a single indicator that contains all my patterns and I definitely hear you on that one. However, I have been very busy working on other projects while trying to trade and be a human at the same time. For now I am going to maintain my original approach of releasing each pattern individually so as to maintain consistency. But I am now also working on getting my some of my libraries ready for public release and in doing so I will finally be able to fit all patterns into one script. I will also be giving my scripts some TLC by making them cleaner once I have the libraries up and running. Please bear with me in the meantime, this may take a while. Cheers!
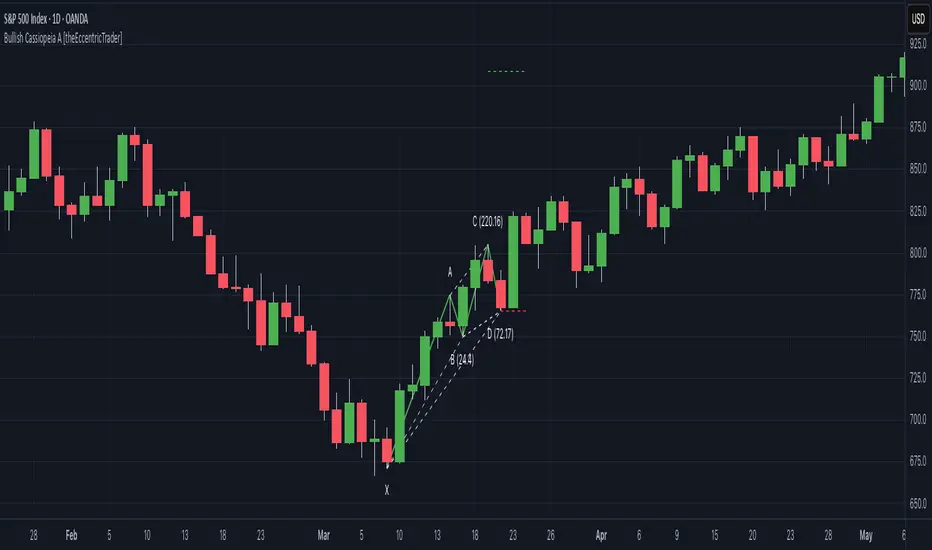
Buffett IndicatorThis is an open-source version of the Buffett indicator. The old version was code-protected and broken, so I created another version.
It's computed simply as the entire SPX 500 capitalization divided by the US GDP. Since TradingView does not have data for the SPX 500 capitalization, I used quarterly values of SPX devisors as a proxy.
I tried to create another version of the Buffett indicator for other countries/indexes, but I can't find the data. If you can help me find data for index divisors, I can add more choices to this indicator.
It's interesting to see how this indicator's behavior has changed in the last few years. Levels that looked crazy are not so crazy anymore.
Disclaimer
Please remember that past performance may not be indicative of future results.
Due to various factors, including changing market conditions, the strategy may no longer perform as well as in historical backtesting.
This post and the script don’t provide any financial advice.
