ابحث في النصوص البرمجية عن "bands"


Noro's Bands Strategy v1.0Recomended:
- H1 timeframe
- Any crypto ("BTC/USD", "XRP/BTC", "Govnocoin/Govnocoin")
- Period = 20
- Color = true
Backtests (default):
"BTC/USD", BitFinex, H1, strategy = profit +7.818%
"BTC/USD", BitFinex, H1, buy and hold = profit +662%
"ETH/USD", BitFinex, H1, strategy = profit +14.189%
"ETH/USD", BitFinex, H1, buy and hold = profit +9.239%
"XRP/USD, BitFinex, H1, strategy = profit +17.342%
"XRP/USD, BitFinex, H1, buy and hold = profit +124%
"ETH/BTC", BitFinex, H1, strategy = profit +7.842%
"ETH/BTC", BitFinex, H1, buy and hold = profit +998%
"XRP/BTC", BitFinex, H1, strategy = profit -23% 0
"XRP/BTC", BitFinex, H1, buy and hold = profit -41%

Exponential Bollinger Band StrategyExponential Bollinger Band strategy
Just Bollinger Bands crossover that is modified with EMA to generate more profit than previously possible. 10-15% performance gain over regular BBands.

Double Bollinger Bands StrategyDouble Bollinger Strategy. Price crosses inner BB (with increasing outer BB) long is placed. Long is closed when price closes below outer BB. Reversed for short. The numbers are tuned for NZDUSD 15min chart.
Pbin = percent on inner BB
Pbout = percent on outer BB
There are all kinds of other inputs, trailing stop, limit, etc.
Errors, questions, suggestions are wanted, thank you

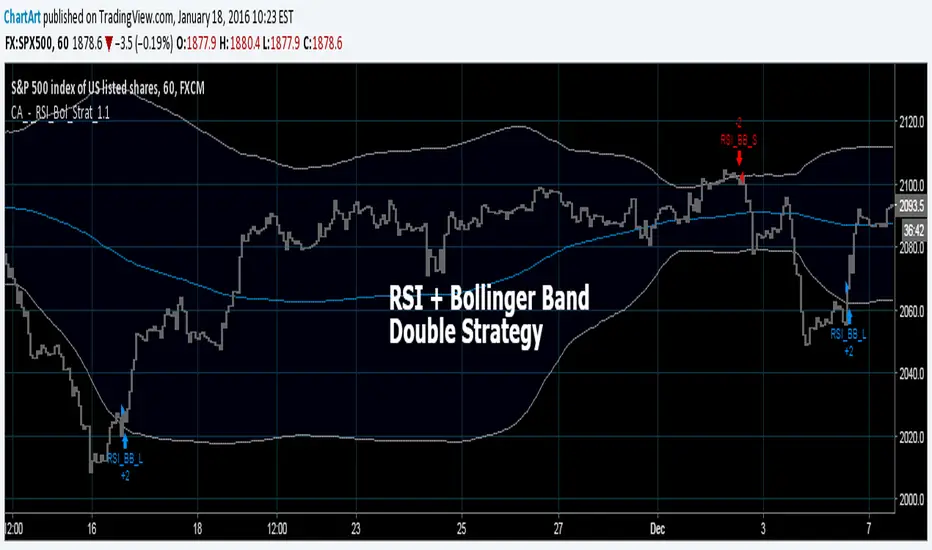
Bollinger + RSI, Double Strategy (by ChartArt) v1.1This strategy uses the RSI indicator together with the Bollinger Bands to sell when the price is above the upper Bollinger Band (and to buy when this value is below the lower band). This simple strategy only triggers when both the RSI and the Bollinger Band indicators are at the same time in a overbought or oversold condition.
UPDATE
In this updated version 1.1 the strategy was both simplified for the user (less inputs) and made more successful in backtesting by now using a 200 period for the SMA which is the basis for the Bollinger Band. I also reduced the number of color alerts to show fewer, but more relevant trading opportunities.
And just like the first version this strategy does not use close prices from higher-time frame and should not repaint after the current candle has closed. It might repaint like every Tradingview indicator while the current candle hasn't closed.
All trading involves high risk; past performance is not necessarily indicative of future results. Hypothetical or simulated performance results have certain inherent limitations. Unlike an actual performance record, simulated results do not represent actual trading. Also, since the trades have not actually been executed, the results may have under- or over-compensated for the impact, if any, of certain market factors, such as lack of liquidity. Simulated trading programs in general are also subject to the fact that they are designed with the benefit of hindsight. No representation is being made that any account will or is likely to achieve profits or losses similar to those shown.
P.S. For advanced users if you want access to more functions of this strategy script, then please use version 1.0: