BO - Bar's direction Signal - BacktestingBO - Bar's direction Signal - Backtesting Options:
A. Factors Calculate probability of x bars same direction
1. Periods Counting: Data to count From day/month/year To day/month/year
2. Trading Time: only cases occurred in trading time were counted.
B. Timezone
1. Trading time depend on Time zone and specified chart.
2. Enable Highlight Trading Time to check your period time is correct
C. Date Backtesting
* Only cases occurred in Date Backtesting were reported.
D. Setup Options & Rule
1. Reversal after 2 bars same direction
* Probability of 3 bars same direction < 50
* 2 bars same direction is start of series
2. Reversal after 3 bars same direction
* Probability of 4 bars same direction < 50
* 3 bars same direction is start of series
3. Reversal after 4 bars same direction
* Probability of 4 bars same direction < 50
* 3 bars same direction is start of series
4. Reversal after 5 bars same direction
* Probability of 5 bars same direction < 50
* 4 bars same direction is start of series
5. Reversal after 6 bars same direction
* Probability of 6 bars same direction < 50
* 5 bars same direction is start of series
ابحث في النصوص البرمجية عن "bar"

Volume Weighted Intra Bar LR CorrelationThis indicator analyzes market character by providing a detailed
view of correlation. It applies a Linear Regression model to
intra-bar price action, dissecting the total correlation of
each bar into three distinct components.
Key Features:
1. **Three-Component Correlation Decomposition:** The indicator
separates correlation based on the 'Estimate Bar Statistics' option.
- **Standard Mode (`Estimate Bar Statistics` = OFF):** Calculates
correlation based on the selected `Source` (this results
mainly in 'Trend' and 'Residual' correlation).
- **Decomposition Mode (`Estimate Bar Statistics` = ON):** The
indicator uses a statistical model ('Estimator') to
calculate *within-bar* correlation.
(Assumption: In this mode, the `Source` input is
**ignored**, and an estimated mean for each bar is used
instead).
This separates correlation into:
- **Trend Correlation (Green/Red):** Correlation explained by the
regression's slope (Directional Alignment).
- **Residual Correlation (Yellow):** Correlation from price
oscillating around the regression line (Mean-Reversion/Cointegration).
- **Within-Bar Correlation (Blue):** Correlation from the
high-low range of each bar (Microstructure/Noise).
2. **Visual Decomposition Logic:** Total Correlation is the
primary metric displayed. Since Correlation Coefficients are not
linearly additive, this indicator plots the *exact* Total
Correlation and partitions the area underneath based on the
Covariance Ratio. This ensures the displayed total correlation
remains mathematically accurate while showing relative composition.
3. **Dual Display Modes:** The indicator offers two modes to
visualize this decomposition:
- **Absolute Mode:** Displays the *total* correlation as a
stacked area chart, partitioned by the ratio of
the three components.
- **Relative Mode:** Displays the direct *energy ratio*
(proportion) of each component relative to the total (0-1),
ideal for identifying the dominant market character.
4. **Calculation Options:**
- **Normalization:** An optional 'Normalize' setting
calculates an **Exponential Regression Curve** (log-space),
making the analysis suitable for growth assets.
- **Volume Weighting:** An option (`Volume weighted`) applies
volume weighting to all regression and correlation calculations.
5. **Correlation Cycle Analysis:**
- **Pivot Detection:** Includes a built-in pivot detector
that identifies significant turning points (highs and lows) in
the *total* correlation line. (Note: This is only visible
in 'Absolute Mode').
- **Flexible Pivot Algorithms:** Supports various underlying
mathematical models for pivot detection provided by the
core library.
6. **Note on Confirmation (Lag):** Pivot signals are confirmed
using a lookback method. A pivot is only plotted *after*
the `Pivot Right Bars` input has passed, which introduces
an inherent lag.
7. **Multi-Timeframe (MTF) Capability:**
- **MTF Correlation Lines:** The correlation lines can be
calculated on a higher timeframe, with standard options
to handle gaps (`Fill Gaps`) and prevent repainting
(`Wait for...`).
- **Limitation:** The Pivot detection (`Calculate Pivots`) is
**disabled** if a Higher Timeframe (HTF) is selected.
8. **Integrated Alerts:** Includes comprehensive alerts for:
- Correlation magnitude (High Positive / High Inverse).
- Correlation character changes/emerging/fading.
- Total Correlation pivot (High/Low) detection.
**Caution! Real-Time Data Behavior (Intra-Bar Repainting)**
This indicator uses high-resolution intra-bar data. As a result, the
values on the **current, unclosed bar** (the real-time bar) will
update dynamically as new intra-bar data arrives. This behavior is
normal and necessary for this type of analysis. Signals should only
be considered final **after the main chart bar has closed.**
---
**DISCLAIMER**
1. **For Informational/Educational Use Only:** This indicator is
provided for informational and educational purposes only. It does
not constitute financial, investment, or trading advice, nor is
it a recommendation to buy or sell any asset.
2. **Use at Your Own Risk:** All trading decisions you make based on
the information or signals generated by this indicator are made
solely at your own risk.
3. **No Guarantee of Performance:** Past performance is not an
indicator of future results. The author makes no guarantee
regarding the accuracy of the signals or future profitability.
4. **No Liability:** The author shall not be held liable for any
financial losses or damages incurred directly or indirectly from
the use of this indicator.
5. **Signals Are Not Recommendations:** The alerts and visual signals
(e.g., crossovers) generated by this tool are not direct
recommendations to buy or sell. They are technical observations
for your own analysis and consideration.

Custom Step Bar CountHere is a professional description for your TradingView script, suitable for the "Description" field when publishing.
I have provided two versions: a **Standard Version** (detailed and professional) and a **Short Version** (concise).
### Option 1: Standard Version (Recommended for Publishing)
**Title:** Custom Step Bar Count
**Description:**
This indicator is an advanced bar counting tool designed for traders who need to track time cycles or specific bar sequences with custom arithmetic progressions. Unlike standard counters that simply display "1, 2, 3," this script allows you to decouple the **display frequency** from the **displayed value**.
The counter automatically resets at the beginning of every new trading day.
**Key Features:**
* **Custom Display Interval:** Choose how often a label appears (e.g., every 5 bars).
* **Custom Number Increment:** Define the value step for the displayed numbers (e.g., count by 3s).
* **Daily Reset:** The count restarts automatically at the beginning of each session.
* **Visual Customization:** Adjust label size and text color to fit your chart theme.
**How it works (Example):**
If you want to track a cycle where every **5th** bar represents a value of **3**:
1. Set **Display Every X Bars** to `5`.
2. Set **Number Increment** to `3`.
**Result:**
* Bar 5 shows label "**3**"
* Bar 10 shows label "**6**"
* Bar 15 shows label "**9**"
This is particularly useful for specific time-based strategies, Gann analysis, or backtesting setups that require non-linear counting.
---
### Option 2: Short Version (Concise)
**Title:** Custom Step Bar Count
**Description:**
A flexible bar counting utility that resets daily. This script allows you to customize both the frequency of the labels and the numeric step value.
**Settings:**
* **Display Every X Bars:** Controls the gap between labels (e.g., every 5th bar).
* **Number Increment:** Controls the number sequence (e.g., increments of 3).
**Example:**
With an interval of **5** and an increment of **3**, the script will display:
* 5th Bar: **3**
* 10th Bar: **6**
* 15th Bar: **9**
Includes options for text color and label size. Updated for Pine Script v6.

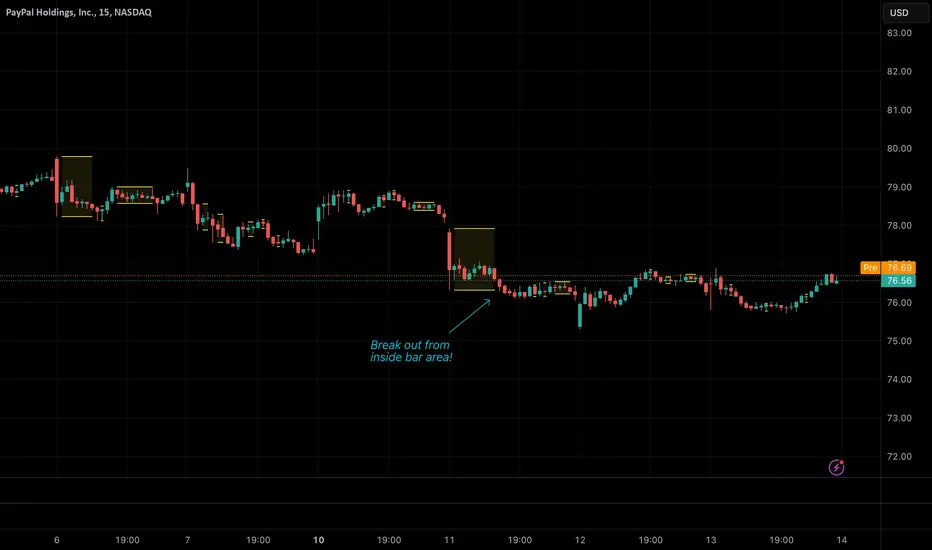
Inside Bar False Breakout (IBFB)The Inside Bar False Breakout (IBFB) is a price action tool that identifies high-probability reversal setups by detecting false breakouts from inside bar patterns. This strategy is widely used by traders to catch market traps and potential trend reversals.
What is an Inside Bar False Breakout?
An Inside Bar occurs when a candle's high and low are completely contained within the previous candle's range. A False Breakout happens when price initially breaks above or below this range but then closes back inside it, indicating a failed breakout and potential reversal.
How It Works
Step 1: Inside Bar Detection
Identifies candles where high < previous high AND low > previous low
Marks consolidation zones where market indecision occurs
Step 2: False Breakout Recognition
Bullish IBFB: Price breaks below the inside bar's low but closes back inside the range (bullish reversal signal)
Bearish IBFB: Price breaks above the inside bar's high but closes back inside the range (bearish reversal signal)
Step 3: Signal Confirmation
Applies a cooldown period (default 5 bars) to filter out noise and prevent signal clustering
Key Features
✅ Visual Signals
Color-coded bars (green for bullish, red for bearish IBFB)
Free-floating arrow markers (⬆ bullish, ⬇ bearish) without label boxes
Clean, minimalist design that doesn't clutter your chart
✅ Signal History Table
Displays the last 5 IBFB signals in real-time
Shows date/time, signal type, and price level
Color-coded for quick reference
✅ Customizable Settings
Enable/disable bullish or bearish signals independently
Adjustable cooldown period (1-100 bars) to control signal frequency
Customizable colors for both signal types
Toggle arrows and history table on/off
✅ Alert System
Built-in alert conditions for both bullish and bearish IBFB patterns
Fires once per bar close to avoid false alarms
Perfect for automated trading or notifications
✅ Universal Compatibility
Works on ANY timeframe (1m to 1M)
Lightweight and efficient - won't slow down your charts
No repainting - signals appear only on confirmed bar close
Best Use Cases
a.Scalping & Day Trading: Catch intraday reversals on lower timeframes (5m, 15m)
b.Swing Trading: Identify multi-day reversal patterns on higher timeframes (4H, D)
c.Trend Confirmation: Combine with trend indicators to filter trades in the direction of the main trend
d.Support/Resistance: Works exceptionally well near key S/R levels where false breakouts are common
Trading Tips
Confluence is Key: Combine IBFB signals with support/resistance zones, trendlines, or Fibonacci levels
Volume Matters: Look for decreasing volume on the false breakout for stronger confirmation
Risk Management: Place stop-loss just beyond the false breakout wick; target the opposite side of the inside bar range
Trend Alignment: Best results when trading in the direction of the higher timeframe trend
Cooldown Period: Increase the cooldown on lower timeframes to reduce noise; decrease on higher timeframes for more signals
Settings Explained
Signal Settings
Show Bullish/Bearish IBFB: Toggle each signal type independently
Cooldown Period: Minimum bars between signals (prevents over-trading)
Visual Settings
Show Arrows: Display ⬆⬇ markers on chart
Show Last 5 Signals Table: Display signal history panel
Bullish/Bearish Color: Customize signal colors
Alert Settings
Enable Alerts: Turn on/off automatic alert notifications
Why This Indicator?
Unlike many indicators that lag behind price action, the IBFB indicator identifies real-time market manipulation and traps. False breakouts often indicate:
Stop-loss hunting by institutional traders
Exhaustion of buying/selling pressure
Potential trend reversals or strong counter-moves
This makes it an excellent tool for contrarian traders and those looking to fade false moves.
Performance Notes
Signals confirm at bar close (no repainting)
Optimized for speed and efficiency
Works alongside other indicators without conflicts
Suitable for manual and automated trading strategies
Suitable for any instrument & market
Disclaimer: This indicator is for educational purposes only. Always practice proper risk management and combine with your own analysis before making trading decisions. Happy trading.

Market Maker Position Bars (Position Size)**Market Maker Position Bars (Position Size) – Indicator Description for TradingView**
This indicator is a clean, professional visualization tool designed for traders who track suspected **market maker / institutional positioning** (especially popular in ICT/SMC communities) on indices like the SPX, NDX, ES, etc.
It draws up to **20 horizontal position bars** directly on the chart, anchored to the very last bar, representing hypothetical long and short positions at specific price levels with corresponding position sizes.
### Key Features & Visual Logic
- **Green bars (Boxes 1–10)** → Extend to the **right** of the last bar
Represent **long positions** (bullish interest)
Default translucent green fill
- **Red bars (Boxes 11–20)** → Extend to the **left** of the last bar
Represent **short positions** (bearish interest)
Default translucent red fill
- **Bar width = Position size**
The length of each box is automatically scaled based on the absolute value you enter in “Position Size”.
Larger position → wider (longer) bar
- Each box displays **Price / Position Size** text inside (e.g., `5720.50 / 1250`)
### Fully Customizable Settings
**Global Geometry**
- Total Box Height (default 10.0) – controls vertical thickness of all boxes
**Position Size Scaling**
- Base Box Width (bars)
- Width per Position Unit – fine-tune how aggressively width grows with size
- Minimum & Maximum Bar Width – prevents boxes from becoming too tiny or excessively long
**Global Text Settings**
- Text color, size (Tiny → Huge), and bold option
**Individual Box Controls (20 independent boxes)**
- Show/Hide toggle
- SPX Price (or any symbol price level)
- Position Size (any positive/negative number; absolute value determines width)
- Fill color (override default green/red if desired)
### How It Works Internally
- All boxes are drawn only on the **last confirmed bar** (`barstate.islast`)
- Width calculation:
`Width = BaseWidth + (|Position Size| × Width per Unit)`
Clamped between Min and Max Bar Width
- Green boxes start at the current bar and extend forward (right)
- Red boxes end at the current bar and extend backward (left)
- Uses Pine Script v6 `box.new()` with `xloc.bar_index` for perfect alignment and performance
### Ideal Use Cases
- Visualizing daily/weekly **order block** or **fair value gap** interest levels with estimated size
- Mapping **dealer positioning**, gamma exposure levels, or large options interest
- Quickly seeing where the “smart money” is theoretically stacked on both sides of the market
- Clean chart markup for screenshots, mentoring, or live trading journals
A minimalist yet powerful tool favored by ICT, SMC, and footprint-style traders who want to see **where the big players might be positioned** — all in one glance without cluttering the chart with hundreds of objects.
Clean. Visual. Size-aware. Perfect for high-level market profiling.

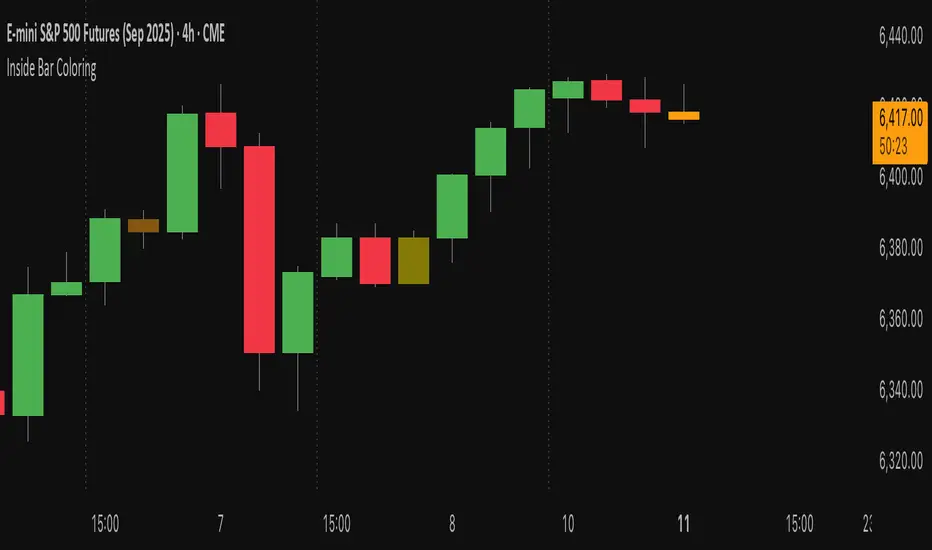
Inside Bar Coloring (Real-time + Historical) w/ AlertsDescription
This Pine Script v6 indicator identifies and colors inside bars, whose entire range (high and low) stays within the previous bar's range. It gives the option to color the real-time bar as well as historical inside bars.
Inside bars are colored differently based on whether they close above or below their opening price (bullish vs bearish). The indicator offers flexible display options including real-time-only highlighting, historical inside bar visualization with transparency, and optional triangle markers for enhanced visibility.
Utility
Inside bars represent periods of market consolidation and reduced volatility, and are by nature consolidating. During this equilibrium, it can be valuable to observe price development rather than engage with it. Conversely, a break of the equilibrium often marks a shift in volatility and provides opportunity. This indicator provides instant visual identification of this price action on your chart.
Features
Smart Coloring System: Separate colors for bullish (close ≥ open) and bearish (close < open) inside bars
Flexible Display Modes: Show only real-time bar, all historical bars, or customize transparency levels
Visual Markers: Optional triangles above or below inside bars
Real-time Alerts: Configurable alerts notify you when new inside bars form
Optimized Performance: Efficient Pine Script v6 code with minimal resource usage
Open Source: Released under Mozilla Public License 2.0
Settings
Customizable colors for bullish/bearish inside bars (real-time and historical)
Toggle historical inside bar display
Real-time bar only mode for clean charts
Adjustable marker position (above/below bars)
Alert activation with detailed price information
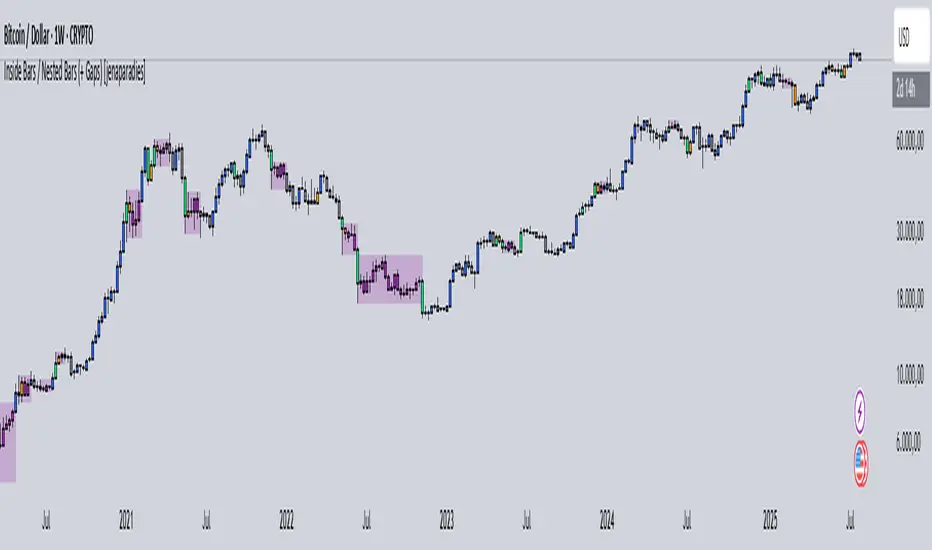
Inside Bars / Nested Bars (+ Gaps) [jenaparadies]📌 Features
Highlight inside bars
Highlight bars that remain within the range of a mother bar (called nested bars )
Highlight the mother bar (optional)
Highlight consecutive nested bars using a visual box (optional)
Enable no-gap candle logic (optional, see below)
Show no-gap candles on the chart (optional)
Fully customizable colors and appearance
📌 Method
An inside bar is any candle whose high is lower than or equal to the previous candle's high, and whose low is higher than or equal to the previous candle's low. In other words, the entire price action of the inside bar remains within the range of the previous candle without exceeding it. The preceding candle is referred to as the mother bar .
Occasionally, the candle following the inside bar may break above or below the inside bar's range, while still remaining fully within the high and low of the mother bar. These candles are referred to as nested bars and are highlighted in a different color.
Optionally, sequences of consecutive nested bars can be enclosed within a box to emphasize consolidation zones.
📌 No-Gap Candles (Optional)
This feature adjusts each candle’s opening price so that it matches the closing price of the previous candle. It is particularly useful for assets that frequently experience large gaps between candles.
By extending each candle's effective range to include the previous candle's close, the indicator maintains structural consistency over timeframes, especially when the open price deviates significantly from the prior close. Inside bars are then identified relative to the extended range of the mother bar.
Optionally, the adjusted no-gap candles can be visualized directly on the chart for better clarity.
🎁 Bonus
Activating the "Show No-Gap Candles" option transforms any line chart into a gap-free bar chart ‒ ideal for visualizing economic data such as inflation rates.
[SHORT ONLY] 10 Bar Low Pullback█ STRATEGY DESCRIPTION
The "10 Bar Low Pullback" strategy is a contrarian short trading system designed to capture pullbacks after a new 10‐bar low is made. it identifies a potential short opportunity when the current bar’s low breaks below the lowest low of the previous 10 bars, provided that the bar exhibits strong internal momentum as measured by its IBS value. An optional trend filter further refines entries by requiring that the close is below a 200-period EMA.
█ WHAT IS INTERNAL BAR STRENGTH (IBS)?
Internal Bar Strength (IBS) measures where the closing price falls within the high-low range of a bar. It is calculated as:
ibs = (close - low) / (high - low)
- Low IBS (≤ 0.2): Indicates the close is near the bar's low, suggesting oversold conditions.
- High IBS (≥ 0.8): Indicates the close is near the bar's high, suggesting overbought conditions.
█ SIGNAL GENERATION
1. SHORT ENTRY
A Short Signal is triggered when:
The current bar’s low is below the lowest low of the past X bars (default: 10).
The bar’s IBS is greater than the specified threshold (default: 0.85).
The signal occurs within the defined trading window (between Start Time and End Time).
If the EMA Filter is enabled, the close must be below the 200-period EMA.
2. EXIT CONDITION
An exit Signal is generated when the current close falls below the previous bar’s low (close < low ), indicating a potential bearish reversal and prompting the strategy to close its short position.
█ ADDITIONAL SETTINGS
Lookback Period: Defines the number of bars (default is 10) over which the lowest low is calculated.
IBS Threshold: Sets the minimum required IBS value (default is 0.85) to qualify as a pullback.
Trading Window: Trades are only executed between the user-defined Start Time and End Time.
EMA Filter (Optional): When enabled, short entries are only considered if the current close is below the 200-period EMA, with the EMA period being adjustable (default is 200).
█ PERFORMANCE OVERVIEW
Designed for shorting opportunities, this strategy aims to capture pullbacks following an aggressive 10-bar low break.
It leverages a combination of a lookback low and IBS measurement to identify overextended bullish moves that may revert.
The optional EMA filter helps confirm a bearish market environment by ensuring the price remains under the trend line.
Suitable for use on various assets, including stocks and ETFs, on daily or similar timeframes.
Backtesting and parameter optimization are recommended to tailor the strategy to specific market conditions.

[SHORT ONLY] Consecutive Bars Above MA Strategy█ STRATEGY DESCRIPTION
The "Consecutive Bars Above MA Strategy" is a contrarian trading system aimed at exploiting overextended bullish moves in stocks and ETFs. It monitors the number of consecutive bars that close above a chosen short-term moving average (which can be either a Simple Moving Average or an Exponential Moving Average). Once the count reaches a preset threshold and the current bar’s close exceeds the previous bar’s high within a designated trading window, a short entry is initiated. An optional EMA filter further refines entries by requiring that the current close is below the 200-period EMA, helping to ensure that trades are taken in a bearish environment.
█ HOW ARE THE CONSECUTIVE BULLISH COUNTS CALCULATED?
The strategy utilizes a counter variable, `bullCount`, to track consecutive bullish bars based on their relation to the short-term moving average. Here’s how the count is determined:
Initialize the Counter
The counter is initialized at the start:
var int bullCount = na
Bullish Bar Detection
For each bar, if the close is above the selected moving average (either SMA or EMA, based on user input), the counter is incremented:
bullCount := close > signalMa ? (na(bullCount) ? 1 : bullCount + 1) : 0
Reset on Non-Bullish Condition
If the close does not exceed the moving average, the counter resets to zero, indicating a break in the consecutive bullish streak.
█ SIGNAL GENERATION
1. SHORT ENTRY
A short signal is generated when:
The number of consecutive bullish bars (i.e., bars closing above the short-term MA) meets or exceeds the defined threshold (default: 3).
The current bar’s close is higher than the previous bar’s high.
The signal occurs within the specified trading window (between Start Time and End Time).
Additionally, if the EMA filter is enabled, the entry is only executed when the current close is below the 200-period EMA.
2. EXIT CONDITION
An exit signal is triggered when the current close falls below the previous bar’s low, prompting the strategy to close the short position.
█ ADDITIONAL SETTINGS
Threshold: The number of consecutive bullish bars required to trigger a short entry (default is 3).
Trading Window: The Start Time and End Time inputs define when the strategy is active.
Moving Average Settings: Choose between SMA and EMA, and set the MA length (default is 5), which is used to assess each bar’s bullish condition.
EMA Filter (Optional): When enabled, this filter requires that the current close is below the 200-period EMA, supporting entries in a downtrend.
█ PERFORMANCE OVERVIEW
This strategy is designed for stocks and ETFs and can be applied across various timeframes.
It seeks to capture mean reversion by shorting after a series of bullish bars suggests an overextended move.
The approach employs a contrarian short entry by waiting for a breakout (close > previous high) following consecutive bullish bars.
The adjustable moving average settings and optional EMA filter allow for further optimization based on market conditions.
Comprehensive backtesting is recommended to fine-tune the threshold, moving average parameters, and filter settings for optimal performance.

Outside Bar Strategy % (Alessio)Outside Bar Strategy %
This strategy is based on identifying Outside Bars, which occur when the current bar's high is higher than the previous bar's high and its low is lower than the previous bar's low. The strategy enters trades in the direction of the Outside Bar, offering a powerful way to capture price moves following a strong price expansion.
Key Features:
Long and Short Entries: The strategy enters a Long trade when the Outside Bar closes bullish (current close > open), and a Short trade when the Outside Bar closes bearish (current close < open).
Customizable Entry Levels: The entry point is calculated based on a customizable percentage of the Outside Bar's range, allowing flexibility for traders to fine-tune their entries at 50% or 70% of the bar's range.
Stop Loss (SL) and Take Profit (TP):
Stop Loss (SL) is automatically placed at the Outside Bar's low for Long trades and at its high for Short trades.
Take Profit (TP) is calculated as a percentage of the Outside Bar's range, with customizable settings for take-profit levels.
Visual Indicators:
Entry, Stop Loss, and Take Profit levels are plotted as lines on the chart, with customizable colors and widths for easy identification.
Labels are placed on the chart to indicate whether the trade is Long or Short, positioned above or below the Outside Bar's candlestick.
Alerts: Users can enable alerts to receive notifications when a trade is triggered, including details such as entry points and stop loss levels.
Strategy Parameters:
Entry Percentage: Set the entry level as a percentage of the Outside Bar's range (e.g., 50%, 70%).
Take Profit Percentage: Customize the Take Profit level as a percentage of the Outside Bar's range.
Customizable Colors and Line Widths: Adjust the colors and thickness of the entry, stop loss, and take profit lines to fit your preferences.
Alerts: Enable alerts to be notified when a trade is executed or when the entry level is reached.
This strategy is ideal for traders who want to capitalize on significant price moves after a breakout, with clear risk management through Stop Loss and Take Profit levels. The customizable features make it suitable for various market conditions and trading styles.

WD Gann: Close Price X Bars Ago with Line or Candle PlotThis indicator is inspired by the principles of WD Gann, a legendary trader known for his groundbreaking methods in time and price analysis. It helps traders track the close price of a security from X bars ago, a technique that is often used to identify key price levels in relation to past price movements. This concept is essential for Gann’s market theories, which emphasize the relationship between time and price.
WD Gann’s analysis often revolved around specific numbers that he considered significant, many of which correspond to squared numbers (e.g., 1, 4, 9, 16, 25, 36, 49, 64, 81, 100, 121, 144, 169, 196, 225, 256, 289, 324, 361, 400, 441, 484, 529, 576, 625, 676, 729, 784, 841, 900, 961, 1024, 1089, 1156, 1225, 1296, 1369, 1444, 1521, 1600, 1681, 1764, 1849, 1936). These numbers are believed to represent natural rhythms and cycles in the market. This indicator can help you explore how past price levels align with these significant numbers, potentially revealing key price zones that could act as support, resistance, or reversal points.
Key Features:
- Historical Close Price Calculation: The indicator calculates and displays the close price of a security from X bars ago (where X is customizable). This method aligns with Gann's focus on price relationships over specific time intervals, providing traders with valuable reference points to assess market conditions.
- Customizable Plot Type: You can choose between two plot types for visualizing the historical close price:
- Line Plot: A simple line that represents the close price from X bars ago, ideal for those who prefer a clean and continuous representation.
- Candle Plot: Displays the close price as a candlestick chart, providing a more detailed view with open, high, low, and close prices from X bars ago.
- Candle Color Coding: For the candle plot type, the script color-codes the candles. Green candles appear when the close price from X bars ago is higher than the open price, indicating bullish sentiment; red candles appear when the close is lower, indicating bearish sentiment. This color coding gives a quick visual cue to market sentiment.
- Customizable Number of Bars: You can adjust the number of bars (X) to look back, providing flexibility for analyzing different timeframes. Whether you're conducting short-term or long-term analysis, this input can be fine-tuned to suit your trading strategy.
- Gann Method Application: WD Gann's methods involved analyzing price action over specific time periods to predict future movements. This indicator offers traders a way to assess how the price of a security has behaved in the past in relation to a chosen time interval, a critical concept in Gann's theories.
How to Use:
1. Input Settings:
- Number of Bars (X): Choose the number of bars to look back (e.g., 100, 200, or any custom period).
- Plot Type: Select whether to display the data as a Line or Candles.
2. Interpretation:
- Using the Line plot, observe how the close price from X bars ago compares to the current market price.
- Using the Candles plot, analyze the full price action of the chosen bar from X bars ago, noting how the close price relates to the open, high, and low of that bar.
3. Gann Analysis: Integrate this indicator into your broader Gann-based analysis. By looking at past price levels and their relationship to significant squared numbers, traders can uncover potential key levels of support and resistance or even potential reversal points. The historical close price can act as a benchmark for predicting future market movements.
Suggestions on WD Gann's Emphasis in Trading:
WD Gann’s trading methods were rooted in several key principles that emphasized the relationship between time and price. These principles are vital to understanding how the "Close Price X Bars Ago" indicator fits into his overall analysis:
1. Time Cycles: Gann believed that markets move in cyclical patterns. By studying price levels from specific time intervals, traders can spot these cycles and predict future market behavior. This indicator allows you to see how the close price from X bars ago relates to current market conditions, helping to spot cyclical highs and lows.
2. Price and Time Squaring: A core concept in Gann’s theory is that certain price levels and time periods align, often marking significant reversal points. The squared numbers (e.g., 1, 4, 9, 16, 25, etc.) serve as potential key levels where price and time might "square" to create support or resistance. This indicator helps traders spot these historical price levels and their potential relevance to future price action.
3. Geometric Angles: Gann used angles (like the 45-degree angle) to predict market movements, with the belief that prices move at specific geometric angles over time. This indicator gives traders a reference for past price levels, which could align with key angles, helping traders predict future price movement based on Gann's geometry.
4. Numerology and Key Intervals: Gann paid particular attention to numbers that held significance, including squared numbers and numbers related to the Fibonacci sequence. This indicator allows traders to analyze price levels based on these key numbers, which can help in identifying potential turning points in the market.
5. Support and Resistance Levels: Gann’s methods often involved identifying levels of support and resistance based on past price action. By tracking the close price from X bars ago, traders can identify past support and resistance levels that may become significant again in future market conditions.
Perfect for:
Traders using WD Gann’s methods, such as Gann angles, time cycles, and price theory.
Analysts who focus on historical price levels to predict future price action.
Those who rely on numerology and geometric principles in their trading strategies.
By integrating this indicator into your trading strategy, you gain a powerful tool for analyzing market cycles and price movements in relation to key time intervals. The ability to track and compare the historical close price to significant numbers—like Gann’s squared numbers—can provide valuable insights into potential support, resistance, and reversal points.
Disclaimer:
This indicator is based on the methods and principles of WD Gann and is for educational purposes only. It is not intended as financial advice. Trading involves significant risk, and you should not trade with money that you cannot afford to lose. Past performance is not indicative of future results. The use of this indicator is at your own discretion and risk. Always do your own research and consider consulting a licensed financial advisor before making any investment decisions.

ATR for Aggregated Bars (2 Bars)Range Bar ATR Indicator: Detailed Description and Usage Guide
This script is a custom indicator designed specifically for Range Bar charts , tailored to help traders understand and navigate market conditions by utilizing the Average True Range (ATR) concept. The indicator adapts the traditional ATR to work effectively with Range Bar charts, where bars have a fixed range rather than being time-based.
How It Works
1. ATR Calculation on Range Bars :
- Unlike time-based charts, Range Bar charts focus on price movement within a fixed range.
- The indicator calculates ATR by pairing consecutive bars, treating every two bars as a single unit . This pairing ensures that the ATR reflects price movement effectively on Range Bar charts.
2. Short and Long Period ATR Values :
- The script displays two ATR values :
- A short-period ATR , calculated over a smaller number of paired bars.
- A long-period ATR , calculated over a larger number of paired bars.
- These values provide a dynamic view of both recent and longer-term market volatility.
Why Use This Indicator?
The primary goal is to provide a meaningful adaptation of the ATR indicator for Range Bar charts, allowing traders to make informed decisions similar to using ATR on traditional time-based charts.
Key Applications
Determine a Better Custom Range :
- Analyze the ATR values to choose an optimal range size for Range Bar charts, ensuring better alignment with market conditions.
Assess Market Volatility :
- Rising volatility : When the short-period ATR value is higher than the long-period value, it signals increasing volatility.
- Decreasing volatility : When the short-period ATR value is lower, it indicates declining volatility.
Risk and Stop Loss Management :
- Use the higher ATR value (e.g., the long-period ATR) to calculate minimum stop loss levels. Multiply the ATR by 1.5 or 2 to set a safe buffer against market fluctuations.
How to Use It
1. Add the script to a Range Bar chart.
2. Configure the short and long ATR periods to suit your trading style and preferences.
3. Observe the displayed ATR values:
- Use these values to analyze market conditions and adapt your strategy accordingly.
4. Apply insights from the ATR values for:
- Determining custom Range Bar settings.
- Evaluating volatility trends.
- Setting effective risk parameters like stop loss levels.
Benefits
- Provides a tailored ATR tool for Range Bar charts, addressing the unique challenges of fixed-range trading.
- Offers both short-term and long-term perspectives on volatility.
- Enhances decision-making for range settings, volatility analysis, and risk management.
This indicator bridges the gap between traditional ATR indicators and the specific needs of Range Bar chart users, making it a versatile tool for traders.

Price Time Filtering Bar CountThis script is designed to identify and visualize market trends by analyzing price action over a specified aggregation period. Detailed breakdown of its functionality:
Trend Identification
Uptrend Detection:
An uptrend is signaled when the closing price of the previous bar is higher than the high price from two bars ago.
Downtrend Detection:
A downtrend is indicated when the closing price of the previous bar is lower than the low price from two bars ago.
Trend Continuation:
If neither condition is met, the current trend continues from the previous bar.
Trend Counting
Counter Initialization:
A counter (count) keeps track of the number of consecutive bars in the current trend.
Counter Reset:
When a new trend is detected (change from uptrend to downtrend or vice versa), the counter resets to 1.
Counter Increment:
If the trend continues, the counter increments by 1 for each new bar in the same trend.
Visualization
BarCount Plot:
The BarCount variable represents the current count of trend bars.
Positive Values: Indicate the number of bars in an uptrend.
Negative Values: Indicate the number of bars in a downtrend.
Zero or na: Represents no clear trend or initialization phase.
Histogram Style:
The BarCount is plotted as a histogram, providing a visual representation of trend strength and duration.
Color Coding
Uptrend Color:
Bars and histogram columns are colored teal (or the color assigned to UptrendColor) when in an uptrend.
Downtrend Color:
Bars and histogram columns are colored orange (or the color assigned to DowntrendColor) when in a downtrend.
Customizable Coloring:
The paintBars input allows users to enable or disable the coloring of price bars according to the current trend.
Aggregation Period
User Input:
The aggregationPeriod input lets users specify a timeframe for the indicator's calculations.
If left empty, the indicator uses the chart's current timeframe.
Data Fetching:
The indicator retrieves close, high, and low prices based on the specified aggregation period using the request.security function.
How It Works Together
Data Retrieval:
The indicator fetches the necessary price data (secAggClose, secAggHigh, secAggLow) based on the chosen timeframe.
Trend Calculation:
It compares the previous closing price to the high and low prices from two bars ago to determine the current trend.
Trend Counting:
The counter tracks how many consecutive bars the market has been in the current trend.
Visualization and Coloring:
The BarCount is plotted as a histogram, with colors indicating the trend direction.
Optionally, the price bars on the chart are colored to match the trend for easier visualization.
Practical Use Cases
Trend Strength Assessment:
Traders can gauge the strength of a trend by observing the magnitude of the BarCount. A higher absolute value indicates a stronger, more prolonged trend.
Trend Reversals:
A reset in the counter (switch from positive to negative or vice versa) can signal a potential trend reversal, providing entry or exit points.
Momentum Trading:
By visualizing the duration of trends, momentum traders can identify optimal times to join a prevailing trend or anticipate its exhaustion.
Customization Options
Enable/Disable Bar Coloring:
Users can toggle the paintBars option to switch between a clean price chart and one that highlights trends with color.
Aggregation Period Adjustment:
Adjusting the aggregationPeriod allows analysis over different timeframes without changing the chart's main settings, offering flexibility in strategy development.
Conclusion
This indicator serves as a powerful tool for trend analysis by:
Quantifying Trend Duration: Helps understand how long a trend has persisted.
Visual Trend Representation: Offers immediate visual cues through histogram bars and color-coded price bars.
Flexible Configuration: Provides options to customize the timeframe and visual aspects to suit individual trading styles.
By integrating this indicator into your trading strategy, you can enhance your ability to identify trend patterns, assess their strength, and make more informed trading decisions based on trend dynamics.

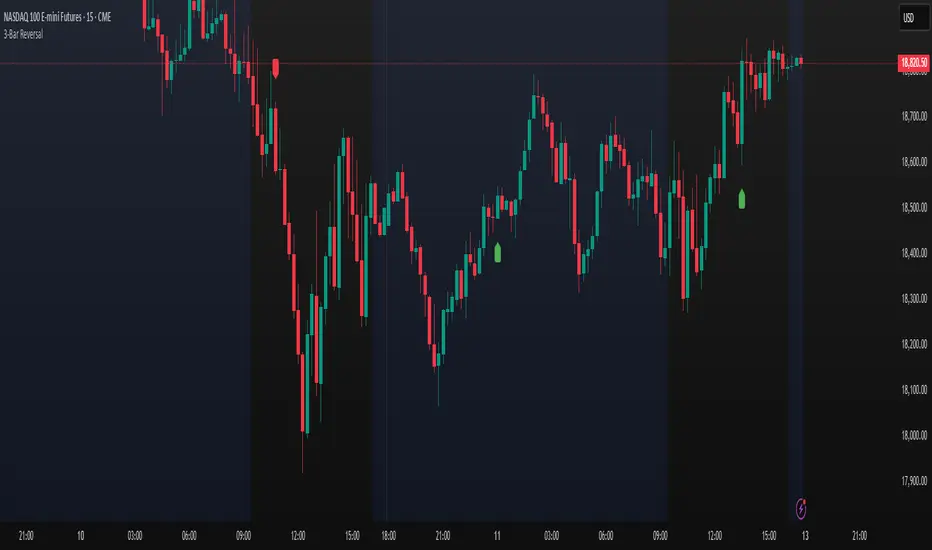
Three Bar Reversal Pattern [LuxAlgo]The Three Bar Reversal Pattern indicator identifies and highlights three bar reversal patterns on the user price chart.
The script also provides an option for incorporating various trend indicators used to filter out detected signals, allowing them to enhance their accuracy and help obtain a more comprehensive analysis.
🔶 USAGE
The script automates the detection of three-bar reversal patterns and provides a clear, visually identifiable signal for potential trend reversals.
When a reversal chart pattern is confirmed and price action aligns with the pattern, the pattern's boundaries are extended, forming levels, with the upper boundary often acting as a resistance and the lower boundary as a support.
The script allows users to filter patterns based on a specific trend direction detected by multiple trend indicators. Users can choose to view patterns that are either aligned with the detected trend or opposite to it.
Included trend indicators are: Moving Average Cloud, Supertrend, and Donchian Channels.
🔶 DETAILS
The three-bar reversal pattern is a technical analysis pattern that signals a potential reversal in the prevailing trend. The pattern consists of three consecutive bar formations:
First Bar and Second Bar: 2 consecutive of the same sentiment, representing the prevailing trend in the market.
Third Bar: Confirms the reversal by closing beyond the high or low of the first bar, signaling a potential change in market sentiment.
Various types of three-bar reversal patterns are documented. The script supports two main types:
Normal Pattern: Detects three-bar reversal patterns without requiring the third bar closing price to surpass the high (bullish pattern) or low (bearish pattern) of the first bar. It identifies basic formations signaling potential trend reversals.
Enhanced Pattern: Specifically identifies three-bar reversal patterns where the third bar closing price surpasses the high (bullish pattern) or low (bearish pattern) of the first bar. This type provides a more selective signal for stronger trend reversals.
🔶 SETTINGS
Pattern Type: Users can choose the type of 3-bar reversal patterns to detect: Normal, Enhanced, or All. "Normal" detects patterns that do not necessarily surpass the high/low of the first bar. "Enhanced" detects patterns where the third bar surpasses the high/low of the first bar. "All" detects both Normal and Enhanced patterns.
Derived Support and Resistance: Toggles the visibility of the support and resistance levels/zones.
🔹 Trend Filtering
Filtering: Allows users to filter patterns based on the trend indicators: Moving Average Cloud, Supertrend, and Donchian Channels. The "Aligned" option only detects patterns that align with the trend and conversely, the "Opposite" option detects patterns that go against the trend.
🔹 Trend Indicator Settings
Moving Average Cloud: Allows traders to choose the type of moving averages (SMA, EMA, HMA, etc.) and set the lengths for fast and slow-moving averages.
Supertrend: Options to set the ATR length and factor for Supertrend.
Donchian Channels: Option to set the length for the channel calculation.
🔶 RELATED SCRIPTS
Reversal-Candlestick-Structure .
Reversal-Signals .

Three Bar ReversalThis script was written to make it easier to discover three bar reversal patterns.
A three bar reversal occurs when these conditions are met:
Long Setup (Reversal Up)
1. Bar 1 closes down
2. Low of Bar 2 is below the low of Bar 1 and Bar 3
3. Bar 3 closes above the high of both Bar 1 and Bar 2
Short Setup (Reversal Down)
1. Bar 1 closes up
2. High of Bar 2 is above the high of Bar 1 and Bar 3
3. Bar 3 closes below the low of both Bar 1 and Bar 2
When this indicator is added to your chart, you will see "Reversal Up" or "Reversal Down" when one of the above conditions are met.
It is recommended to use the 1 minute time frame for short scalps and 5 minute time frame for longer held day trade positions.
This indicator also has an alert option.
To enable an alert:
1. Create a new alert
2. Set condition "Reversal" and "Any alert() function call"
3. Give the alert a unique name
It is good to have an alert for different tickers and different time frames!
When the alert is triggered, you will receive a message:
Reversal up on: ticker-ID-here
or
Reversal down on: ticker-ID-here
Never miss a trade setup again!

Trending Bar SRTrending Bar SR is a simple script define a Bar called "Trending Bar".
Depend on direction of Trending Bar, if Trending Bar is UpTrend then this indicator plot Bar's Low Price as Support and if Trending Bar is DownTrend then it plot Bar's High Price as Resistance.
Beside, this indicaor also plot 4 levels retracement of Trending Bar for trading.
1. Define Trending Bar
1.1 Uptrend Bar
+ Close Price higher than previous High Price
+ Body greater than sum of shadows (up and down)
+ Color: A green dot is plotted at bottom chart.
1.2 Downtrend Bar
+ Close Price lower than previous Low Price
+ Body greater than sum of shadows (up and down)
+ Color: A red dot is plotted at bottom chart.
2. Retracement Level
+ Trending Bar Retracement 0.5 is called Equerium.
+ Trending Bar Retracement 0.618 is called Perfect Entry.
+ Trending Bar Retracement 0.705 is called Optimal Entry.
+ Trending Bar Retracement 0.79 is called Max Entry.
3. Trading
+ When Price crossed Equerium, consider open position at Perfect Entry, Optimal Entry with stoploss place at Max Entry.
+ If place order at Max Entry, stoploss can place at Support or Resistance.

Consecutive Up and Down BarsOVERVIEW
Identify price thrusts made up of at least three consecutive bars that conform to specific criteria. (E.g., consecutive higher closes)
Depending on the context, these powerful thrusts can indicate emerging momentum or exhaustion. This indicator helps to mark these thrusts for further analysis.
CONCEPTS
As mentioned, these consecutive bar thrusts can indicate:
Momentum in the direction of the thrust; or
Exhaustion, implying possible short-term reversal or sideways action.
In the first case, we can track these patterns and their followthrough to determine changes in the market trend.
In the latter case, we can consider an entry by fading the pattern or use it for profit-taking. Price patterns like the Three-Bar Pullback are based on such premises.
There are different conditions used when looking for such consecutive bars. Hence, it's helpful to toggle the conditions while studying this pattern to see which ones work well with your trading approach. This is the primary purpose of this indicator.
This indicator looks for three consecutive bars that conform to the selected condition(s).
These are the conditions you can toggle in this study:
1. Bullish or Bearish Bars
A bullish bar closes higher than it opens. (Green candlestick)
A bearish bar closes lower than it opens. (Red candlestick)
2. Rising or Falling Closing Prices
This condition compares each closing price to the previous closing price.
3. Up or Down Bars
An up bar has a higher high and higher low compared to the previous bar.
A down bar has a lower high and lower low compared to the previous bar.
HOW TO USE
Display
The display is oriented towards traders who are looking to fade these consecutive bars.
Consecutive bars that push higher are marked with a down arrow above the bar.
Consecutive bars that push lower are marked with an up arrow below the bar.
In this implementation, as we are looking for at least three consecutive bars, the arrow marking starts from the third bar of the pattern.
Parameters
Toggle the different conditions that apply when marking consecutive bars. (Conditions as explained above)
Current Close vs. Current Open
Current Close vs. Previous Close
Current High and Low vs. Previous High and Low
You can select one or more of the conditions. By default, all are selected. (If all are unselected, it will mark every single bar and render the study useless.)

Intra Bar Volume ProfileThis indicator provides a high-resolution volume profile analysis for every single bar on the chart. It builds this profile by sampling data from a lower intra-bar timeframe, allowing for a granular view of price distribution and buying/selling pressure within the bar.
Key Features:
Intra-Bar Profile Engine: For each bar on the main chart, the indicator builds a complete volume profile on a lower 'Intra-Bar Timeframe'. It uses:
Statistical Models ('Allot model'): Distributes volume across price levels using 'PDF' (Probability Density Function) or 'Classic' (close) methods.
Buy/Sell Classifiers ('Volume Estimator'): Splits volume using a 'Dynamic' (trend/wick-based) or 'Classic' (candle color) model.
On-Chart Visualization (Overlay): The analysis is rendered directly onto the price bars:
Point of Control (POC): A line showing the price level with the most volume for that bar.
Value Area (VA): A colored box representing the price range where the specified percentage (e..g., 50%) of volume was traded.
VWAP: Displays the volume-weighted average price (VWAP) for the bar as a separate line.
Integrated Alerts: Includes 8 alerts that trigger when the main price crosses over or under the key intra-bar levels: POC, VWAP, and the Value Area High/Low.
Caution: Real-Time Data Behavior (Intra-Bar Repainting) This indicator uses high-resolution intra-bar data. As a result, the values on the current, unclosed bar (the real-time bar) will update dynamically as new intra-bar data arrives. This behavior is normal and necessary for this type of analysis. Signals should only be considered final after the main chart bar has closed.
DISCLAIMM
For Informational/Educational Use Only: This indicator is provided for informational and educational purposes only. It does not constitute financial, investment, or trading advice, nor is it a recommendation to buy or sell any asset.
Use at Your Own Risk: All trading decisions you make based on the information or signals generated by this indicator are made solely at your own risk.
No Guarantee of Performance: Past performance is not an indicator of future results. The author makes no guarantee regarding the accuracy of the signals or future profitability.
No Liability: The author shall not be held liable for any financial losses or damages incurred directly or indirectly from the use of this indicator.
Signals Are Not Recommendations: The alerts and visual signals (e.g., crossovers) generated by this tool are not direct recommendations to buy or sell. They are technical observations for your own analysis and consideration.

DCA Anchor (Weekly/Monthly/N Bars) [CHE] What is Dollar-Cost Averaging (DCA)?
DCA is a position-building method where you invest a fixed amount at fixed intervals (e.g., weekly or monthly) regardless of price. Over time, this:
reduces timing risk (you don’t need to guess tops/bottoms),
smooths entry price by buying more units when price is low and fewer when price is high,
keeps decisions simple and repeatable.
Trade-offs:
You’ll never catch the exact bottom.
In strong uptrends, lump-sum can outperform.
Fees matter if you buy very frequently.
Simple math:
Qty bought at time t = `amount / price_t` (net of fees if fees are not “on top”).
Total qty = sum of all buys.
Average price (cost basis) = `total invested / total qty`.
Equity = `total qty last price`.
P\&L = `equity − total invested` (and `%` = `P&L / total invested`).
DCA Anchor (Weekly/Monthly/N Bars)
Purpose: automate scheduled DCA buys on chart data, optionally add extra buys on drawdowns, track stats, and fire alerts.
Core features
Schedules:
1. Every N bars,
2. Weekly (first bar of a new week),
3. Monthly (first bar of a new month).
A Start time input gates when the logic begins.
Fees model:
Fee on top: you pay `amount + fee` in cash; quantity = `amount / close`.
Fee from amount: fee is deducted from the amount; quantity is smaller, cash outlay equals `amount`.
Optional drawdown buys:
Trigger when `close ≤ avgCost (1 − ddPct/100)`.
Controls: drawdown % threshold, multiplier (extra size vs. base amount), and cooldown in bars.
State & metrics: tracks total invested, total quantity, average price, equity, P\&L (abs/%).
Visuals:
Line plot of Average Price.
Buy labels at execution bars (plan and drawdown).
Compact table (positionable) with key stats (trades, invested, qty, avg price, equity, P\&L).
Alerts:
Plan Buy (Bar Close) and Drawdown Buy (Bar Close) — robust, non-repainting.
Optional Intrabar Preview alerts for early heads-up (can fire before bar close).
How to use it (quick start)
1. Add to chart → Inputs:
Buy frequency: pick Every N bars, Weekly, or Monthly.
Start time: date from which buys may begin.
Buy amount: fixed cash per planned buy.
Fees % and Fee on top? to match your broker/exchange model.
(Optional) Enable drawdown buy, set threshold %, multiplier, and cooldown.
Toggle Show buy labels and Show stats table.
2. Alerts (recommended):
Use “DCA Plan Buy (Bar Close)” and/or “DCA Drawdown Buy (Bar Close)” with Once per bar close.
If you need early signals, enable Intrabar pre-alerts and add the two Intrabar Preview alerts with Once per bar.
3. Interpretation:
The yellow line is your average price.
Green/orange markers show plan buys and drawdown buys.
The table summarizes total trades, invested capital, quantity, average price, current equity, and P\&L.
Practical notes
All executions occur at bar close by default to avoid intrabar repainting.
Weekly/monthly roll depends on the symbol’s exchange calendar.
Backtest realism: no slippage, no partial fills. Fees are modeled as configured.
If you buy very frequently, consider higher “N” or weekly/monthly to keep fees under control.
If you want, I can tailor the defaults (amount, fee model, drawdown rules) to your typical markets and timeframes.
Disclaimer
No indicator guarantees profits. DCA Anchor (Weekly/Monthly/N Bars) is a decision aid; always combine with solid risk management and your own judgment. Backtest, forward test, and size responsibly.
The content provided, including all code and materials, is strictly for educational and informational purposes only. It is not intended as, and should not be interpreted as, financial advice, a recommendation to buy or sell any financial instrument, or an offer of any financial product or service. All strategies, tools, and examples discussed are provided for illustrative purposes to demonstrate coding techniques and the functionality of Pine Script within a trading context.
Any results from strategies or tools provided are hypothetical, and past performance is not indicative of future results. Trading and investing involve high risk, including the potential loss of principal, and may not be suitable for all individuals. Before making any trading decisions, please consult with a qualified financial professional to understand the risks involved.
By using this script, you acknowledge and agree that any trading decisions are made solely at your discretion and risk.
Enhance your trading precision and confidence 🚀
Best regards
Chervolino

UM Dual MA with Price Bar Color change & Fill
Description
This is a dual moving average indicator with colored bars and moving averages. I wrote this indicator to keep myself on the right side of the market and trends. It plots two moving averages, (length and type of MA are user-defined) and colors the MAs green when trending higher or red when trending lower. The price bars are green when both MAs are green, red when both MAs are red, and orange when one MA is green and the other is red. The idea behind the indicator is to be extremely visual. If I am buying a red bar, I ask myself "why?" If I am selling a green bar, again, "why?"
Recommended Usage
Configure your tow favorite Moving averages. Consider long positions when one or both turn green. Scale into a position with a portion upon the first MA turning green, and then more when the second turns green. Consider scaling out when the bars are orange after an up move.
Orange bars are either areas of consolidation or prior to major turns.
You can also look for MA crossovers.
The indicator works on any timeframe and any security. I use it on daily, hourly, 2 day charts.
Default settings
The defaults are the author's preferred settings:
- 8 period WMA and 16 period WMA.
- Bars are green when both MAs are trending higher, red when both MAs are trending lower, and orange when one MA is trending higher and the other is trending lower.
Moving average types, lengths, and colors are user-configurable. Bar colors are also user-configurable.
Alerts
Alerts can be set by right-clicking the indicator and selecting the dropdown:
- Bullish Trend Both MAs turning green
- Bearish Trend Both MAs turning red
- Mixed Trend, 1 green 1 red MA
Helpful Hints:
Look for bullish areas when both MAs turn green after a sustained downtrend
Look for bearish areas when both MAs turn red
Careful in areas of orange bars, this could be a consolidation or a warning to a potential trend direction change.
Switch up your timeframes, I toggle back and forth between 1 and 2 days.
Stretch your timeframe over a lower time frame; for example, I like the 8 and 16 daily WMA. With most securities I get 16 bars with pre and post market. This translates into 128 and 256 MAs on the hourly chart. This slows down moves and color transitions for better manageability.
Author's Subjective Observations
I like the 128/256 WMA on the hourly charts for leveraged and inverse ETFs such as SPXL/SPXS, TQQQ/SQQQ, TNA/TZA. Or even the volatility ETFs/ETNS: UVXY, VXX.
Here is a one-hour chart example:
I have noticed that as volatility increases, I should begin looking at higher timeframes. This seems counterintuitive, but higher volatility increases the level of noise or swings.
I question myself when I short a green bar or buy a red bar; "Why am I doing this?" The colors help me visually stay on the right side of trend. If I am going to speculate on a market turn, at least do it when the bars are orange (MA trends differ)
My last observation is a 2-day chart of leveraged ETFs with the 8 and 16 WMAs. I frequently trade SPXL, FNGA, and TNA. If you are really dissecting this indicator,
look at a few 2-day charts. 2-day charts seem to catch the major swings nicely up and down. They also weed out the daily sudden big swings such as a panic move from economic data
or tweets. When both the MAs turn red on a 2-day chart the same day or same bar, beware; this could be a rough ride or short opportunity. I found weekly charts too long for my style but good
to review for direction. Less decisions on longer charts equate to less brain damage for myself.
These are just my thoughts, of course you do you and what suits your style best! Happy Trading.

3-Bar ReversalAbout the Script
This script automatically detects and plots a signal when a Three-Bar Reversal pattern appears on the chart, helping traders identify potential trend reversals with ease.
How to Use the Script
1) Add the script to your chart.
2) Customize the visual appearance to match your preferences.
3) Click "OK" to apply the changes.
Once configured, the script will highlight valid Three-Bar Reversal patterns when they form.
How the Script Works
The Three-Bar Reversal pattern consists of three consecutive candlesticks, each playing a crucial role in identifying market shifts:
First Bar: Represents the existing trend.
In a bullish reversal, the first bar is typically bearish (downward).
In a bearish reversal, the first bar is typically bullish (upward).
Second Bar: Indicates indecision or trend exhaustion.
This bar often has a smaller body (such as a doji or spinning top), showing weakening momentum.
It may also feature wicks on both sides, reflecting market uncertainty.
Third Bar: Confirms the reversal.
In a bullish reversal, the third bar closes above the high of the first bar, signaling a potential upward move.
In a bearish reversal, the third bar closes below the low of the first bar, signaling a potential downward trend.
Once the pattern is confirmed, a marker will appear below the third bar, helping traders quickly spot opportunities.
Inside BarsInside Bars Indicator
Description:
This indicator identifies and highlights price action patterns where a bar's high and low
are completely contained within the previous bar's range. Inside bars are significant
technical patterns that often signal a period of price consolidation or uncertainty,
potentially leading to a breakout in either direction.
Trading Literature & Theory:
Inside bars are well-documented in technical analysis literature:
- Steve Nison discusses them in "Japanese Candlestick Charting Techniques" as a form
of harami pattern, indicating potential trend reversals
- Thomas Bulkowski's "Encyclopedia of Chart Patterns" categorizes inside bars as
a consolidation pattern with statistical significance for breakout trading
- Alexander Elder references them in "Trading for a Living" as indicators of
decreasing volatility and potential energy build-up
- John Murphy's "Technical Analysis of the Financial Markets" includes inside bars
as part of price action analysis for market psychology understanding
The pattern is particularly significant because it represents:
1. Volatility Contraction: A narrowing of price range indicating potential energy build-up
2. Institutional Activity: Often shows large players absorbing or distributing positions
3. Decision Point: Market participants evaluating the previous bar's significance
Trading Applications:
1. Breakout Trading
- Watch for breaks above the parent bar's high (bullish signal)
- Monitor breaks below the parent bar's low (bearish signal)
- Multiple consecutive inside bars can indicate stronger breakout potential
2. Market Psychology
- Inside bars represent a period of equilibrium between buyers and sellers
- Shows market uncertainty and potential energy building up
- Often precedes significant price movements
Best Market Conditions:
- Trending markets approaching potential reversal points
- After strong momentum moves where the market needs to digest gains
- Near key support/resistance levels
- During pre-breakout consolidation phases
Complementary Indicators:
- Volume indicators to confirm breakout strength
- Trend indicators (Moving Averages, ADX) for context
- Momentum indicators (RSI, MACD) for additional confirmation
Risk Management:
- Use parent bar's range for stop loss placement
- Wait for breakout confirmation before entry
- Consider time-based exits if breakout doesn't occur
- More reliable on higher timeframes
Note: The indicator works best when combined with proper risk management
and overall market context analysis. Avoid trading every inside bar pattern
and always confirm with volume and other technical indicators.
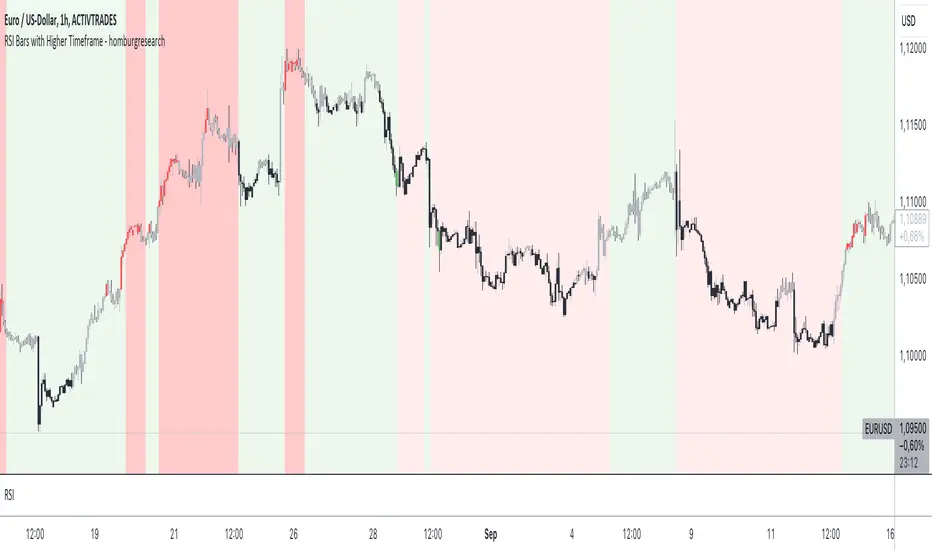
RSI Bars with Higher Timeframe - homburgresearchThe "RSI Bars with Higher Timeframe - homburgresearch" indicator is an advanced tool designed to provide traders with visual cues about overbought, oversold, and trend-related market conditions based on the Relative Strength Index (RSI). This version also includes an analysis of higher timeframes to enhance decision-making and provide a more comprehensive view of market trends.
Indicator Features:
The indicator colors the bars according to the RSI value and considers conditions on both the current and higher timeframes. A bullish trend is represented by gray bars when the RSI is above the 50 level, while a bearish trend is represented by black bars when the RSI is below the 50 level.
The indicator also offers coloring to highlight extreme overbought or oversold conditions. Extremely overbought areas (e.g., RSI > 80) are marked in red and may indicate particularly risky market conditions. Extremely oversold areas (e.g., RSI < 20) are marked in green and indicate potentially very attractive buying opportunities.
In addition to bar coloring, the indicator allows for background coloring based on the RSI values of a higher timeframe chosen by the user. This background helps identify larger trends, with red and green shading representing bearish and bullish conditions, respectively. Additionally, extreme overbought and oversold conditions can also be represented as background, providing traders with even clearer signals for risky or attractive market conditions. This feature allows traders to better align their trading decisions with the broader market trend and adds another layer of analysis.
All parameters are individually adjustable, including the RSI length, thresholds for overbought/oversold conditions, colors for different market states, and the choice of a higher timeframe for background analysis.
The indicator provides alerts that notify you when the RSI reaches certain thresholds, ensuring that you do not miss important trading opportunities. Alerts can be set for entering the overbought zone, the oversold zone, or extreme overbought or oversold conditions.
Using the RSI Bars with Higher Timeframe Indicator:
RSI-based signals can be easily identified through the color-coded bars, helping you recognize when the market might be overbought or oversold. This information can be used for potential counter-movements in the market.
Gray bars indicate that the RSI is above the 50 level, suggesting a bullish trend. Black bars indicate that the RSI is below the 50 level, suggesting a bearish trend. This information helps you better assess the current market direction.
The highlighting of extreme overbought or oversold conditions helps identify overheated markets, which may indicate short-term reversals or a possible continuation. The background color provides context from a higher timeframe and helps traders understand the larger market trend and make more informed decisions.
The alerts keep you updated when the market reaches specific RSI conditions, allowing you to react without constantly monitoring the chart.
Examples of Use:
If the bars are marked in gray, this indicates a bullish trend. It may be advisable to look for long positions or hold existing positions.
If the bars are marked in black, this indicates a bearish trend. It may be advisable to consider short positions or reduce existing long positions.
If the bars are marked in red (overbought), it could be an opportunity to take profits or consider short positions.
If the bars are marked in green (oversold), it could be a good opportunity to look for long positions.
If the background is shaded in green, it indicates a broader bullish trend on the higher timeframe, suggesting that it may be better to align trades in that direction.
If the background is shaded in red, it indicates a broader bearish trend on the higher timeframe, signaling caution for long trades and favoring short trades.
The RSI Bars with Higher Timeframe indicator is particularly useful for traders who base their decisions on RSI signals and want to integrate a multi-timeframe approach into their trading strategy for more comprehensive market analysis.
Note: This indicator is for informational purposes only and does not constitute a buy or sell decision. Any trading decision should be based on your own analysis and consideration of your individual risk profile.