ابحث في النصوص البرمجية عن "bollingerband"
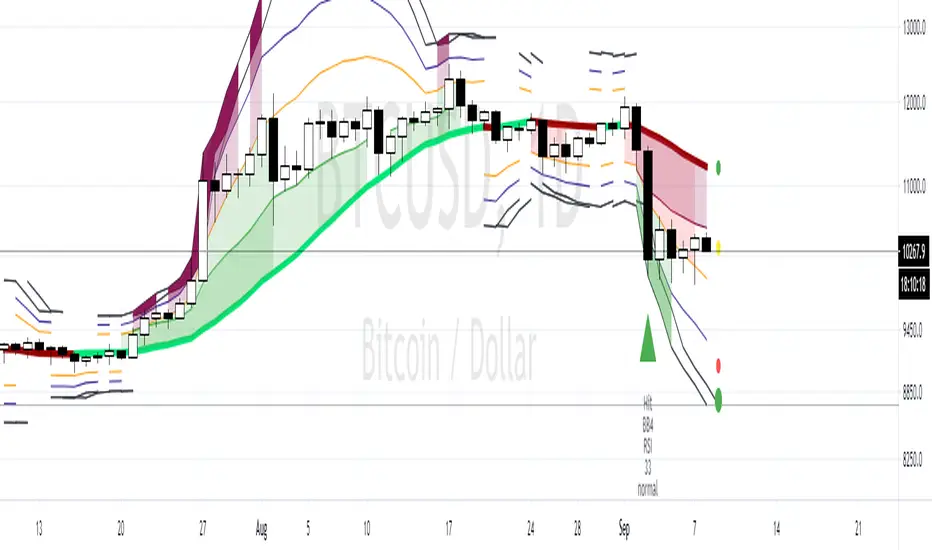
Bollinger Bands 3 to 5 Pull-back Detektor Test versionWe use a mix Bollinger and Keltner.
The price always want to stay inside the Bollinger.
A lot of times we have big candels with great pullbacks.
If u are long and the Indicator show a red BB Area there is a god chance for a pullback.
We have rsi label and Rsi extreme label
If the rsi is High or extreme High u see it in the chart an u can look for a divergence that may end the trend.
I want to use it for scalping together with Pivot Point standart. It is not testet. Please use Papertrading first.
A small Video (german)
If u try it plase leave a commend.
Have fun
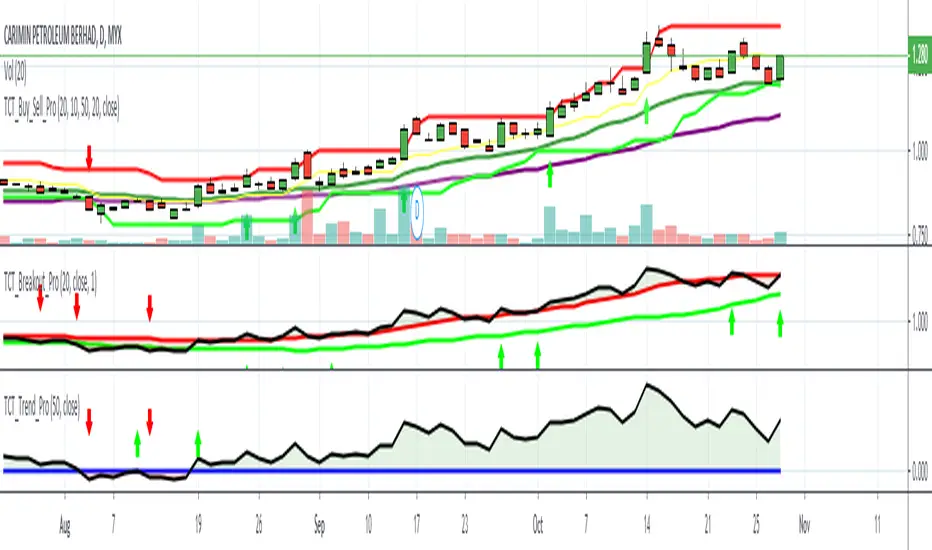
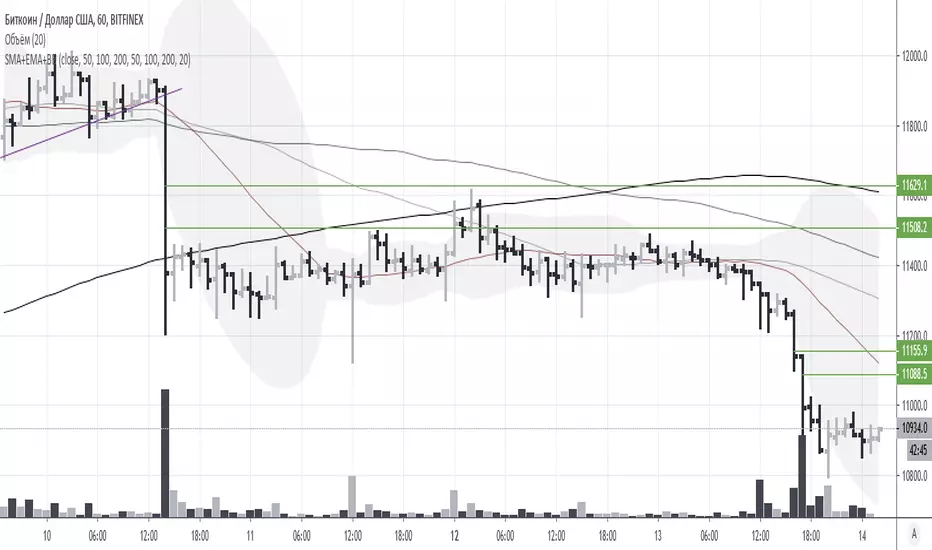
VoDVo by Solah AzmanVoDVo stand for Volatility Discounted Volume
The indicator examines the abnormality of volatility discounted volume. Several parameters would be applied to make buy signals(green bars) and McGinley crossovers are used to make sell signals(red bars). Please note that sell signals are not meant to be an optimal point, you are advised to use your best judgment to find an optimal price prior to sell signal.
It is designed to accommodate some degree of discretionary decision, hence objects are colour coordinated with traffic light.
Green bars: buy signal: entry recommendation.
Yellow dotted line: please reevaluate your position.
Red bars: sell signal: sell everything! it's too late to get creative.

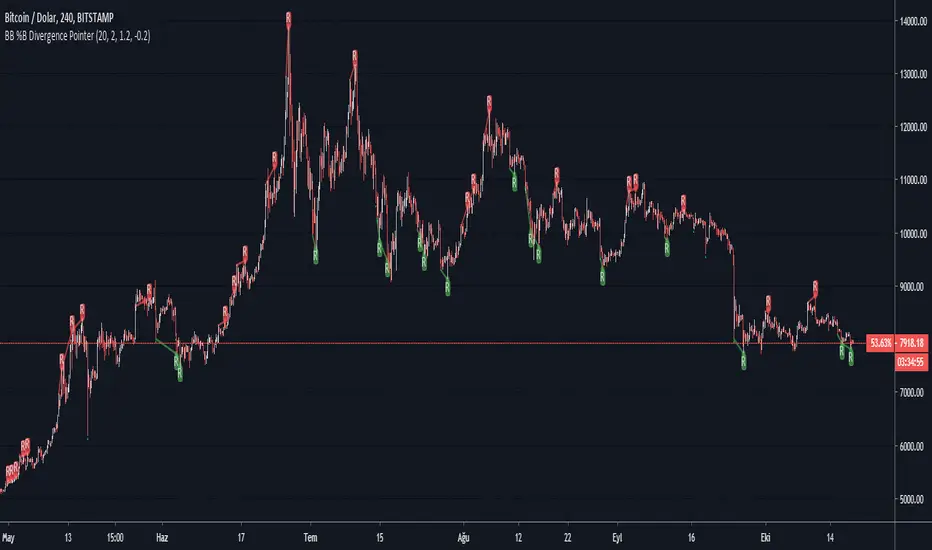
BB %B Divergence PointerThis script points regular and optionally hidden types of bullish and bearish Bollinger Band %B divergences on the chart by drawing the divergence lines and optionally labels.
Hidden divergence is disabled by default, it can be enabled over settings window.
Regular divergence is enabled by default, it can be disabled over settings window.
There is an options to display the price channel , bollinger band , Oversold and overbought levels additionally.
Supports alerts for all types of divergences.
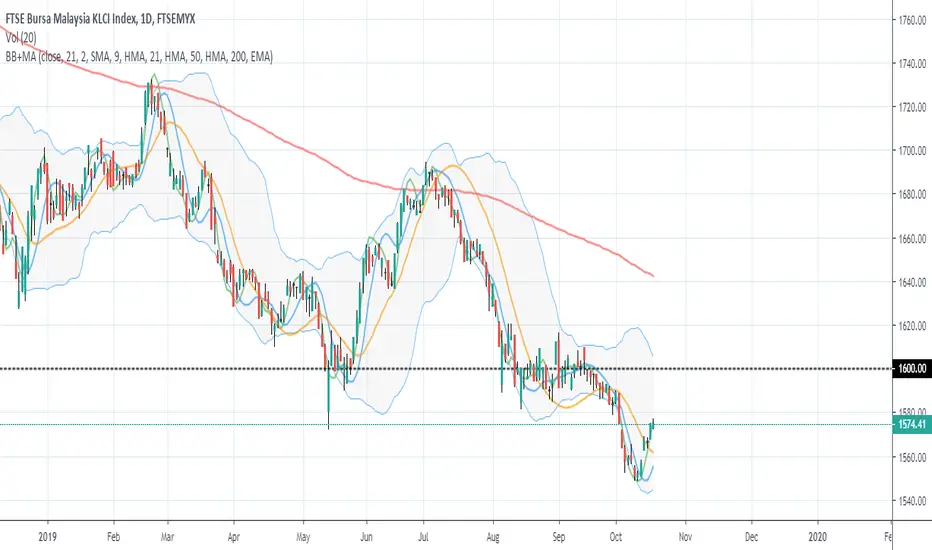
Bollinger Bands + Moving AveragesCombination of Bollinger Bands and 4 Moving Averages in one indicator.
The smoothing algorithm for the Bollinger Bands basis line and each of the Moving Averages can be chosen from either SMA , EMA , WMA , RMA, or HMA .
Multi Timeframe Bollinger BandsMulti Timeframe Bollinger Bands:
This script calculates and displays the Bollinger Bands for three different timeframes. The timeframes, moving averages and sigma values can be adjusted to personal likings. I publish this with an open visibility, feel free to tinker with it or suggest improvements.
Enjoy,
s0ullight

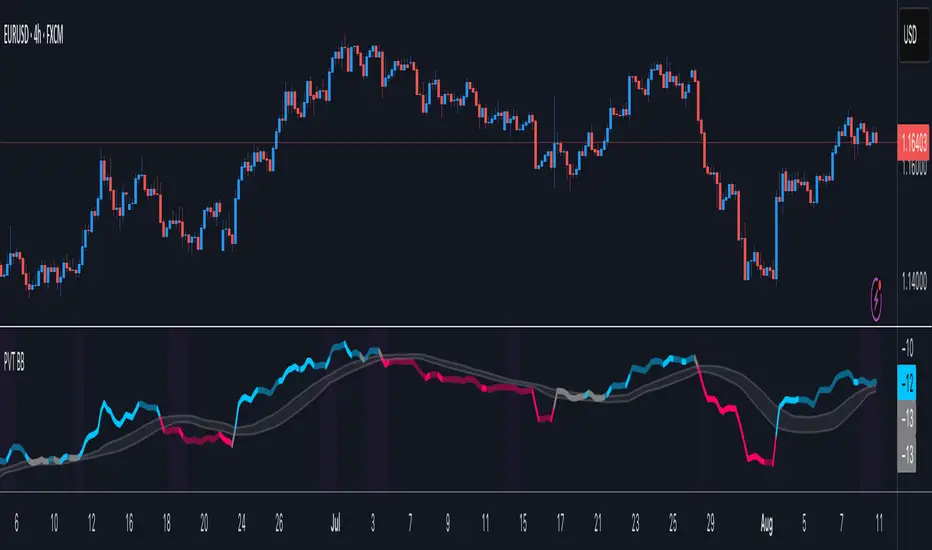
Price Volume Trend BBHey guys,
Ive been thinking about Price Volume Trend for a while and tried adding different moving averages to it, but seems its not as binary.
Therefore adding the bollinger bands as a no-trade-zone made it alot better. Indicator is pretty basic at the moment since I just implemented the idea but im planning to do some add-ons later on to make it easier to read.
Will keep you updated!
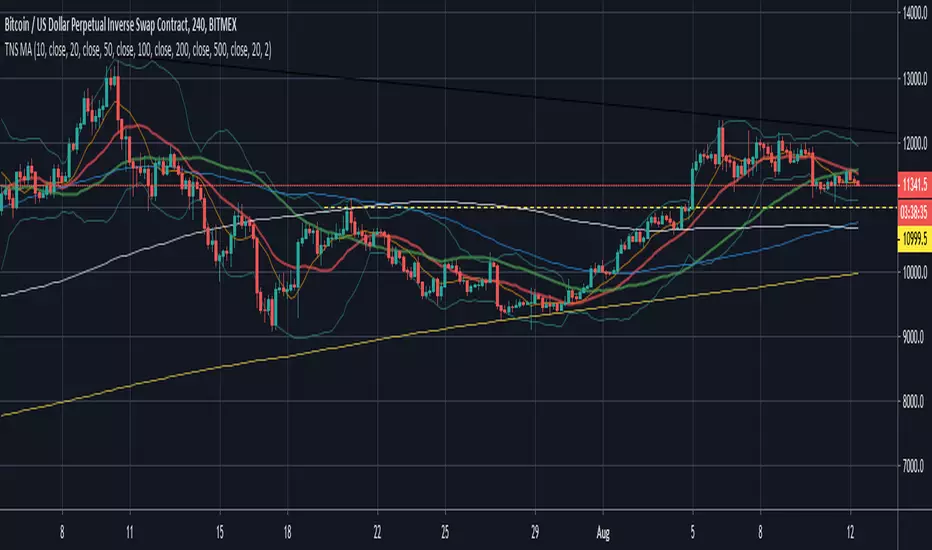
InfoPanel Indicators microtrendThis panel shows current value and trend of some well knonw indicators. It may be usefull because you have all indicators in one panel only.
thanks to: RicardoSantos for his script of panel coding
Tradingview scripts
Please use comment section for any feedback.

My Recursive Bands [ChuckBanger]This is a different type of bands. I modified Alex Pierrefeu Recursive Bands algo. It is a smoothed version of Alex's algo and imo it suites better for heikin ashi candles but it works well with regular candles.
How to use it:
When price hugs the upper band. It is a potential long and when price hugs the lower band it is a potential short.
Credits to Alex Pierrefeu: figshare.com

Breakout Notifier LONG NEW with wicksBreakout script with few changes that considers wick to close trades instead of using candle body like in the previous version

Breakout Notifier SHORT With wicksBreakout notifier with modifed version to close on wicks instead of candle body

EXZYLE:Pipsanee BB (development)This is the development version of the Exzyle/Pipsanee Bollinger Band Breakout indicator and alerts.
Bollinger Band breakouts are tagged with an arrow showing the direction they are heading.
The alerts trigger only on the first breakout.
This code also includes a MACD Retracement indicator.


Bollinger Bands + Polarity IndicatorAll the essential tools to execute these two amazing strategies:
1)BladeRunner Strategy, and
2)Bolly Band Bounce Trade Strategy

Seb's Multi timeframe indicatorsHello,
This is simple combined indicator i use to have 2 same indicators on 2 timeframes
BB 1 (default for current timeframe)
BB 2 (default current timeframe x4)
4xEMA (default 9, 50, 100, 200)
Ichimoku 1 (default for current timeframe)
Ichimoku 2 (default current timeframe x4)
Gaussian Channel (base on the one of Donovan Wall)
Maybe more to come.

DAKELAX-XRPUSDT Bollinger Band Strategy for TradebotlerDAKELAX-XRPUSDT is a Tradebotler strategy designed to run on XRPUSDT for binance, it's a simple reverse to mean strategy and when backtested on may-aug 2019 on H1 timeframe it performs pretty well in backtest as well as running live.
In order to get started install the Tradebotler extension and connect the strategy with Binance or other crypto exchanges of your choice such as Kraken, Bitstamp, Bitmex, Bittrex, Polyneux etc, etc.


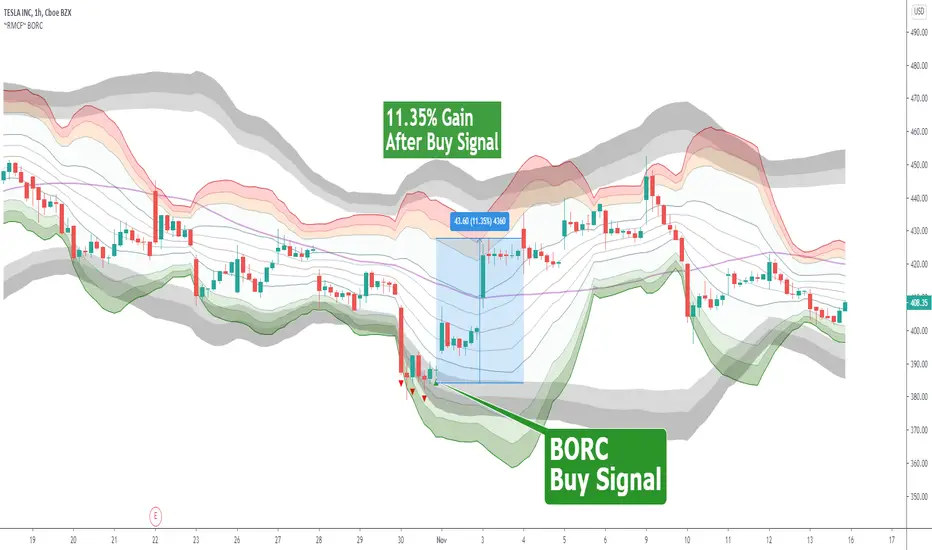
~RMCF~ BORC [with 17 page Annotated PDF with Example Charts]BORC, or Breakout Reversal Confirmation, is a signal based TV Indicator that analyzes multi-period price movements to determine when to enter in oversold and overbought tradeable assets. It works in any time frame and any type of security.
Green triangle means buy
Red Triangle means to get ready for the buy signal
$60 for lifetime access + complimentary PDF with example chart setups
DM @reaganmcf_ on twitter for more information and access
Bollinger Band Strategy (Basic) Version 1 This strategy is for learning purposes only. Pay special attention to these strategies on longer aggregation periods (like 1 hr chart or more). Don't expect accurate results when you set a limit to 10 cents above your entry to be accurate. For example if you set the chart to 1 day, the price may move down and hit a stop 10 times then tag your limit. If this doesn't make sense, just don't use strategies here. Learn more first. That being said, I don't have specific recommendations for each aggregation period, backtesting isn't always perfect.
Now then, this strategy can be used as the traditional BB method by setting the "Stop" and "Limit Out" to like 10000, check "Reversal Entry" and uncheck "Limit Time of Day" This will keep the strategy running just reverse your position when price crosses outside each band.
INPUTS:
Length - length of WMA that I used for mean of Bollinger Band (this may suppose to be SMA, too bad)
Source - O-H-L-C basis for WMA
Deviation - normal Standard deviation that would be set when using Bollinger Band
Trailing stop check box - your stop value will be either a hard stop or trailing stop for an exit
Stop - the stop value - remember you can set this really high and it won't stop out
Limit Out - the limit value for exit
Reversal Entry check box - This changes each entry from a reversal (traditional idea of BB) to enter a trend trade - hopefully version 2 will have choice to trend one direction and reversal in the other.
Limit Time of Day - Especially when trading futures, you may want to only trade a specific time of day, when this box is checked, you can set the entry times below, exit will still only occur based on limit/stop or a flip entry order (the opposite entry condition is met)
Tips:
when I don't know a thing about a price range, like gold. I can set the limit out to 10000 and play with a trailing stop to get a better idea of what is even possible before tuning further.

Makenai Chart Strategy Full(日本語による説明は こちら から)
Each hourly foot can display the moving average line for the same period of time in the same color.
The average moving line that you want to see is displayed by time leg, as well as the long-term Bollinger band that should be noticed by the time leg.
1. You can get a lot of useful information at a glance by displaying the moving average line of the long-term and period setting that many traders are aware of.
○ The period setting of the moving average line displayed in each time and foot is not fixed as usual, but changed the period by time and foot, and the moving average line of the same color is the same.
It is a moving average line of time (for example, an hourly average line and a four-hour average line).Therefore, the market price is always the same even if the time to see changes
You can see it on a scale.It doesn't happen when you look at it in five minutes, but when you look at it in four hours, it looks like a downward trend.
○ The sensitivity of the rate to the moving average line displayed is very high.
You can see how rate moves, such as trends, are determined, and you can see reality in abstract chart moves
I can feel it.Purple 24 hours (one day) moving average line with 1 minute to 4 hours of foot, Green 1 week moving average line with 5 minute to day.
The sensitivity to the Blue Monthly Movement Average Line, which is displayed from 5 mins to 5 weeks, and Red One Year Movement Average Line, which is displayed from 1 hour to 5 weeks, is very high.
Just look at whether the rates are moving up or down the moving average line and you'll be able to decide what to look for.
○ What is the positional relation between the moving average line of seven (eight in addition to the weekly moving average line) in the short, short, medium, medium, long, and long periods?
To make the direction and intensity of the trend easier to recognize, it is colored between moving averages to be visible as short- and medium-term clouds.
The three clouds changed color to warm rising clouds and cold falling clouds, depending on the relation of the moving averages.
·Strong upward trend rates when all clouds are unified in either upward or downward direction and are arranged in the order of short-term, medium-term or long-term clouds
·The thickness of the clouds is strong, and when the thickness is increased, the trend rate is strong.
·Trendless market when clouds overlap or the colors of the clouds are mixed
• Range price when rates are moving back and forth between clouds
You can visually and intuitively understand the market conditions, such as .
○ Short-term, short-term, medium- and short-term positional relationships will indicate the timing of the entry payment and the direction of the long-short.It's also written.
In conjunction with this, the duration for which the background color should be long changes to light warm color and warm color, and the duration for short changes to light cold and cold color.
2. The long-term Bollinger band is displayed so that you can trade with the higher time base than the time base you see.
○ You can ride on a long-term trend by detecting and entering the trend occurrence of long-term feet with short-term feet.
Buy high prices, sell low prices, relax your trend-follow-style tears, and enable stress-free entries.
○ A light, transparent gray filter is displayed between the long-term foot Bollinger band ±1σ which sets the period suitable for the time and foot.
I understand that while the rate is moving in this zone (called gray zone), it is difficult to trend and the price range is small, so it should not be taken care of.
Yes, you can use this filter to prevent deception when the volatility is not present, and if you are out of the filter, you can use the above sign.
By trading in accordance, you can invest in trend-follow tiles while avoiding losses in range markets.
○ Bolinger bands generally display six of ±1σ, ±2σ and ±3σ, but in this indicator, two are inside ±1σ and two are outside ±3σ.
We have added a total of four bands.The former sets up early entries and the latter sets up new reverse positions, expecting a market shift from overheating.
for tips on how to
○ Expansion period (expansion period) due to characteristics of the Bollinger band is a period when volatility is big for trade, and a squeeze period
(Shrinking period) I understand that the volatility is small and it is not suitable for trade.Also, it's a squeeze period, but it's not
You can seize investment opportunities by making you expect the timing to move from contraction to expansion and by watching.
※Valid time difference by series
Multi Time : 1 minute, 5 minutes, 15 minutes, 30 minutes 1 Hour, 4 Hour, Daily, Week (Total 8 Hours)
Long Time Span : 1 hour, 4 hour, daily, 4 long-term
Short Time Span : 1 minute, 5 minutes, 15 minutes, 30 minutes
Trial (1n & 1h) : 1 min.
※See here for details of the indicator and how to use it.
★ for "Indicator Grant" and "Market Analysis Information and Indicator Signature Distribution Service" by LINE Group (for a fee)
If you wish, please send a message on private chat
