TTP AbsolutnoAbsolutno is a pine script strategy for backtesting DCA bots with a different approach for placing both safety orders and take profit levels.
Motivation
Using DCA bots with safety orders most of the time is great during bull markets but in bear markets and strong downtrends it can be really challenging to close your deals only relying on safety orders placed based on percentages: price scale and volume scale.
In the past we introduced a script called "add funds simulator" that people used for sending alerts to bots to add funds and help closing deals in red.
We want to cross the use of TA with the safety orders with the intention of getting better results than statically placed safety orders.
What does Absolutno do?
Absolutno uses TA for safety orders, both for opening new safety orders and also to define how low they should be placed based on the volatility of the asset.
Main features
- ATR SO mode: Safety orders can be placed dynamically based on the general volatility of the asset plus the current volatility.
- TA based SO entries: Safety orders are only placed when the deal start condition is true not only when the price pulls back below the next safety order price level. This acts like a hybrid between "add funds simulator" and a traditional DCA bot. Once a safety order is filled, the next SO level gets active waiting for a DSC to trigger below the new entry level.
- Take profit scale: Traditional DCA bots offer a percentage or TA based exit conditions. Absolutno offers a new mode when you can decide to increase or decrease the TP level with each SO getting filled. For example a value of 1.1 TP scale will cause that each SO getting filled makes the TP% grow 10%. A value of 0.9% will reduce each SO by 10%. The lower the price goes you can "lower your expectation", or if you are filling bullish you can actually increase it.
External signal
It comes with a built-in deal start condition that uses RSI cross over 30 which is used only for illustration purposes since Absolutno is designed to be used with external signals.
Use any external signal to enter a new deal and for adding new safety orders.
You can also activate external take profit signal.
When external TP is enabled, all TP features from the bot are disabled to only react to what the external signal instructs the bot.
Bot integration and alerts
Three type of alerts will be sent to the bot: open deal, add funds and close deal.
You will need to enter your bot id and email token in the settings.
Since this strategy uses add funds: you must be aware that the alerts sent from this strategy will contain the amount of funds to add and therefore the bot receiving these alerts will respect them EVEN if the bot was defined with different SO sizes.
Please make sure you fully understand this before using this signal.
The base order alerts don't contain funds information so the bot will always use the base order size as defined in its own settings.
ابحث في النصوص البرمجية عن "bot"
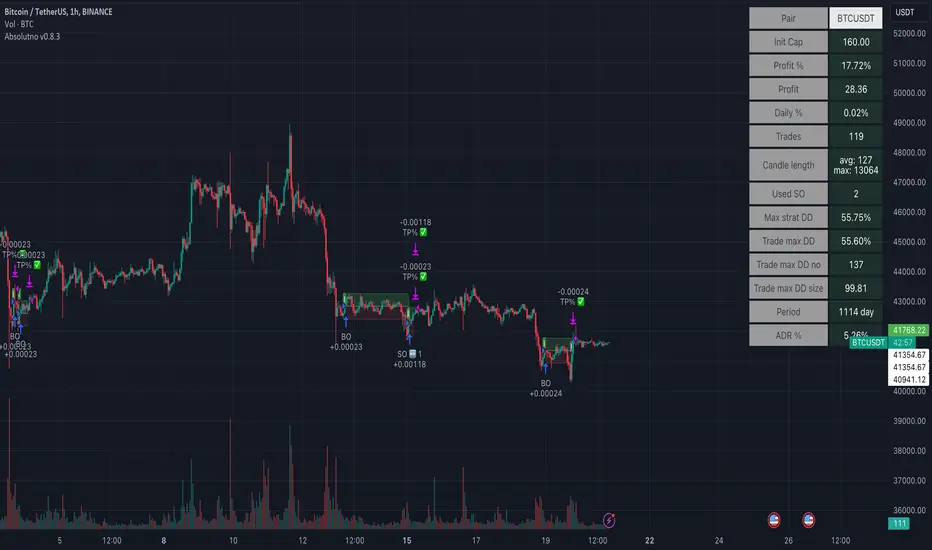
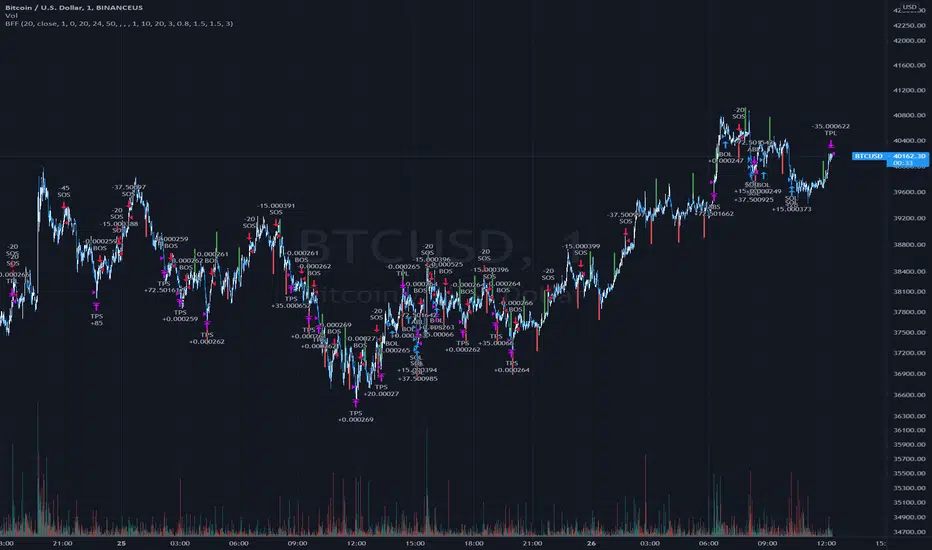
MACD/RVSI/Stoch/RSI/EXP(Drawdown)I have been trying for several months to get a script to work on the 1min and this one gives some good backtest results. This script will also work on higher timeframes however, I've not extensively tested on higher timeframes. My aim was to get results on about 20 crypto coins then run the 1min bots in parallel looking for small frequent profits across all the coins. If you would like me to try and fit backtest results to any coin or pair on any timeframe please do get in touch anytime.
It's based on several indicators which are combined and then a newish way for the stop loss to implement based on an exponential rising which limits the time in each trade unless the price moves in the direction of the trade. The other useful feature is drawdown minimization which previously made all of my 1minute bot attempts non-practical due to differences between backtesting and actually running the bot(s) live.
Its possible at the top to paste in strategy comments which can be used through web-hooks for auto trading bots. Leaving these blank just defaults to the pre-programmed comments that provide some indication of why a trade was exited.
It is possible to select for Short and/or Long trades. Note however, that there are exponential markers on the charts for both long and short trades in any setting. I found that this way the bot worked well with regards to timing.
The next part of the user interface settings gets a bit tricky so try and use the sample parameters provided below. For example, select a crypto coin then try some of the options below until a reasonable backtest result in obtained (or select the best from the parameter groups tested) then move down the settings interface to optimise with the remaining settings.
So 'Use MACD/RVSI', 'RSI clause' and 'Use Stochastic' are set to true for the below sample settings (1min timeframe).
MACD/RVSI Confluence Resolution (1min, 2min, 5min, 10min, 1hour)
Timeframe RSI (1min, 2min, 3min, 15min, 1hour)
FastStoch, SlowStoch (1min, 45min: 5min, 30min: 1min, 1hour: 5min, 1hour)
Eg. for FTX:ETHPERP (MACD/RVSI Confluence Resolution=1hour, Timeframe RSI= 1min, FastStoch = 1min, SlowStoch = 45min)
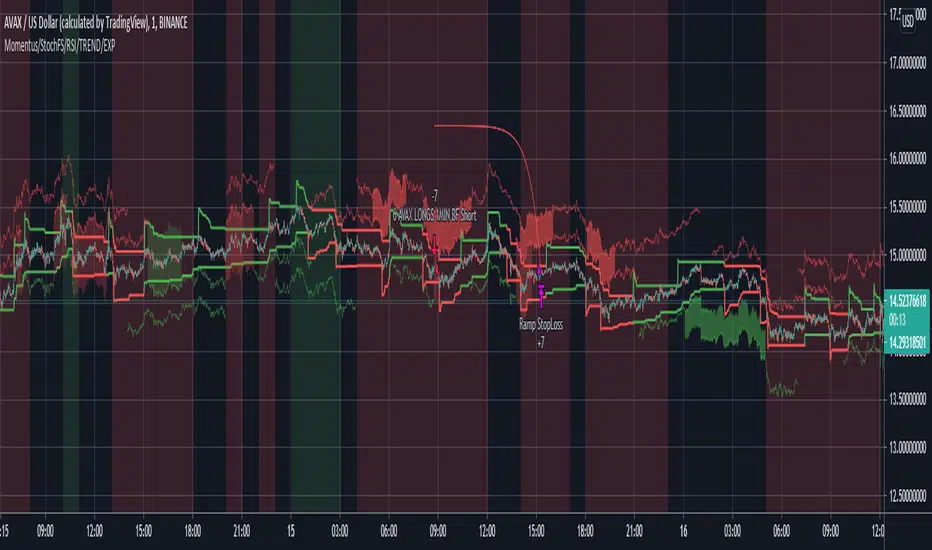
Setting the timings is tricky - there is a lot going on. Have a look at the chart and select/deselect the options. The MACD/RVSI Confluence Resolution shows red and green vertical regions on the chart background. The Timeframe RSI colors the candle bodies red and green. These go green if the RSI crossed over 31% or red in the RSI crossed under 69%. The MACD/RVSI Confluence Resolution is explained in more detail in one of my other scripts. Then the Slow Stoch colors above and below the price action with red or green lines depending if on an uptrend or downtrend (approximately). Where there is also an up/down trend on the faster timeframe stoch there are vertical shaded fill regions between the slow stop above/below lines.
With all the above conditions selected to represent the data (looking at strategy backtest results whilst adjusting) there is a reasonable approximation to a credible trade.
So once an ok backtest result is obtained by selecting timing settings. Its ontot the Stop Ramp Settings. This is an exponential line which rises rapidly after a period of time thus exiting the trade or going upwards with the trade. It kind of limits the maximum time a trade will stay in position which forms part of the timing aspect of this bot. Look at the chart exponential red lines and adjust the settings, along with the backtest results to select a good timing.
Then its the Drawdown Catcher and the Take Profit Setting. Start with the drawdown catcher disabled i.e. set to zero. Put in a conservative Take Profit, for example if a Take Profit at 6% gives the best backtest results, go for 4% to account for differences between backtest results and actual live bot performance.
Then start to increase the Drawdown Catcher. This shades a lime region where the bot will not enter a trade. I found that with most trades using this bot, if the price action moved in the direction of the trade (long or short) at the onset - this gave most of the good results (high probability of positive trade). Also if a trade entered at the start price and when south, the accumilated drawdown from these failing trades made all previous 1min bot attempt non=profitable in practice (even with good backtest results). The exp timing and also this drawdown reduction strategies seem to be the thing which makes this approach credible.
Try to go for settings that give a very high change of positive trade. For example, an 85% profitable trades will probably provide say 55% positive trades in practice as its always highly possible to just fit the parameters to the exact position/trade timings - and in reality going forwards these don't play out the same. Also a Profit Factor of 2 is about the minimum I would accept - again this provides for example a Profit Factor of 1.2 in practive.
However all being said - I think its possible with this bot on the 1min across lots of coins - with regularly updating settings - to make profits. (Not financial advice)
Please do get in touch if you would like me to fit this bot to anytimeframe to any trade.
MoonFlag PhD
[laoowai]BNB_USDT_3m_3Commas_Bollinger_MACD_RSI_StrategyBNB_USDT _3m
Release Notes:
Time: 3min
Pair: BNB_USDT
Use: {{strategy.order.alert_message}}
What's the difference with 3Commas Bollinger Strategy by tedwardd:
1. Initial capital: 1210 USDT (10$ Base order / 400$*3 Safety order), if you will change, please change JUST safety order volume or number of safety orders 2-3
2. Using just 2(3) safety order (original script 4)
3. More high-performance strategy for BNB_USDT
4. Using MACD to sell order (original script take profit by scale), thanks Drun30 .
5. Using RSI to analyze the market conditions.
Need to change:
bot_id = input(title="3Commas Bot ID", defval=" YOUR DATA ")
email_token = input(title="Bot Email Token", defval=" YOUR DATA ")
---------------------------------------------------------------------------------------------------------------------------------------------------------------------------------------------------
FAQ copy from tedwardd
---------------------------------------------------------------------------------------------------------------------------------------------------------------------------------------------------
This strategy is intended for use as a way of backtesting various parameters available on 3commas.
The primary inputs for the strategy are:
---------------------------------------------------------------------------------------------------------------------------------------------------------------------------------------------------
// USER INPUTS
Short MA Window - The length of the Short moving average
Long MA Window - The length of the Long moving average
Upper Band Offset - The offset to use for the upper bollinger offset
Lower Band Offset - The offset to use for the lower bollinger offset
Long Stop Loss % - The stop loss percentage to test
Long Take Profit % - The Take profit percentage to test
Initial SO Deviation % - The price deviation percentage required to place to first safety order
Safety Order Vol Step % - The volume scale to test
3Commas Bot ID - (self-explanatory)
Bot Email Token - Found in the deal start message for your bot (see link in the previous section for details)
3Commas Bot Trading Pair - The pair to include for composite bot start deals (should match the format of 3commas, not TradingView IE. USDT_BTC not BTCUSDT )
---------------------------------------------------------------------------------------------------------------------------------------------------------------------------------------------------
Start Date, Month, Year and End Date, Month, and Year all apply to the backtesting window. By default, it will use as much data as it can give the current period select (there is less historical data available for periods below 1H) back as far as 2016 (there appears to be no historical data on Trading view much before this). If you would like to test a different period of time, just change these values accordingly.
---------------------------------------------------------------------------------------------------------------------------------------------------------------------------------------------------
Composite bot using a Bollinger band type trading strategy. While its primary intention is to provide users a way of backtesting bot parameters, it can also be used to trigger a deal start by either using the {{strategy.order.alert_message}} field in your alert and providing the bot details in the configuration screen for the strategy or by including the usual deal start message provided by 3commas.
---------------------------------------------------------------------------------------------------------------------------------------------------------------------------------------------------
Original script:
1. 3Commas Bollinger Strategy by tedwardd
2. Momentum Strategy ( BTC /USDT; 1h) - MACD (with source code) by Drun30

[3Commas] Turtle StrategyTurtle Strategy
🔷 What it does: This indicator implements a modernized version of the Turtle Trading Strategy, designed for trend-following and automated trading with webhook integration. It identifies breakout opportunities using Donchian channels, providing entry and exit signals.
Channel 1: Detects short-term breakouts using the highest highs and lowest lows over a set period (default 20).
Channel 2: Acts as a confirmation filter by applying an offset to the same period, reducing false signals.
Exit Channel: Functions as a dynamic stop-loss (wait for candle close), adjusting based on market structure (default 10 periods).
Additionally, traders can enable a fixed Take Profit level, ensuring a systematic approach to profit-taking.
🔷 Who is it for:
Trend Traders: Those looking to capture long-term market moves.
Bot Users: Traders seeking to automate entries and exits with bot integration.
Rule-Based Traders: Operators who prefer a structured, systematic trading approach.
🔷 How does it work: The strategy generates buy and sell signals using a dual-channel confirmation system.
Long Entry: A buy signal is generated when the close price crosses above the previous high of Channel 1 and is confirmed by Channel 2.
Short Entry: A sell signal occurs when the close price falls below the previous low of Channel 1, with confirmation from Channel 2.
Exit Management: The Exit Channel acts as a trailing stop, dynamically adjusting to price movements. To exit the trade, wait for a full bar close.
Optional Take Profit (%): Closes trades at a predefined %.
🔷 Why it’s unique:
Modern Adaptation: Updates the classic Turtle Trading Strategy, with the possibility of using a second channel with an offset to filter the signals.
Dynamic Risk Management: Utilizes a trailing Exit Channel to help protect gains as trades move favorably.
Bot Integration: Automates trade execution through direct JSON signal communication with your DCA Bots.
🔷 Considerations Before Using the Indicator:
Market & Timeframe: Best suited for trending markets; higher timeframes (e.g., H4, D1) are recommended to minimize noise.
Sideways Markets: In choppy conditions, breakouts may lead to false signals—consider using additional filters.
Backtesting & Demo Testing: It is crucial to thoroughly backtest the strategy and run it on a demo account before risking real capital.
Parameter Adjustments: Ensure that commissions, slippage, and position sizes are set accurately to reflect real trading conditions.
🔷 STRATEGY PROPERTIES
Symbol: BINANCE:ETHUSDT (Spot).
Timeframe: 4h.
Test Period: All historical data available.
Initial Capital: 10000 USDT.
Order Size per Trade: 1% of Capital, you can use a higher value e.g. 5%, be cautious that the Max Drawdown does not exceed 10%, as it would indicate a very risky trading approach.
Commission: Binance commission 0.1%, adjust according to the exchange being used, lower numbers will generate unrealistic results. By using low values e.g. 5%, it allows us to adapt over time and check the functioning of the strategy.
Slippage: 5 ticks, for pairs with low liquidity or very large orders, this number should be increased as the order may not be filled at the desired level.
Margin for Long and Short Positions: 100%.
Indicator Settings: Default Configuration.
Period Channel 1: 20.
Period Channel 2: 20.
Period Channel 2 Offset: 20.
Period Exit: 10.
Take Profit %: Disable.
Strategy: Long & Short.
🔷 STRATEGY RESULTS
⚠️Remember, past results do not guarantee future performance.
Net Profit: +516.87 USDT (+5.17%).
Max Drawdown: -100.28 USDT (-0.95%).
Total Closed Trades: 281.
Percent Profitable: 40.21%.
Profit Factor: 1.704.
Average Trade: +1.84 USDT (+1.80%).
Average # Bars in Trades: 29.
🔷 How to Use It:
🔸 Adjust Settings:
Select your asset and timeframe suited for trend trading.
Adjust the periods for Channel 1, Channel 2, and the Exit Channel to align with the asset’s historical behavior. You can visualize these channels by going to the Style tab and enabling them.
For example, if you set Channel 2 to 40 with an offset of 40, signals will take longer to appear but will aim for a more defined trend.
Experiment with different values, a possible exit configuration is using 20 as well. Compare the results and adjust accordingly.
Enable the Take Profit (%) option if needed.
🔸Results Review:
It is important to check the Max Drawdown. This value should ideally not exceed 10% of your capital. Consider adjusting the trade size to ensure this threshold is not surpassed.
Remember to include the correct values for commission and slippage according to the symbol and exchange where you are conducting the tests. Otherwise, the results will not be realistic.
If you are satisfied with the results, you may consider automating your trades. However, it is strongly recommended to use a small amount of capital or a demo account to test proper execution before committing real funds.
🔸Create alerts to trigger the DCA Bot:
Verify Messages: Ensure the message matches the one specified by the DCA Bot.
Multi-Pair Configuration: For multi-pair setups, enable the option to add the symbol in the correct format.
Signal Settings: Enable the option to receive long or short signals (Entry | TP | SL), copy and paste the messages for the DCA Bots configured.
Alert Setup:
When creating an alert, set the condition to the indicator and choose "alert() function call only".
Enter any desired Alert Name.
Open the Notifications tab, enable Webhook URL, and paste the Webhook URL.
For more details, refer to the section: "How to use TradingView Custom Signals".
Finalize Alerts: Click Create, you're done! Alerts will now be sent automatically in the correct format.
🔷 INDICATOR SETTINGS
Period Channel 1: Period of highs and lows to trigger signals
Period Channel 2: Period of highs and lows to filter signals
Offset: Move Channel 2 to the right x bars to try to filter out the favorable signals.
Period Exit: It is the period of the Donchian channel that is used as trailing for the exits.
Strategy: Order Type direction in which trades are executed.
Take Profit %: When activated, the entered value will be used as the Take Profit in percentage from the entry price level.
Use Custom Test Period: When enabled signals only works in the selected time window. If disabled it will use all historical data available on the chart.
Test Start and End: Once the Custom Test Period is enabled, here you select the start and end date that you want to analyze.
Check Messages: Check Messages: Enable this option to review the messages that will be sent to the bot.
Entry | TP | SL: Enable this options to send Buy Entry, Take Profit (TP), and Stop Loss (SL) signals.
Deal Entry and Deal Exit: Copy and paste the message for the deal start signal and close order at Market Price of the DCA Bot. This is the message that will be sent with the alert to the Bot, you must verify that it is the same as the bot so that it can process properly.
DCA Bot Multi-Pair: You must activate it if you want to use the signals in a DCA Bot Multi-pair in the text box you must enter (using the correct format) the symbol in which you are creating the alert, you can check the format of each symbol when you create the bot.
👨🏻💻💭 We hope this tool helps enhance your trading. Your feedback is invaluable, so feel free to share any suggestions for improvements or new features you'd like to see implemented.
__
The information and publications within the 3Commas TradingView account are not meant to be and do not constitute financial, investment, trading, or other types of advice or recommendations supplied or endorsed by 3Commas and any of the parties acting on behalf of 3Commas, including its employees, contractors, ambassadors, etc.

PYRAMIDING BTCUSDTPERP1H [ALERTS VERSION]BINANCE:BTCUSDTPERP
Hello
This my upgraded (ALERTs) version of my previous bots, uses diffrent indicators
WARING
THIS STRATEGY WORKS ONLY ON BTCUSDTPERP ON BINANCE 60MIN (like my previous ones) !!!!!!!!!!!!!!!!!!!!!!!!!!!!!!!!!!!!!!!!!!!!!!!!!!!!!!!!!!!!!!!!!!!!!!!!!!!!!!!!!!!!!!!!!!!!!!!!!!!!!!!!!
- it depends on specyfic volume and wick based on binance
Soo, I was tried to make a bot with more trades to make more real results.
Trends are change, and the problem with configuration on bots is that, while we searching the best cofigurations , this was best configuration in the past,
to prepare bot for the futures moves , we have to make as much trades as possible.
This bot is pure definition of pyramiding, uses 2 entries, and when all the conditions are true, then will open a trades
The way it works is simple, bot use 6 difrent indicators to open longs/shorts and for the define trend
This specific configuration works the best at
TP: 1.4%
SL: 9%
This is bot only for lev 1x
Dont try it for bigger leverage, becouse when sl hits, which sometimes happend, the lost will be huge
Why sl is so big?
Bot is programed to replace sl with other entries
for example
close longs and open shorts
normal lose is around 3-5% (while trend is changed), so sl will only destroys results
this bot using 6 difrent indicators:
ADX
RSI
VOLUME
RANGE FILTER
MA 5-10-30
MACD by KivancOzbilgic
ADX - makes a solid view to trend without any scam wick :
Long only on green bars
Shorts only on red bars
That's helps my strategy to define a right trend
there is also a orange option for unidentified trends
RSI - value helps strategy to stop trade in right time
When RSI is overbought strategy don't open new longs
also when RSI is oversold strategy don't open new shorts
Volume - volume is the most important indicator for the strategy,
to avoid open trades on flat chart, new trades are open after a strong volume
wicks
RANGE FILTER- this indicator is for the better view of trends, define trends
MA 5-10-30 - like previous ones this is for better view of trends, and correctly define the trends
MACD by KivancOzbilgic - this indicator is based of MACD RELOADED by Kivanc Ozbilgic
Also like previous ones, indicator should help defined correct trends
Enjoy ;)
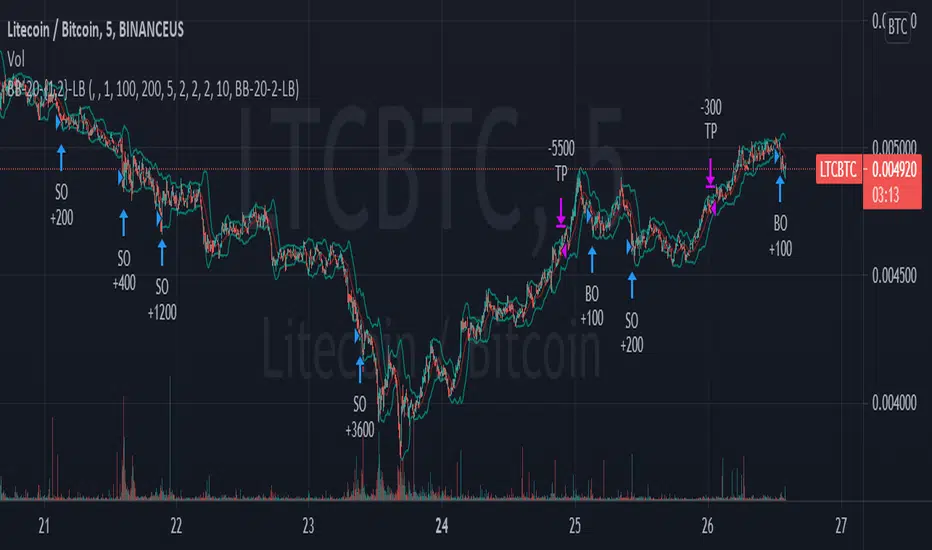
TA Presets - BB-20-1-LBThis is a near identical drop-in replacement for the 3commas TA Presets - BB-20-1-LB signal. Since you can not get this signal unless you are using Binance.com, I needed to produce my own for use with other exchanges. You are free to use this strategy yourself. It will always remain publicly available for free as there are no special tricks here, just your basic Bollinger Band strategy.
Known Issues and Limitations:
Trailing take profits are currently not supported for back testing -- You can still use them on a bot that uses this signal to trigger deal starts, just don't expect the performance of the bot to be the same as what's in the backtest if you do.
Only simple bots supported (no composite bot support yet)
Instructions
The options in the configuration screen are the same as they would be on the bot configuration screen. You can use the back testing screen to get a general idea of how the bot should perform on a given coin pair. Once you have the settings how you want, set the "Bot ID" and "Email Token" fields. to match those used in the deal start message for your bot. Do not include quotes around either of them. Your bot ID should just be a string of numbers and your email token will be a string of letters and numbers separated by hyphens. Once you enter these in to the settings, you can create your alert. Select "BB-20-1-LB" from the dropdown on the alert screen and type {{strategy.order.alert_message}} in the text box (NOTHING ELSE, NO QUOTES, NOTHING). That's it, the script will generate the rest of the deal start message for you automatically.
Important Notes
This may go without saying but make sure that you are using the chart for your exchange when setting this up to control a bot. While it may look like prices are the same across the different exchanges, subtle differences in volatility and trading volume WILL make a difference and your bot WILL NOT perform as shown on the back test.
3Commas Bollinger StrategyThis strategy is intended for use as a way of backtesting various parameters available on 3commas.io composite bot using a bollinger band type trading strategy. While it's primary intention is to provide users a way of backtesting bot parameters, it can also be used to trigger a deal start by either using the {{strategy.open.alert_message}} field in your alert and providing the bot details in the configuration screen for the strategy or by including the usual deal start message provided by 3commas. You can find more information about how to do this from help.3commas.io
The primary inputs for the strategy are:
// USER INPUTS
Short MA Window - The length of the Short moving average
Long MA Window - The length of the Long moving average
Upper Band Offset - The offset to use for the upper bollinger offset
Lower Band Offset - The offset to use for the lower bollinger offset
Long Stop Loss % - The stop loss percentage to test
Long Take Profit % - The Take profit percentage to test
Initial SO Deviation % - The price deviation percentage required to place to first safety order
Safety Order Vol Step % - The volume scale to test
3Commas Bot ID - (self explanatory)
Bot Email Token - Found in the deal start message for your bot (see link in previous section for details)
3Commas Bot Trading Pair - The pair to include for composite bot start deals (should match format of 3commas, not TradingView IE. USDT_BTC not BTCUSDT)
Start Date, Month, Year and End Date, Month and Year all apply to the backtesting window. By default it will use as much data as it can given the current period select (there is less historical data available for periods below 1H) back as far as 2016 (there appears to be no historical data on Trading view much before this). If you would like to test a different period of time, just change these values accordingly.
Known Issues
Currently there are a couple of issues with this strategy that you should be aware of. I may fix them at some point in the future but they don't really bug me so this is more for informational purposes than a promise that they may one day be fixed.
Does not test trailing take profit
Number of safety orders and Safety Order Step Scale are currently not user configurable (must edit source code)
Using the user configuration to generate deal start message assumes you are triggering a composite bot, not a simple bot.

BUY/SELL Multi-Factor Decision Engine (v8) WebhookBUY / SELL Multi-Factor Decision Engine (v8) — Webhook
Important Notice
This indicator is not financial advice, does not guarantee results, and does not eliminate losses.
It is not a bot, not an oracle, and does not replace experience, risk management, or human judgment.
It is a tool for reading, filtering, and organizing market information.
1. What is this indicator?
BUY / SELL Multi-Factor Decision Engine (v8) — Webhook is a technical analysis indicator that:
analyzes multiple indicators at the same time,
evaluates structure, momentum, pressure, and context,
generates BUY / SELL signals when sufficient intent exists,
displays two state semaphores (BAS and CTX),
concentrates complex information into a compact panel,
is highly configurable from the settings panel (almost the entire indicator is configurable, including parameters, thresholds, profiles, and tolerances, allowing significant modification of the indicator’s behavior),
can generate alerts and signals via Webhook.
It does not execute trades.
It does not promise consistent wins.
It does not eliminate risk.
2. What does it actually do?
This indicator does NOT work with simple rules such as:
“RSI above X = buy”
“Moving average crossover = entry”
It also does not wait for everything to be perfect at the same time.
It works as follows:
It evaluates market intent using several indicators simultaneously.
It builds a LONG probability and a SHORT probability.
Intent may exist even if some indicators are neutral.
When intent exceeds a minimum configurable threshold, a BUY or SELL is generated internally.
That signal is only shown if the market is moving enough (ATR filter).
Important note:
ATR does NOT participate in the BUY / SELL decision.
ATR only decides whether existing intent:
is shown on screen,
triggers an alert,
or is sent via Webhook.
In parallel, risk context (CTX) is evaluated and displayed as a warning.
CTX does not participate in the BUY / SELL decision; it only informs about risk.
All analyzed information (EMAs, MACD, RSI, CMF, ADX/DI, BBP, SMC, candles, patterns, sweeps, EQs) is displayed in a compact panel, including the direction they appear to indicate.
BUY / SELL is not an order; it is a visual synthesis of a complex reading.
3. Market Intent (main engine)
This is where BUY or SELL is born.
Intent is calculated using classic indicators, but they are not read as textbook values, rather as behavior.
The engine does not ask:
“Is it above or below X?”
It asks things like:
Is the market pushing or losing strength?
Is momentum accelerating or exhausting?
Is there real pressure or just a bounce?
Does structure support or contradict the move?
Because of this, the indicator may:
anticipate classic signals,
maintain intent while something is neutral,
fail,
arrive early or late.
This is normal in any probabilistic system.
Nothing in the market is certain.
BUY and SELL signals:
are not orders,
are not imperative instructions,
must not be interpreted as mandatory entries or exits,
and do not replace market reading or the trader’s own analysis.
BUY / SELL is:
a visual synthesis of a complex reading,
a probabilistic representation of intent,
a decision-support tool,
not a mandate or a guarantee.
4. Indicators that form intent (interpretation and weight)
The intent engine works on an accumulated score.
Each indicator adds evidence, not orders.
EMAs — weight: 2 points
Measure structure and dynamic direction.
Evaluates:
slope,
speed,
relationship between them.
LONG intent may exist before a classic crossover.
MACD — weight: 2 points
Measures momentum and acceleration.
Not used as a “magic crossover”.
Evaluates:
whether momentum accelerates or weakens,
whether it accompanies price.
RSI — weight: 1 point
Not used as overbought/oversold.
Interpreted as:
direction of pressure,
gain or loss of relative strength.
CMF (Chaikin Money Flow) — weight: 1 point
Evaluates money flow.
Helps distinguish:
supported moves,
empty moves.
ADX + DI — weight: 2 points
Evaluates:
whether there is real trend,
who dominates (buyers or sellers),
whether the move has a foundation.
BBP (Bull/Bear Power) — weight: 1 point
Evaluates buying vs selling pressure.
Helps detect:
control,
exhaustion.
SMC (BOS / CHOCH) — weight: 3 points
Evaluates market structure:
continuity (BOS),
change of character (CHOCH).
Not decorative.
It has the highest individual weight in the engine.
Important:
Bias does not have a 3-point weight.
SMC only adds 3 points when a BOS or CHOCH event appears in the panel.
While only Bias is present, it adds 0 points, because there is no event.
Therefore, the intent threshold depends on the other indicators until a BOS or CHOCH occurs.
Important
The engine does not require unanimity.
It requires sufficient intent (sum of points ≥ configured threshold).
5. BAS Semaphore (intent state)
The BAS semaphore summarizes the state of the intent engine:
🟢 Green → solid intent
🟡 Yellow → weak or transitioning intent
🔴 Red → deteriorated or risky intent
BAS:
is linked to BUY / SELL,
reflects intent quality,
does not automatically cancel a signal.
It helps evaluate trade health, not blind obedience.
6. Operability (ATR Gates)
ATR:
does NOT generate BUY or SELL,
does NOT decide direction.
ATR only answers:
Is the market moving enough for this intent to be operational?
Therefore intent may:
exist,
but not be shown,
not trigger alerts,
not be sent via Webhook.
This avoids:
trading dead ranges,
signal spam,
micro-moves without continuity.
ATR Profiles (timeframe)
Included ATR profiles:
Scalp (2m / 5m)
Intraday (15m / 30m)
Swing (1H – 4H)
Position (1D / 1W / 1M / 3M)
STANDARD (editable)
Profiles only adjust operability filtering.
They do not change direction or the intent engine.
Recommendation:
Use the profile matching your timeframe or edit STANDARD according to your criteria.
7. Engine Profiles
The indicator also includes Engine profiles.
The Engine STANDARD is editable by the user.
Predefined Engine profiles are NOT editable.
They are calibrated as coherent parameter sets.
This avoids common mistakes such as:
scalping EMAs with swing RSI,
mixing incompatible indicator ranges.
Modifying fixed profiles breaks internal coherence.
8. Context (CTX)
Context does NOT participate in BUY / SELL decisions.
It adds no points.
It subtracts no points.
It does not block signals.
It warns about risk.
Evaluates, among other things:
liquidity sweeps,
Equal Highs / Equal Lows (EQ),
candle types,
chart patterns (forming or confirmed).
CTX semaphore:
🟢 relatively clean environment
🟡 transition / caution
🔴 high-risk environment
A BUY with red CTX is not invalid, but riskier.
In CTX, fewer marks is generally better.
9. What is shown on screen
The indicator can show:
BUY / SELL
Compact panel with:
BAS
CTX
indicator readings
L / S labels on the chart
Labels:
L → Long
S → Short
10. Abbreviations (panel key)
Candles
Doji → Doji
LLDoji → Long-legged Doji
Eng → Engulfing
Maru → Dominant no-wick candle
Hammer → Hammer
InvHam → Inverted Hammer
Shoot → Shooting Star
Hang → Hanging Man
BD Slot (strength / indecision)
DD → strong indecision
D → indecision
BE↑ / BE↓ → bullish / bearish engulfing
B↑ / B↓ → dominant candle
Chart Patterns
H&S → Head & Shoulders
iH&S → Inverse H&S
DT / DB → Double Top / Bottom
RWdg / FWdg → Rising / Falling Wedge
RChnl / FChnl → Rising / Falling Channel
SymTri / AscTri / DescTri → Triangles
Comp → Compression
Stage:
F → Forming
C → Confirmed
11. Configuration (very important)
Parameters are not decorative.
Modifying:
EMAs
RSI
MACD
CMF
ADX / DI
BBP
ATR
intent threshold
profiles
context tolerances
changes the real behavior of the engine.
Important:
Adjusting a single parameter in isolation is generally not recommended.
If one value changes, the set should usually be adjusted to avoid incompatible ranges.
Example:
EMA 10/20 ≠ EMA 15/30 ≠ EMA 10/50
Same applies to all indicators.
12. BUY / SELL, Alerts and Webhook
The indicator does not execute trades.
It is used to:
trade manually,
receive alerts,
send signals to Telegram or other systems,
automate only if the user builds their own bot.
The indicator only sends structured information.
Execution is:
external,
user-decided,
user-responsibility.
13. How I use it (creator’s criteria)
I do not rely solely on the indicator, and no one should.
I still read:
each individual indicator,
candle patterns,
chart patterns,
sweeps,
EQs,
structure and overall context.
The indicator does not replace my reading — it confirms it.
I use it to:
consolidate scattered information,
decide faster,
reduce visual noise,
avoid impulsive entries.
It is support, not a substitute for judgment.
DISCLAIMER
Important Notice – read carefully
As stated throughout this document, BUY / SELL Multi-Factor Decision Engine (v8) — Webhook is a technical analysis tool and does not constitute financial advice, investment recommendations, or a guarantee of results.
This indicator:
does not predict the future,
does not guarantee profits,
does not eliminate losses,
does not reduce market risk,
and does not replace experience, human judgment, risk management, or the learning curve required to trade.
BUY / SELL Multi-Factor Decision Engine:
is not a bot,
is not an automated system,
is not an oracle,
does not execute trades,
and does not make decisions for the user.
BUY and SELL signals:
are not orders,
are not imperative instructions,
must not be interpreted as mandatory entries or exits,
and do not replace market reading or personal analysis.
BUY / SELL is:
a visual synthesis of a complex reading,
a probabilistic representation of intent,
a decision-support tool,
not a mandate or a guarantee.
Nature of the indicator and the market
This indicator reads information, not outcomes.
It interprets what the market — and specifically TradingView — shows at each moment: indicators, structure, patterns, candles, sweeps, EQs, momentum, and context.
That a LONG or SHORT intent forms, a BUY or SELL signal triggers, and the market later does not move in that direction does not mean the indicator failed.
This happens because:
the market may show intent and later invalidate it,
new orders may enter,
liquidity may change,
context may deteriorate.
This is exactly why even very experienced traders lose trades.
The indicator always interprets information the same way, but it has no more information than what is publicly available.
It does not see the future, hidden orders, or external events.
A failed signal is not an indicator error — it is the probabilistic and uncertain nature of the market.
Parameter configuration
Users may modify parameters, thresholds, profiles, and tolerances.
Doing so changes the actual behavior of the engine, not just appearance.
Modifying a single parameter in isolation is generally not recommended.
Changing one value often requires adjusting the whole set to avoid incoherent ranges.
The intent-based logic does not change, but results can be altered if ranges are modified inconsistently.
Alerts and Webhook usage
This indicator can generate alerts and send signals via Webhook to external systems (bots, servers, messaging platforms, execution systems).
The Webhook only transmits information generated when internal conditions are met.
The indicator does not execute trades, control external systems, or validate user actions.
Any automation, bot, script, server, or system receiving these signals:
is external to the indicator,
is built, configured, and operated by the user,
and operates under the user’s full responsibility.
The creator is not responsible for:
automated executions,
programming errors in external bots or scripts,
connectivity failures,
duplicate orders,
delays,
losses derived from automation,
or decisions made from Webhook signals.
Using Webhook does not turn this indicator into a bot or automated system.
Webhook is only a communication channel.
Final Statement
Neither this indicator, nor any other indicator, nor any bot:
predicts the future,
guarantees profits,
or prevents losses.
Anyone claiming otherwise is lying.
This indicator is designed as a support tool to:
organize information,
reduce noise,
improve market reading,
and help make more conscious decisions,
not to eliminate risk or replace human judgment.
The creator of BUY / SELL Multi-Factor Decision Engine (v8) — Webhook assumes no responsibility for any loss, economic damage, financial harm, or negative consequence resulting from the use of this indicator.
This includes, but is not limited to, use:
manual,
semi-automated,
automated,
via alerts,
via Webhook,
via bots, scripts, servers, APIs, or any external system.
Any decision made using this indicator:
is solely the user’s responsibility,
made under their own judgment,
and at their own risk.
Using this indicator implies explicit acceptance that:
trading involves risk,
losses are possible,
and the creator assumes no direct or indirect liability for adverse results, misinterpretation, incorrect execution, faulty automation, or trading decisions.

TRV & nTRV - Trimmed Range VolatilityGrid bots require stable volatility measurement - ATR becomes misleading when gaps and sudden spikes distort the average. TRV (Trimmed Range Volatility) is an advanced version of ATR: it filters outliers at the extremes (highest and lowest ranges) and remains unaffected by gaps. This provides real-time, accurate volatility measurement for grid bot setup.Grid bots require stable volatility measurement - ATR becomes misleading when gaps and sudden spikes distort the average. TRV (Trimmed Range Volatility) is an advanced version of ATR: it filters outliers at the extremes (highest and lowest ranges) and remains unaffected by gaps. This provides real-time, accurate volatility measurement for grid bot setup.
Why We Developed TRV?
When a gap or sudden spike occurs in the morning, this extreme movement affects standard ATR calculations for an extended period. Even if the price moves sideways for the rest of the day, ATR remains elevated. This causes grid bots to operate with unnecessarily wide spacing and execute fewer trades.
TRV Advantages:
✅ Unaffected by Gaps: Opening gaps don't distort the calculation
✅ Extreme Point Elimination: Filters the largest and smallest outlier candles
✅ Real-Time Accuracy: Shows current market volatility
✅ Grid Bot Optimization: Enables tighter and more efficient grid spacing
✅ Comparison Capability: Compare different stocks and timeframes with nTRV
Grid Bot Usage:
The TRV value is used directly to calculate the number of grid lines:
(Resistance - Support) / TRV = Number of Grid Lines
Example:
Resistance: $110
Support: $90
TRV: $2
Grid Count: (110-90)/2 = 10 grid lines
Features:
Two Filtering Modes: Manual (enter number) or Percentage-Based (automatic ratio)
Four Indicators in One: nTRV, TRV, ATR, and nATR all displayed on the same panel
nTRV: Normalized value (percentage-based, for stock comparison)
TRV: Absolute value (currency-based, for grid calculation)
ATR & nATR Included: Standard ATR and nATR for direct comparison with TRV
Comprehensive Analysis: Compare filtered (TRV) vs unfiltered (ATR) volatility side-by-side
Default: 10% top, 10% bottom outlier elimination
Conclusion:
TRV is an advanced version of ATR specifically designed for grid bot traders. By filtering outlier movements, it provides more stable and reliable volatility measurement. The indicator includes both TRV (filtered) and ATR (unfiltered) on the same chart, giving traders a comprehensive view to make informed decisions. This dual-display approach enables more efficient grid strategies and increased trading frequency.

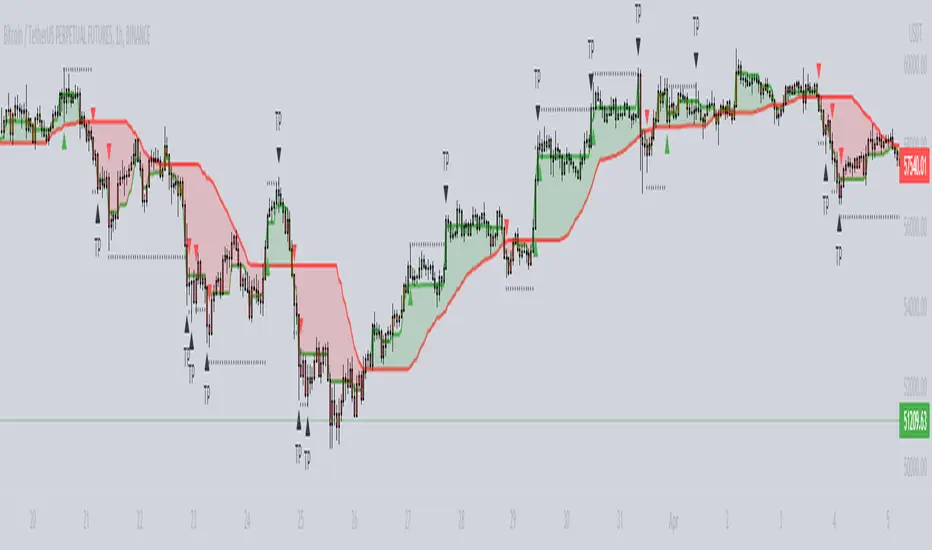
[3Commas] HA & MAHA & MA
🔷What it does: This tool is designed to test a trend-following strategy using Heikin Ashi candles and moving averages. It enters trades after pullbacks, aiming to let profits run once the risk-to-reward ratio reaches 1:1 while securing the position.
🔷Who is it for: It is ideal for traders looking to compare final results using fixed versus dynamic take profits by adjusting parameters and trade direction—a concept applicable to most trading strategies.
🔷How does it work: We use moving averages to define the market trend, then wait for opposite Heikin Ashi candles to form against it. Once these candles reverse in favor of the trend, we enter the trade, using the last swing created by the pullback as the stop loss. By applying the breakeven ratio, we protect the trade and let it run, using the slower moving average as a trailing stop.
A buy signal is generated when:
The previous candle is bearish (ha_bear ), indicating a pullback.
The fast moving average (ma1) is above the slow moving average (ma2), confirming an uptrend.
The current candle is bullish (ha_bull), showing trend continuation.
The Heikin Ashi close is above the fast moving average (ma1), reinforcing the bullish bias.
The real price close is above the open (close > open), ensuring bullish momentum in actual price data.
The signal is confirmed on the closed candle (barstate.isconfirmed) to avoid premature signals.
dir is undefined (na(dir)), preventing repeated signals in the same direction.
A sell signal is generated when:
The previous candle is bullish (ha_bull ), indicating a temporary upward move before a potential reversal.
The fast moving average (ma1) is below the slow moving average (ma2), confirming a downtrend.
The current candle is bearish (ha_bear), showing trend continuation to the downside.
The Heikin Ashi close is below the fast moving average (ma1), reinforcing bearish pressure.
The real price close is below the open (close < open), confirming bearish momentum in actual price data.
The signal is confirmed after the candle closes (barstate.isconfirmed), avoiding premature entries.
dir is undefined (na(dir)), preventing consecutive signals in the same direction.
In simple terms, this setup looks for trend continuation after a pullback, confirming entries with both Heikin Ashi and real price action, supported by moving average alignment to avoid false signals.
If the price reaches a 1:1 risk-to-reward ratio, the stop will be moved to the entry point. However, if the slow moving average surpasses this level, it will become the new exit point, acting as a trailing stop
🔷Why It’s Unique
Easily visualizes the benefits of using risk-to-reward ratios when trading instead of fixed percentages.
Provides a simple and straightforward approach to trading, embracing the "keep it simple" concept.
Offers clear visualization of DCA Bot entry and exit points based on user preferences.
Includes an option to review the message format before sending signals to bots, with compatibility for multi-pair and futures contract pairs.
🔷 Considerations Before Using the Indicator
⚠️Very important: The indicator must be used on charts with real price data, such as Japanese candlesticks, line charts, etc. Do not use it on Heikin Ashi charts, as this may lead to unrealistic results.
🔸Since this is a trend-following strategy, use it on timeframes above 4 hours, where market noise is reduced and trends are clearer. Also, carefully review the statistics before using it, focusing on pairs that tend to have long periods of well-defined trends.
🔸Disadvantages:
False Signals in Ranges: Consolidating markets can generate unreliable signals.
Lagging Indicator: Being based on moving averages, it may react late to sudden price movements.
🔸Advantages:
Trend Focused: Simplifies the identification of trending markets.
Noise Reduction: Uses Heikin Ashi candles to identify trend continuation after pullbacks.
Broad Applicability: Suitable for forex, crypto, stocks, and commodities.
🔸The strategy provides a systematic way to analyze markets but does not guarantee successful outcomes. Use it as an additional tool rather than relying solely on an automated system.
Trading results depend on various factors, including market conditions, trader discipline, and risk management. Past performance does not ensure future success, so always approach the market cautiously.
🔸Risk Management: Define stop-loss levels, position sizes, and profit targets before entering any trade. Be prepared for potential losses and ensure your approach aligns with your overall trading plan.
🔷 STRATEGY PROPERTIES
Symbol: BINANCE:BTCUSDT (Spot).
Timeframe: 4h.
Test Period: All historical data available.
Initial Capital: 10000 USDT.
Order Size per Trade: 1% of Capital, you can use a higher value e.g. 5%, be cautious that the Max Drawdown does not exceed 10%, as it would indicate a very risky trading approach.
Commission: Binance commission 0.1%, adjust according to the exchange being used, lower numbers will generate unrealistic results. By using low values e.g. 5%, it allows us to adapt over time and check the functioning of the strategy.
Slippage: 5 ticks, for pairs with low liquidity or very large orders, this number should be increased as the order may not be filled at the desired level.
Margin for Long and Short Positions: 100%.
Indicator Settings: Default Configuration.
MA1 Length: 9.
MA2 Length: 18.
MA Calculations: EMA.
Take Profit Ratio: Disable. Ratio 1:4.
Breakeven Ratio: Enable, Ratio 1:1.
Strategy: Long & Short.
🔷 STRATEGY RESULTS
⚠️Remember, past results do not guarantee future performance.
Net Profit: +324.88 USDT (+3.25%).
Max Drawdown: -81.18 USDT (-0.78%).
Total Closed Trades: 672.
Percent Profitable: 35.57%.
Profit Factor: 1.347.
Average Trade: +0.48 USDT (+0.48%).
Average # Bars in Trades: 13.
🔷 HOW TO USE
🔸 Adjust Settings:
The default values—MA1 (9) and MA2 (18) with EMA calculation—generally work well. However, you can increase these values, such as 20 and 40, to better identify stronger trends.
🔸 Choose a Symbol that Typically Trends:
Select an asset that tends to form clear trends. Keep in mind that the Strategy Tester results may show poor performance for certain assets, making them less suitable for sending signals to bots.
🔸 Experiment with Ratios:
Test different take profit and breakeven ratios to compare various scenarios—especially to observe how the strategy performs when only the trade is protected.
🔸This is an example of how protecting the trade works: once the price moves in favor of the position with a 1:1 risk-to-reward ratio, the stop loss is moved to the entry price. If the Slow MA surpasses this level, it will act as a trailing stop, aiming to follow the trend and maximize potential gains.
🔸In contrast, in this example, for the same trade, if we set a take profit at a 1:3 risk-to-reward ratio—which is generally considered a good risk-reward relationship—we can see how a significant portion of the upward move is left on the table.
🔸Results Review:
It is important to check the Max Drawdown. This value should ideally not exceed 10% of your capital. Consider adjusting the trade size to ensure this threshold is not surpassed.
Remember to include the correct values for commission and slippage according to the symbol and exchange where you are conducting the tests. Otherwise, the results will not be realistic.
If you are satisfied with the results, you may consider automating your trades. However, it is strongly recommended to use a small amount of capital or a demo account to test proper execution before committing real funds.
🔸Create alerts to trigger the DCA Bot:
Verify Messages: Ensure the message matches the one specified by the DCA Bot.
Multi-Pair Configuration: For multi-pair setups, enable the option to add the symbol in the correct format.
Signal Settings: Enable whether you want to receive long or short signals (Entry | TP | SL), copy and paste the the messages for the DCA Bots configured.
Alert Setup:
When creating an alert, set the condition to the indicator and choose "alert() function call only.
Enter any desired Alert Name.
Open the Notifications tab, enable Webhook URL, and paste the Webhook URL.
For more details, refer to the section: "How to use TradingView Custom Signals".
Finalize Alerts: Click Create, you're done! Alerts will now be sent automatically in the correct format.
🔷 INDICATOR SETTINGS
MA 1: Fast MA Length
MA 2: Slow MA Length
MA Calc: MA's Calculations (SMA,EMA, RMA,WMA)
TP Ratio: This is the take profit ratio relative to the stop loss, where the trade will be closed in profit.
BE Ratio: This is the breakeven ratio relative to the stop loss, where the stop loss will be updated to breakeven or if the MA2 is greater than this level.
Strategy: Order Type direction in which trades are executed.
Use Custom Test Period: When enabled signals only works in the selected time window. If disabled it will use all historical data available on the chart.
Test Start and End: Once the Custom Test Period is enabled, here you select the start and end date that you want to analyze.
Check Messages: Enable the table to review the messages to be sent to the bot.
Entry | TP | SL: Enable this options to send Buy Entry, Take Profit (TP), and Stop Loss (SL) signals.
Deal Entry and Deal Exit : Copy and paste the message for the deal start signal and close order at Market Price of the DCA Bot. This is the message that will be sent with the alert to the Bot, you must verify that it is the same as the bot so that it can process properly so that it executes and starts the trade.
DCA Bot Multi-Pair: You must activate it if you want to use the signals in a DCA Bot Multi-pair in the text box you must enter (using the correct format) the symbol in which you are creating the alert, you can check the format of each symbol when you create the bot.
👨🏻💻💭 We hope this tool helps enhance your trading. Your feedback is invaluable, so feel free to share any suggestions for improvements or new features you'd like to see implemented.
__
The information and publications within the 3Commas TradingView account are not meant to be and do not constitute financial, investment, trading, or other types of advice or recommendations supplied or endorsed by 3Commas and any of the parties acting on behalf of 3Commas, including its employees, contractors, ambassadors, etc.

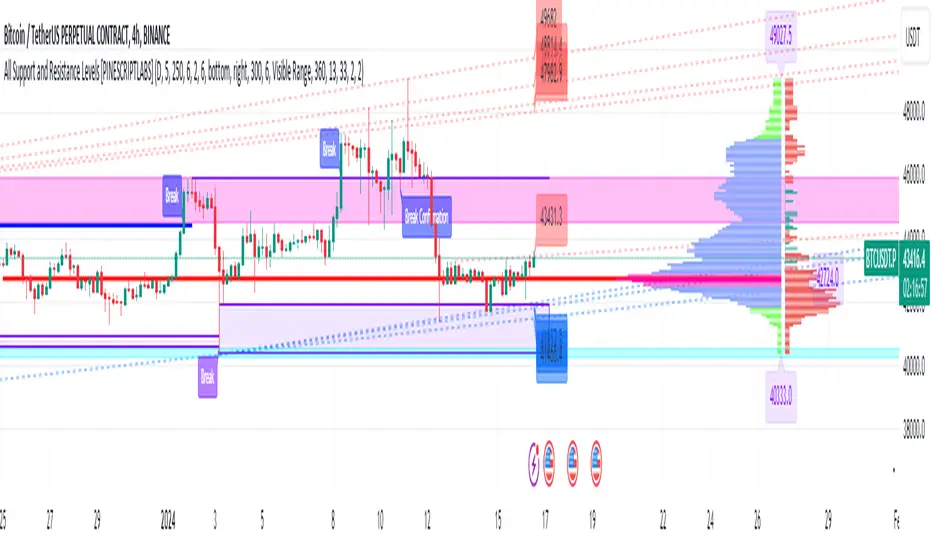
ICT [CASPER] Silver Bullet 2024.ENGLISH DESCRIPTION:
The "BOT SILVER BULLET 2024" indicator is a technical analysis tool tailored for active traders on the TradingView platform, combining market pattern study with quantitative trading intelligence. This sophisticated indicator overlays directly on the price chart and is designed to pinpoint and visualize critical liquidity zones, providing traders with a strategic edge in their decision-making process.
Its utility lies in identifying "Liquidity Zones," which are key areas where significant price movements are anticipated due to the accumulation or release of market orders. These zones are often levels where large market participants have placed unexecuted orders, which can lead to sharp and swift movements once those levels are reached. Foreseeing these points can be crucial for strategies aiming to capture volatility or find optimal entry and exit points.
The "BOT SILVER BULLET 2024" does not just focus on the present but also delivers historical analysis by identifying "Session Highs/Lows" and "Global Highs/Lows." These are the extreme points that have been reached during specific and broad timeframes, respectively. Knowing these levels can offer a deeper understanding of how the price has reacted in the past under certain market conditions, hinting at possible areas of support and resistance.
Furthermore, the indicator provides an in-depth analysis that delves beneath the surface. The "Analysis" function of this indicator scrutinizes price and volume patterns and correlates them with known market events, providing traders with a more informed perspective on the market's potential direction. This feature is invaluable for those looking to understand the underlying forces moving prices and how they might impact trading strategies.
To enhance usability and visual user experience, the "BOT SILVER BULLET 2024" allows users to "View Range Labels." This feature adds clear labels to price zones of particular interest, such as the aforementioned liquidity zones and historical highs and lows. These labels act as annotations that help traders keep track of significant developments without the need for constant manual analysis.
The indicator also highlights "Liquidity Grabs," moments when the price is anticipated to react significantly upon reaching levels previously identified with a high volume of pending orders. This information is pivotal for traders employing breakout or reversal strategies, as such price movements can provide profitable opportunities.
In summary, the "BOT SILVER BULLET 2024" indicator is a highly advanced tool and posits itself as one of the "most comprehensive market indicators." Its ability to provide an integrated view of the financial markets makes it indispensable for traders seeking to understand and anticipate price movements. Its amalgamation of historical data, alongside real-time visualization of market conditions, makes this tool not just comprehensive but also pertinent in today's dynamic trading environment. With its focus on liquidity and superior technical analysis, this indicator stands out as a true differentiator for serious traders looking to maximize their effectiveness in the financial markets.
DESCRIPCION EN ESPAÑOL:
El indicador "BOT SILVER BULLET 2024" es una herramienta de análisis técnico proyectada para operadores activos en la plataforma TradingView, con un diseño que fusiona el estudio de patrones de mercado y la inteligencia de trading cuantitativo. Este sofisticado indicador se integra directamente sobre el gráfico de precios y está diseñado para detectar y visualizar zonas críticas de liquidez, proporcionando a los operadores una ventaja estratégica en su toma de decisiones.
Su utilidad radica en la identificación de "Zonas de Liquidez", que son áreas clave donde se espera que ocurran movimientos significativos de precios debido a la acumulación o liberación de órdenes de mercado. Estas zonas son a menudo niveles donde los grandes participantes del mercado han colocado órdenes no ejecutadas, lo que puede dar lugar a movimientos rápidos y agudos una vez que se alcanzan esos niveles. La capacidad de prever estos puntos puede ser crucial para estrategias que buscan capturar volatilidad o encontrar puntos de entrada y salida óptimos.
El "BOT SILVER BULLET 2024" no sólo se enfoca en el presente, sino que también proporciona un análisis histórico mediante la identificación de "Altos/Bajos de Sesiones" y "Altos/Bajos Globales". Estos son los puntos extremos que han sido alcanzados durante períodos de tiempo específicos y generalizados, respectivamente. Conocer estos niveles puede ofrecer una comprensión más profunda de cómo el precio ha reaccionado en el pasado bajo ciertas condiciones de mercado, dando pistas sobre posibles áreas de soporte y resistencia.
Además, el indicador ofrece un análisis en profundidad que va más allá de la superficie. La función "Análisis" de este indicador examina patrones de precios y volúmenes, y los correlaciona con eventos de mercado conocidos, lo que proporciona a los traders una perspectiva más informada sobre la dirección potencial del mercado. Esta característica es invaluable para aquellos que buscan entender las fuerzas subyacentes que mueven los precios y cómo podrían afectar sus estrategias de trading.
Para mejorar la usabilidad y la experiencia visual del usuario, "BOT SILVER BULLET 2024" permite "Ver Etiquetas de Rangos". Esta función agrega etiquetas claras a las zonas de precio que son de particular interés, como las mencionadas zonas de liquidez, y los altos y bajos históricos. Estas etiquetas son una forma de anotación que ayuda a los operadores a mantenerse al tanto de los desarrollos significativos sin la necesidad de realizar un análisis manual constante.
El indicador también resalta las "Tomas de Liquidez", que son momentos en los que se espera que el precio reaccione de manera significativa al alcanzar niveles previamente identificados con un alto volumen de órdenes pendientes. Esta información es crucial para los traders que aplican estrategias de breakout o de reversión, ya que tales movimientos de precios pueden proporcionar oportunidades rentables.
Para resumir, el "BOT SILVER BULLET 2024" es un indicador altamente avanzado y se postula como uno de los "indicadores más completos del mercado". Su capacidad para proporcionar una vista integral de los mercados financieros lo hace indispensable para los traders que buscan comprender y anticipar movimientos de precios. Su integración de datos históricos, junto con la visualización en tiempo real de condiciones de mercado, hace que esta herramienta no solo sea completa sino también relevante en el dinámico entorno de trading actual. Con su enfoque en la liquidez y su análisis técnico superior, este indicador es un verdadero diferenciador para los traders serios que buscan maximizar su eficacia en los mercados financieros.
Bollinger Flip Flop StrategyThis strategy combines both long and short Bollinger band strategies with a signal to determine to determine when it's appropriate to use each. Additionally, the strategy has protections in place for market conditions which would normally cause a trade to be stuck due to a long market trend change. Think of it like a stop loss but instead of basing the stop on a percentage from entry, it's based on prevailing market conditions.
This strategy is ideal for controlling trading bots on the 3commas.io platform. To do this, you will need to set up two "simple" bots, one for short trades and one for long trades. Other than their direction, they should be configured identically. Set the parameters for the bot the same as you have them set in the strategy preferences. Once you've done this, set the "Short Bot ID" and "Long Bot ID" fields to the ID numbers for each bot, respectively. Next, set the Email Token parameter (this will be the same for both bots). Once you've done this, you need only configure a single alert per coin pair with the alert message set to {{strategy.order.alert_message}}. Make sure you have all of the strategy settings, including bot IDs and email tokens set correctly before creating the alert . These parameters are saved in the alert and can be safely changed on the active chart once the alert is created without affecting the alert.
TuxAlgo Plus a SMC and Trap Toolkit V0.98r1 by McTogaThe “TuxAlgo Plus” script is a powerful, standalone, conceptual open-source project and self-sufficient “smart money toolkit” with automatic trap detection (SMT), liquidity grabs, FVG confluence, and complete bot setup signals for TV charts in the “H1 to H6” time frame and daily charts.
The script is used to improve SMC/trap analyses, i.e., the structure and visualization logic for TradingView charts have been expanded in the “TuxAlgo++” project in line with Smart Money Concepts (SMC) and Smart Money Traps (SMT).
The SMT block (“Smart Money Traps”) supplements classic smart money concepts with:
1. Detection of bull traps (short setups) and bear traps (long setups)
2. Display of trap boxes in the chart (liquidity grab areas)
3. A bot setup box (table) with ready-made entry/SL/TP levels:
as well as age in bars & days and “Valid until ~X d” (remaining term)
SMT / bot setup only run on the following timeframes:
- H1, H2, H3, H4, H6 This means that traps, labels, and the bot setup box are only displayed on these timeframes
Trap definition “Bull Trap (Short Setup)”:
- Valid swing high
- Swing trend bullish
- High (Wick) pierces above the swing high (Liquidity Grab)
- Close falls back below the swing high (false breakout)
-> Result: Short setup (bull trap), marked in orange
Trap definition “Bear Trap (long setup)”:
- Valid swing low
- Swing trend bearish
- Low (wick) pierces below the swing low (liquidity grab)
- Close rises above the swing low again (false breakout)
-> Result: Long setup (bear trap), marked in blue
Entry / SL / TP calculation
A price range is taken for each trap:
Bull trap (short):
- Range =
- Entry = point within this range:
Entry = hiBT - (hiBT - loBT) * TrapEntryRatio (0..1)
-> 0.0 = at the Wick extreme, 0.5 = middle, 1.0 = at the Swing level
- SL = Wick extreme (upper edge of the trap)
- Risk = |Entry - SL|
- TP1 = Entry - R1 * Risk
- TP2 = Entry - R2 * Risk
Bear Trap (Long):
- Range =
- Entry analogous within the range according to TrapEntryRatio
- SL = wick bottom (lower edge of the trap)
- Risk = |Entry - SL|
- TP1 = Entry + R1 * Risk
- TP2 = Entry + R2 * Risk
R1 / R2 correspond to the inputs:
- botRR1Input = TP1 Risk/Reward (e.g., 1.5R)
- botRR2Input = TP2 Risk/Reward (e.g., 3.0R)
Age & Validity
Each trap stores:
- lastTrapBarIndex -> last bar of the trap
- Age in bars -> bar_index - lastTrapBarIndex
- Age in days (~d) -> AgeBars * BarDurationInDays (depending on TF)
Input: trapMaxAgeBars determines how long a trap is valid.
The bot setup box is only displayed if:
- a trap is present,
- AgeBars <= trapMaxAgeBars,
- SMT + Box + SMC timeframe are active.
Color logic (color blind friendly):
- Blue (accentBlue) = fresh traps (Age <= 1/3 MaxAge)
- Orange (accentOrange) = medium age
- Violet (accentPurple) = old, but still within MaxAge
- Gray (accentGray) = expired (> MaxAge)
The box also shows “Valid until ~X d” as the remaining term.
Day/Night Mode & Colors
- chart.bg_color is used to detect dark or light mode.
- Text/background colors adjust (light/dark).
- Accent colors (blue/orange/purple/gray) are suitable for red/green color blindness.
- Trap labels in the chart:
- Bull trap label = orange (short setup)
- Bear trap label = blue (long setup)
- Text color depends on chart mode (dark/light)
Typical workflow (example):
1. Select a suitable symbol & SMC timeframe (e.g., H4 or H6).
2. Wait for a bull trap (short) or bear trap (long).
3. Read in the bot setup box:
- Direction (long/short)
- Entry, SL, TP1, TP2
- Age & “Valid until ~X d”
4. These values can be used as a template for manual trading or external bot/order systems.
5. Position size & leverage must always be calculated separately in your own risk management
(e.g., 2% rule). This script does not calculate position sizes.

Superior-Range Bound Renko - Alerts - 11-29-25 - Signal LynxSuperior-Range Bound Renko – Alerts Edition with Advanced Risk Management Template
Signal Lynx | Free Scripts supporting Automation for the Night-Shift Nation 🌙
1. Overview
This is the Alerts & Indicator Edition of Superior-Range Bound Renko (RBR).
The Strategy version is built for backtesting inside TradingView.
This Alerts version is built for automation: it emits clean, discrete alert events that you can route into webhooks, bots, or relay engines (including your own Signal Lynx-style infrastructure).
Under the hood, this script contains the same core engine as the strategy:
Adaptive Range Bounding based on volatility
Renko Brick Emulation on standard candles
A stack of Laguerre Filters for impulse detection
K-Means-style Adaptive SuperTrend for trend confirmation
The full Signal Lynx Risk Management Engine (state machine, layered exits, AATS, RSIS, etc.)
The difference is in what we output:
Instead of placing historical trades, this version:
Plots the entry and RM signals in a separate pane (overlay = false)
Exposes alertconditions for:
Long Entry
Short Entry
Close Long
Close Short
TP1, TP2, TP3 hits (Staged Take Profit)
This makes it ideal as the signal source for automated execution via TradingView Alerts + Webhooks.
2. Quick Action Guide (TL;DR)
Best Timeframe:
4H and above. This is a swing-trading / position-trading style engine, not a micro-scalper.
Best Assets:
Volatile but structured markets, e.g.:
BTC, ETH, XAUUSD (Gold), GBPJPY, and similar high-volatility majors or indices.
Script Type:
indicator() – Alerts & Visualization Only
No built-in order placement
All “orders” are emitted as alerts for your external bot or manual handling
Strategy Type:
Volatility-Adaptive Trend Following + Impulse Detection
using Renko-like structure and multi-layer Laguerre filters.
Repainting:
Designed to be non-repainting on closed candles.
The underlying Risk Management engine is built around previous-bar data (close , high , low ) for execution-critical logic.
Intrabar values can move while the bar is forming (normal for any advanced signal), but once a bar closes, the alert logic is stable.
Recommended Alert Settings:
Condition: one of the built-in signals (see section 3.B)
Options: “Once Per Bar Close” is strongly recommended for automation
Message: JSON, CSV, or simple tokens – whatever your webhook / relay expects
3. Detailed Report: How the Alerts Edition Works
A. Relationship to the Strategy Version
The Alerts Edition shares the same internal logic as the strategy version:
Same Adaptive Lookback and volatility normalization
Same Range and Close Range construction
Same Renko Brick Emulator and directional memory (renkoDir)
Same Fib structures, Laguerre stack, K-Means SuperTrend, and Baseline signals (B1, B2)
Same Risk Management Engine and layered exits
In the strategy script, these signals are wired into strategy.entry, strategy.exit, and strategy.close.
In the alerts script:
We still compute the final entry/exit signals (Fin, CloseEmAll, TakeProfit1Plot, etc.)
Instead of placing trades, we:
Plot them for visual inspection
Expose them via alertcondition(...) so that TradingView can fire alerts.
This ensures that:
If you use the same settings on the same symbol/timeframe, the Alerts Edition and Strategy Edition agree on where entries and exits occur.
(Subject only to normal intrabar vs. bar-close differences.)
B. Signals & Alert Conditions
The alerts script focuses on discrete, automation-friendly events.
Internally, the main signals are:
Fin – Final entry decision from the RM engine
CloseEmAll – RM-driven “hard close” signal (for full-position exits)
TakeProfit1Plot / 2Plot / 3Plot – One-time event markers when each TP stage is hit
On the chart (in the separate indicator pane), you get:
plot(Fin) – where:
+2 = Long Entry event
-2 = Short Entry event
plot(CloseEmAll) – where:
+1 = “Close Long” event
-1 = “Close Short” event
plot(TP1/TP2/TP3) (if Staged TP is enabled) – integer tags for TP hits:
+1 / +2 / +3 = TP1 / TP2 / TP3 for Longs
-1 / -2 / -3 = TP1 / TP2 / TP3 for Shorts
The corresponding alertconditions are:
Long Entry
alertcondition(Fin == 2, title="Long Entry", message="Long Entry Triggered")
Fire this to open/scale a long position in your bot.
Short Entry
alertcondition(Fin == -2, title="Short Entry", message="Short Entry Triggered")
Fire this to open/scale a short position.
Close Long
alertcondition(CloseEmAll == 1, title="Close Long", message="Close Long Triggered")
Fire this to fully exit a long position.
Close Short
alertcondition(CloseEmAll == -1, title="Close Short", message="Close Short Triggered")
Fire this to fully exit a short position.
TP 1 Hit
alertcondition(TakeProfit1Plot != 0, title="TP 1 Hit", message="TP 1 Level Reached")
First staged take profit hit (either long or short). Your bot can interpret the direction based on position state or message tags.
TP 2 Hit
alertcondition(TakeProfit2Plot != 0, title="TP 2 Hit", message="TP 2 Level Reached")
TP 3 Hit
alertcondition(TakeProfit3Plot != 0, title="TP 3 Hit", message="TP 3 Level Reached")
Together, these give you a complete trade lifecycle:
Open Long / Short
Optionally scale out via TP1/TP2/TP3
Close remaining via Close Long / Close Short
All while the Risk Management Engine enforces the same logic as the strategy version.
C. Using This Script for Automation
This Alerts Edition is designed for:
Webhook-based bots
Execution relays (e.g., your own Lynx-Relay-style engine)
Dedicated external trade managers
Typical setup flow:
Add the script to your chart
Same symbol, timeframe, and settings you use in the Strategy Edition backtests.
Configure Inputs:
Longs / Shorts enabled
Risk Management toggles (SL, TS, Staged TP, AATS, RSIS)
Weekend filter (if you do not want weekend trades)
RBR-specific knobs (Adaptive Lookback, Brick type, ATR vs Standard Brick, etc.)
Create Alerts for Each Event Type You Need:
Long Entry
Short Entry
Close Long
Close Short
TP1 / TP2 / TP3 (optional, if your bot handles partial closes)
For each:
Condition: the corresponding alertcondition
Option: “Once Per Bar Close” is strongly recommended
Message:
You can use structured JSON or a simple token set like:
{"side":"long","event":"entry","symbol":"{{ticker}}","time":"{{timenow}}"}
or a simpler text for manual trading like:
LONG ENTRY | {{ticker}} | {{interval}}
Wire Up Your Bot / Relay:
Point TradingView’s webhook URL to your execution engine
Parse the messages and map them into:
Exchange
Symbol
Side (long/short)
Action (open/close/partial)
Size and risk model (this script does not position-size for you; it only signals when, not how much.)
Because the alerts come from a non-repainting, RM-backed engine that you’ve already validated via the Strategy Edition, you get a much cleaner automation pipeline.
D. Repainting Protection (Alerts Edition)
The same protections as the Strategy Edition apply here:
Execution-critical logic (trailing stop, TP triggers, SL, RM state changes) uses previous bar OHLC:
open , high , low , close
No security() with lookahead or future-bar dependencies.
This means:
Alerts are designed to fire on states that would have been visible at bar close, not on hypothetical “future history.”
Important practical note:
Intrabar: While a bar is forming, internal conditions can oscillate.
Bar Close: With “Once Per Bar Close” alerts, the fired signal corresponds to the final state of the engine for that candle, matching your Strategy Edition expectations.
4. For Developers & Modders
You can treat this Alerts script as an ”RM + Alert Framework” and inject any signal logic you want.
Where to plug in:
Find the section:
// BASELINE & SIGNAL GENERATION
You’ll see how B1 and B2 are built from the RBR stack and then combined:
baseSig = B2
altSig = B1
finalSig = sigSwap ? baseSig : altSig
To use your own logic:
Replace or wrap the code that sets baseSig / altSig with your own conditions:
e.g., RSI, MACD, Heikin Ashi filters, candle patterns, volume filters, etc.
Make sure your final decision is still:
2 → Long / Buy signal
-2 → Short / Sell signal
0 → No trade
finalSig is then passed into the RM engine and eventually becomes Fin, which:
Drives the Long/Short Entry alerts
Interacts with the RM state machine to integrate properly with AATS, SL, TS, TP, etc.
Because this script already exposes alertconditions for key lifecycle events, you don’t need to re-wire alerts each time — just ensure your logic feeds into finalSig correctly.
This lets you use the Signal Lynx Risk Management Engine + Alerts wrapper as a drop-in chassis for your own strategies.
5. About Signal Lynx
Automation for the Night-Shift Nation 🌙
Signal Lynx builds tools and templates that help traders move from:
“I have an indicator” → “I have a structured, automatable strategy with real risk management.”
This Superior-Range Bound Renko – Alerts Edition is the automation-focused companion to the Strategy Edition. It’s designed for:
Traders who backtest with the Strategy version
Then deploy live signals with this Alerts version via webhooks or bots
While relying on the same non-repainting, RM-driven logic
We release this code under the Mozilla Public License 2.0 (MPL-2.0) to support the Pine community with:
Transparent, inspectable logic
A reusable Risk Management template
A reference implementation of advanced adaptive logic + alerts
If you are exploring full-stack automation (TradingView → Webhooks → Exchange / VPS), keep Signal Lynx in your search.
License: Mozilla Public License 2.0 (Open Source).
If you build improvements or helpful variants, please consider sharing them back with the community.

Precision Strike Entry [PSE]This tool, known as Precision Strike Entry (PSE) , automatically generates Fibonacci Retracement Levels on any chart. More specifically, it scans for continuation and reversal trades based on two inputs and provides exact entry, exit ( Stop Loss ), and Take Profit levels.
Precision Strike Entry can be used for both Crypto and Forex markets.
A crucial aspect is adjusting the " Trading Mode " length to identify the correct extreme points or Custom Pivot Period Lookback. Unlike manually drawn Fibonacci levels, which remain static, the tool adjusts its levels dynamically when the chart's time frame changes.
Trading Mode Options:
Custom – To set manually Pivot Period Lookback
Scalper - Recommended for 5-15 min timeframes
Normal - Recommended for 15 min-2h timeframes
Swing - Recommended for 2h-4h timeframes
Unique to this tool is that the user can filter specific conditions before the Fibonacci is drawn on the chart. Additionally, it provides exact entry, stop loss, and Take Profit levels.
The identification of possible Fibonacci Retracement happens using two trigger techniques:
1-2 Setup and Trendline Break identification.
--> Using the 1-2 Setup identification, the indicator attempts to identify the next wave for point 3 using Fibonacci retracement rules.
--> Using the TrendLine breakout filter, the indicator will try to identify a possible pullback entry, utilizing Fibonacci retracement.
The indicator has been designed for bot processes, meaning it will not identify a short trade until you are in a long position and vice versa. Every trade ends with a custom breakeven at TP5 or hitting Stop Loss. When a trade ends/closes, the indicator will automatically search for a new long/short opportunity.
Since every symbol (Pair/Coin) has different conformations and pivots, not all pivot period parameters are perfect for every pair and timeframe. This is why the indicator gives you the opportunity to find the best pivot period for every combination of pair/timeframe, thanks to the Tuning Dashboard .
For example, for APE/USDT.P, by adjusting the 1-2 Setup & TrendLine Pivot Period Lookback settings, you can find a good setting with 1-2 Setup pivots set to 14, and TrendLine Breakout set to 15. The indicator checks the past 1000 bars and historical trades to provide an overview of what happened during the past 1000 bars.
In this case, the total number of trades was 145, and only 35 trades (24% of total trades) hit the Stop Loss without hitting at least TP1. TP1 was hit 110 times (75.75% of trades), TP2 65 times, etc.
This summary table also provides an indication of which pivot period setting is best for a specific pair/time frame combination. It offers statistical insights on how Take Profits were hit, giving you more confidence in how much of your position you will sell for each Take Profit level.
Pivot period settings for 1-2 Setup & Trend Line Breakout identification can be modified in the indicator parameters when the Trading Mode is set to Custom. There is also an extra parameter for filtering Long/Short ( Buy and Sell ) signals based on trend, identified using two EMAs (Moving Averages) with periods of 74 and 144.
Within the settings, you can also set Stop Loss and Breakeven settings as you prefer.
Default settings are:
TP1 Breakeven Level to Entry (possible values: Entry - DCA Entry - StopLoss)
TP2 Breakeven Level to TP1 (possible values: Entry - TP1 - StopLoss)
Breakeven Trigger: Use Close/Open of candles
Stoploss Trigger: Use Close/Open of candles
The indicator settings also include some visual settings to adapt the indicator based on the template you are using for your trading view charts for the best experience.
Alert Settings:
Precision Strike Entry (PSE) is designed to integrate with third-party bot systems
You can set three different alert modes:
TradingView Alert : You will receive classic TradingView alerts with messages indicating the desired alert, like Open Long (BUY), StopLoss Hit, Breakeven, and TakeProfits trigger alerts. (You will receive only the selected alerts from the list.)
Bot Alert : You will receive alerts only for Create Trade or Close Trade with the string of your UUID (you have to fill them in related to your Bot indication) and remember to set the Webhook setting to ensure the alert triggers on your Bot. When you use Bot Alert, you have to set the indicator Signal Type related to your Bot settings. NB: If you have created a TradingView Bot for Long Position, you will have to choose Signal Type = Long in the indicator settings.
Free Text Trade Alert : Using this setting, you will receive alerts only for Open Trade Long or Short. All information about Stop Loss and Take Profits is integrated into the Free Text Template.
Explanation for possible Fibonacci Retracement identification:
1-2 Setup identification:
Trend Line Breakout Pullback Identification:

Automated Algorithmic Trading System with RP DetectionFirst, we use a calculation of "higher highs" and "lower lows" price channels, which we see represented on the chart in purple. These channels provide us with a broad view that helps us identify on the chart where the price has reached significantly higher levels than before during a specific period and lower points than previous levels. As we observe, a channel forms, and when the price approaches or touches this channel initially, it reacts violently. But this is where the magic begins, as we will use these as areas of significant reversal, although they won't be the only filter, as we will need confluence with other patterns once we are in areas of significant reversal to make a buying or selling decision.
Secondly, the algorithm uses a fundamental and precise calculation as it shows us the most important support and resistance levels of the asset, which we observe in two ways on the chart. First, supports are represented in a blue block, and resistances in a red block. These are also grouped in a table by default in the last 5 days, although we can modify these calculations according to our needs in the indicator's configuration.
In addition, our algorithm performs a special calculation of a rational quadratic kernel, estimating the price regression function. This provides us with a clear idea of where the price of the asset is heading and its trend. This channel is always calculated and working optimally within the "higher highs" and "lower lows" channel we reviewed a moment ago, and it provides us with a macro view of the price.
Now, the algorithm uses this last quadratic microchannel to give us some reversal signals within this same microchannel that can be utilized by us for precise scalping entries. Considering the following, as we visualize on the chart:
First, we will explain the Reversal signals. At the top of our quadratic microchannel, the first automated signal is generated, which we will observe as a Reversal and is represented by a parachutist. This occurs when the price breaks the upper microchannel, and we expect a price pullback. A piece of advice: if we are in a resistance area, the price will have more strength to return to the microchannel zone, allowing us to take a short position.
On the other hand, as observed on the chart, the same reversal signal represented by an airplane is generated when there is a downward price break of the microchannel, which makes us expect a pullback back to the channel. In case we are in a support zone, the price's return will gain more strength, enabling us to enter a long position.
As we see in the chart, we have two other types of signals with very complex calculations that the algorithm detects, alerting us about price reversals. The first reversal patterns are shown visually as purple and green flags and are executed when there is a change in the price structure and the price reversal within the microchannel is confirmed. This allows us to have buy and sell operations. The second signals are shown visually as Bear Pattern and Bull Pattern, confirming a pattern when the price does not fall (for bulls) or rise (for bears) below or above a specific level after detecting the "hook." This is explained subtly, as the calculation is very complex, but the effectiveness of these reversals is impressive for working with pullbacks within the microchannel.
Now, let's explain how the grand signal is generated through confluences from all the algorithmic calculations of the indicator:
First, the buy signal is generated when we observe that the Quadratic Channel crosses down our "higher highs" and "lower lows" channel, meaning there is now a cross between channels, and at the same time, we are in a Support Zone. At this moment, when these three confluences are met, it will send us the buy alert that we visually observe as a pile of bills.
Similarly, for the sell signal, it is generated when we observe that the Quadratic Channel crosses up our "higher highs" and "lower lows" channel, meaning there is now a cross between channels, and at the same time, we are in a Resistance Zone. At this moment, when these three confluences are met, it will send us the sell alert that we visually observe as an explosion.
These grand confluence signals are usually of the day trading type since they will be executed in a significant move.
All our indicators come with two types of alerts to automate our trading. The first type of alert will notify us on our devices when a signal of interest occurs on the chart, previously configured by us.
The second type is configured to make our indicators work for us without the need to be present on the chart. This is done with a special programming within the indicator's code, and it will execute automatic buys and sells on our preferred exchange through an alert configured for the 3Commas bot. It will only be necessary to enter our Bot number or Bot ID provided by the 3Commas provider and insert it into the alert. All premium indicators have an explanation in their configuration that will detail where to enter your Bot ID.
ESPAÑOL:
Primero, usamos un cálculo de Canales de Precios "altos mas altos" y "bajos mas bajos", que vemos representados en el gráfico en color morado. Estos canales nos otorgan una amplia visión que nos ayuda a identificar en el gráfico dónde el precio ha alcanzado niveles significativamente más altos que los anteriores durante un período específico y puntos más bajos que los anteriores. Como observamos, se forma un canal en el que, en primer instancia, cuando el precio se acerca o toca este canal, reacciona violentamente. Pero es aquí donde comienza la magia, ya que los usaremos como zonas de gran reversión, aunque no serán el único filtro, ya que necesitaremos que exista confluencia con otros patrones una vez estemos en zonas de gran reversión para tomar una decisión de compra o venta.
En segunda instancia, el algoritmo utiliza un cálculo fundamental y preciso ya que Nos muestra los soportes y resistencias más importantes del activo, que observamos de dos maneras en el gráfico. Primero, están representados en un bloque azul los soportes y en un bloque rojo las resistencias. Estos también se agrupan en una tabla por orden de importancia por defecto en los últimos 5 días, aunque estos cálculos los podremos modificar de acuerdo a nuestras necesidades en la configuración del indicador.
adicional nuestro algoritmo realiza un cálculo especial de un kernel cuadrático racional, que estima la función de regresión del precio. Esto nos proporciona una idea clara de hacia dónde va el precio del activo y su tendencia. Este canal siempre está calculado y trabajando de manera óptima dentro del otro canal de "altos mas altos " y "bajos mas bajos" que revisamos hace unos momentos, y que nos brinda una visión macro del precio.
Ahora bien, el algoritmo utiliza este último micro canal cuadrático para darnos algunas señales de reversión dentro de este mismo micro canal que pueden ser aprovechadas por nosotros para hacer entradas precisas y del tipo scalping. Considerando lo siguiente, como visualizamos en el gráfico:
Primero, explicaremos las señales de Reversión en la parte alta de nuestro micro canal cuadrático, se genera la primera señal automatizada que observaremos como Reversión y está representada con un paracaidista. Esto ocurre cuando el precio rompe el micro canal alto, y esperamos que se genere un pullback del precio. Un consejo: si estamos en un área de resistencia, el precio tendrá más fuerza para regresar a la zona del micro canal, lo que nos permitirá tomar una posición corta.
Por otro lado, como observamos en el gráfico, la misma señal de reversión representada por una avioneta se genera cuando hay una ruptura del precio hacia abajo del micro canal, lo que nos hace esperar un pullback de retorno al canal. En caso de que estemos en una zona dentro del soporte, el retorno del precio tomará más fuerza, permitiéndonos obtener una entrada larga.
Como vemos en el gráfico, tenemos otros dos tipos de señales con cálculos muy complejos que el algoritmo detecta, avisándonos sobre las reversiones del precio. Los primeros patrones de reversión se muestran visualmente como banderas moradas y verdes y se ejecutan cuando hay un cambio en la estructura del precio y se confirma la reversión del precio dentro del micro canal. Esto nos permite tener operaciones de compra y venta. Las segundas señales se muestran visualmente como Bear Pattern y Bull Pattern, confirmando un patrón cuando el precio no vuelve a caer (para alcistas) o subir (para bajistas) por debajo o por encima de un nivel específico después de detectar el "gancho". Esto está explicado de manera sutil, ya que el cálculo es muy complejo, pero la efectividad de estas reversiones es impresionante para trabajar con pullbacks dentro del micro canal.
ahora bien vamos a explicar como se genera la gran señal por confluencias por todos los calculos algoritmicos del indicador:
primero la señal de compra se generá Cuando observamos que el Canal Cuadrático cruza hacia abajo nuestro Canal de bajos mas bajos, es decir ahora hay un cruce entre canales y al mismo tiempo nos encontramos en una Zona de Soporte, en este momento al cumplirse estas tres confluencias nos enviará la alerta de compra que observamos visualmente como un cumulo de billetes.
asi mismo para la venta se generá Cuando observamos que el Canal Cuadrático cruza hacia arriba nuestro Canal de altos mas altos, es decir ahora hay un cruce entre canales y al mismo tiempo nos encontramos en una Zona de Resistencia, en este momento al cumplirse estas tres confluencias nos enviará la alerta de venta que observamos visualmente como una explosión.
estas grandes señales por confluencia suelen ser del tipo day trading ya que se ejecutarán en un gran movimiento.
Todos nuestros indicadores cuentan con dos tipos de alertas para automatizar nuestro trading. El primer tipo de alerta nos avisará en nuestros dispositivos cuando ocurra alguna señal en el grafico y que sea de nuestro interes previamente configurada por nosotros.
La segunda está configurada para que nuestros indicadores trabajen para nosotros sin necesidad de estar presentes en el gráfico, esto con una programacion especial dentro del codigo del indicador y que hará por nosotros compras y ventas automáticas en nuestro Exchange de preferencia mediante una alerta configurada para el bot 3Commas, solo bastará con que pongamos nuestro numero de Bot o Bot ID que da el provedoor de 3Commas y lo insertemos en la alerta, todos los indicadores premium tienen en su configuracion una explicacion que te indicará detalladamente donde poner tus Bot ID.
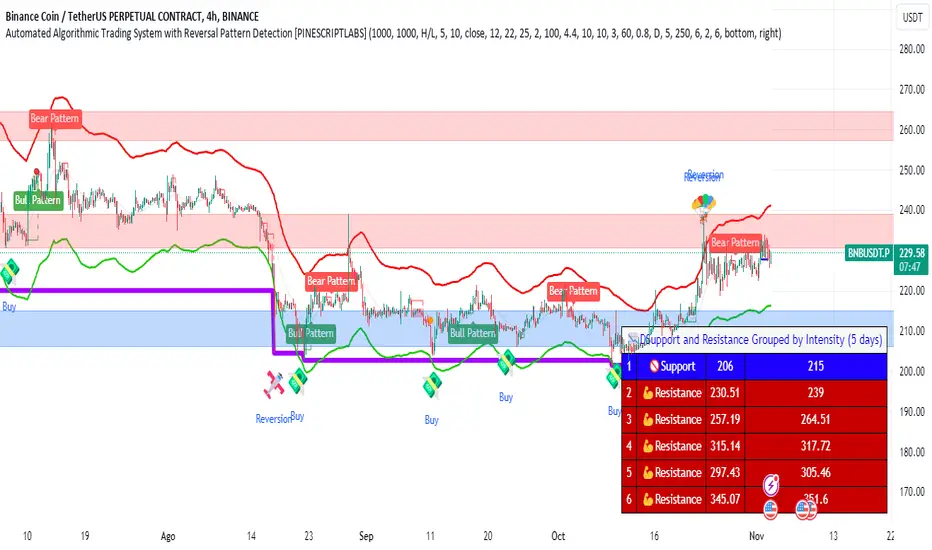
High Low Reversal This bot makes use of an algorithm which detects new highs and lows. When doing long trades, the bot will trigger a buy order on a newly made low. When making shorts, the bot will trigger a short trade on new highs.
Currently, the bot is optimized for cryptocurrencies on the M15 time frame. With the right amount of leverage and portfolio optimization this bot can obtain very strong results.
Feel free to optimize it to your own liking on different assets and/or time frames.
This bot performs exceptionally well in trending markets. Currently, it's only making long trades, but you can make it do short trades in the control panel.
The settings of the back test as follows:
starting capital = 100k
leverage = 1
commission = 0.2%
Equity per trade = 50%. Since the bot only makes one trade at a time you can allow it to use a bigger portion of your balance per trade.
I've also made a study-script for easy implementation on the exchange. You get that script once you get access to this bot.

Crypto Money Trader - Indicator for Buy and Sell SignalsThis is it... the one that many have been waiting for.
We have taken everything we have learned from the Crypto Money Index and Crypto Money Bot and combined it into the best indicator possible for trading crypto currencies. This version also includes logic for shorts (sell) and another criteria for longs (buys).
The code is cleaner as well so there is less signal noise and more precise entries.
Before we released this script, we did backtesting on all the current supported USD pairs for optimal results.
Here is one set of results for BTC on 2 hour chats using $5,000 starting balance, 1 trade at once maximum, and 1 contract size:
www.cryptosignalsbot.com
Net Profit: $25,582, 511.64%
Total Trades: 17
Percent Profitable: 70.59%
Profit Factor: 4.304
Maximum Downdraw: $6,629
AvgTrade: $1,504.82, 30.1%
These results get even crazier when you get into settings where you can have 4 trades at once - beyond 700% return... crazy...
The indicator also includes alerts that you can setup so you are aware when a Buy or Sell signal is triggered. Just set an indicator alert for the Trigger Buy or Trigger Sell greater then a value of 0 and you will always know when it is time to look at the charts.
--== STRATEGY ==--
You can combine this indicator with other indicators in your strategy. Many of our most successful users of our previous scripts do just that as it helps them tune a perfect time for an entry.
Personally, we use the indicator and simple trendline entries. When a Buy or Sell triggers, draw a trendline and support / resistance lines and enter on a breakout. That's it.
Please note: this is not a "buy it or sell it now" kind of indicator. Sometimes it will signal a few hours early before a move.
--== SUPPORTED PAIRS ==--
We are always adding pairs, but as of February, 2018 this is our supported USD based pairs: BTC, ETH, LTC, XRP, NEO, BCH, IOT, EOS, BTG, ETC, ETP, OMG, EDO, ZEC, XMR, TRX, SAN, DSH, SNG
--== TELEGRAM CHANNEL ==--
All subscribers to this indicator will get access to our Exclusive Telegram Group where all the signals are analyzed and posted for you to see how we are playing the calls. You can either use this to learn how we use the indicator, or to trade from (at your own risk of course).
The alerts are all posted in this channel automatically and only the timeframes with the highest returns from extensive backtests are posted here automatically. However, we will sometimes post analysis on other timeframes as well.
--== BONUS ==--
As a subscriber, not only do you get this amazing indicator, but as a subscriber you will get access to our Crypto Money Index and the Crypto Money Bot
--== ACCESS ==--
Access is simple, go to our new website and register: Crypto Signals Bot
We will work to get you access to everything as quickly as possible. If you have any issues or questions, use the contact form on the website.
Flexible S/R Channels🟩 Flexible S/R Channels is a visualization tool that draws curved support and resistance boundaries through user-defined anchor points. Unlike traditional trendlines and channels that force linear interpretation onto price action, this indicator captures the curved structures that markets frequently form—rounded tops and bottoms, parabolic advances and declines, arcing rallies and pullbacks. Three anchor points per curve define the shape; the indicator fits a smooth mathematical curve through these points and projects it forward. The approach is simple: draw what you see. Curved market structure that resists precise definition with traditional tools can now be rendered with mathematical accuracy.
The indicator bridges the gap between static drawing tools and programmable indicators. TradingView's arc tool draws curves but produces only visual pixels with no analytical value. Flexible S/R Channels creates live data series that integrate with other analysis tools. Four curve-fitting methods—Quadratic, Quadratic-Linear, Weighted Linear, and Natural Cubic Spline—accommodate different market structures. The curved levels naturally lend themselves to breakout and reversion strategies—applications left to the trader's discretion. The open-source code invites experimentation and customization.
💡 THEORY AND CONCEPT 💡
Traders have long relied on horizontal levels and diagonal trendlines to define support and resistance. Linear tools assume constant slope—a property rarely exhibited by actual market movement. When momentum accelerates or decelerates, price trajectories curve rather than hold to fixed angles. The resulting structures—parabolic advances during expansion phases, arcing pullbacks during consolidation, rounded formations at reversal points—represent changes in the rate of change itself. Traditional drawing tools cannot accommodate this variable geometry without sacrificing mathematical precision..
Flexible S/R Channels extends familiar support and resistance concepts into curved space. The approach is simple: draw what you see. When the eye recognizes a curved boundary in price action, this indicator provides the means to define it precisely. Three anchor points per curve—an initial point, an intermediate point, and a recent point—are all that is required. The indicator fits a smooth mathematical curve through these points and extends it forward as a projection.
This indicator represents a blend of human pattern recognition and algorithmic precision. Fully automated indicators make decisions without user input—efficient but detached from trader discretion. Manual drawing tools rely entirely on freehand skill—expressive but imprecise. Flexible S/R Channels occupies the middle ground. The trader identifies the curved structure; the algorithm renders it mathematically. The result is human insight expressed with computational accuracy—for traders who recognize curved structure in price action but lack precise tools to define it.
This projection is not a prediction. It is a visual hypothesis—a structured way of asking "if this trajectory continues, where would price be?" The underlying assumption is simple: like Newton's first law of motion, a trajectory in motion tends to continue unless acted upon by an external force. Future price action validates or invalidates the projection, just as it does with any trendline or channel.
TradingView offers an arc drawing tool for freehand curved lines, but these are purely visual—static pixels on a screen with no programmable value. Flexible S/R Channels bridges this gap. The fitted curves exist as data series that can generate alerts, trigger signals, and interact with other analysis tools. The visual drawing becomes operational structure.
🔁 CURVE METHODS 🔁
The indicator offers four curve-calculation methods, each producing different shapes suited to different market structures:
Quadratic — Fits a parabolic arc through the three anchor points. Best for smooth, continuous curves such as rounded tops and bottoms. It captures the natural "swing" of the market, assuming the momentum will maintain its current rate of acceleration or deceleration.
Quadratic-Linear — Uses a parabolic curve through the anchor points, then transitions to a straight line after the final anchor. Useful when curved structure gives way to linear trend continuation. This is the "bridge" between a turning market and a steady, directed move, preventing the projection from curving back on itself when the price begins to run.
Weighted Linear — Connects anchor points with straight line segments rather than a smooth curve. Suited for angular market structures with distinct inflection points. It treats the market as a series of rigid shifts, providing a clear "corridor" when the price is bouncing between sharp, diagonal levels.
Natural Cubic Spline — Produces the smoothest curve by minimizing abrupt directional changes. Ideal for organic, flowing market movements. It acts as a flexible spine that adapts to complex transitions without the rigid constraints of a fixed geometric shape.
Quadratic Fitting : A smooth, parabolic arc defines a curved resistance boundary. By fitting a mathematical path through three anchor points, the curve captures rounded structures and arcing price action that traditional linear trendlines fail to represent.
Weighted Linear Fitting : This method produces an angular, segmented path by connecting anchor points with distinct linear slopes. Unlike the continuous smoothness of a quadratic arc, the weighted linear approach creates a more jointed geometry, allowing for a precise match to market structures that exhibit sharp, localized changes in trajectory.
Natural Cubic Spline Fitting : This method creates a highly fluid, elastic curve that can accommodate complex price oscillations. In this instance, the curves define a narrowing range as support and resistance converge, highlighting the volatility compression that often precedes a significant breakout or breakdown from established structures.
🖱️ HOW IT WORKS 🖱️
1️⃣ Initial Setup
Unlike traditional indicators that calculate values automatically from price data, Flexible S/R Channels requires user-defined anchor points. This is intentional. The trader's eye is the pattern recognition engine—no algorithm can see the curved structure that experience and intuition reveal. The indicator waits for this input, then applies mathematical precision to render what the trader has identified.
The Recognition of Natural Structure : Effective analysis begins when a curved rhythm becomes visible within price action that traditional trendlines cannot satisfy. Identifying the specific swing highs and swing lows that define these boundaries is the first step in organizing a chart. By isolating three key pivots for resistance and three for support, the underlying framework of the market's trajectory is established, providing the necessary coordinates to accurately map the path.
Interactive Setup Workflow : Upon loading, the indicator prompts for the sequential selection of six points—three swing highs and three swing lows—to serve as the raw data for the calculation. While the chart remains blank during this initial phase, the curves generate instantly once the final anchor is confirmed. These points are not permanent; they appear as interactive grips that can be dragged in real time to refine the boundaries as the market structure evolves.
The indicator prompts for six sequential selections—three for resistance, three for support. The first three selections define the resistance boundary; the final three define support. This sequential grouping is distinct from zigzag-style selection patterns. Within each group, clicking order is flexible—the algorithm automatically sorts points chronologically, allowing traders to select visually prominent pivots in whatever sequence feels natural.
Structural Anchor Identification : Identifying three key swing highs and three key swing lows provides the foundation for the dual-curve geometry. These specific structural peaks and troughs serve as the coordinates for the mathematical models, ensuring that the resulting boundaries accurately reflect the underlying skeleton of the market action.
2️⃣ Interactive Adjustment
After the initial setup, all six anchor points are fully adjustable:
Points are automatically sorted chronologically regardless of selection order
Grip handles appear at each anchor location
Any point can be repositioned by clicking and dragging its grip handle
The curves recalculate instantly as points are adjusted
The algorithm produces a mathematically perfect curve based on the anchor points provided. If the result does not match the trader's vision, adjustments are immediate. This iterative refinement—see, adjust, refine—continues until the rendered curve represents what the trader sees in the price action. The user remains in control; the algorithm remains in service.
Interactive Channel Boundaries : Six user-defined anchor points—three for resistance and three for support —establish a non-linear range that moves beyond the constraints of a flat, horizontal channel. This configuration captures the arcing trajectory of the market while showing price action respecting the curved boundaries in a classic reversion pattern. By manually positioning these anchors, a dynamic dimension is added to the chart that maintains structural integrity even as the price follows a rounded path.
🛠️ SETTINGS 🛠️
Customizable Visual Feedback : Beyond the core geometry, the visualization offers various user-defined settings to tailor the chart's information density. From identifying specific price targets to toggling structural labels, these options allow the trader to adjust the level of detail to suit their personal analysis style while maintaining a clear view of the non-linear boundaries.
Configuration Options
Curve Method — Select the curve-fitting algorithm: Quadratic, Quadratic-Linear, Weighted Linear, or Natural Cubic Spline.
Projection Length — Number of bars to project the curves beyond current price action. Projections appear as dashed lines.
Visual Settings
Grip Size — Size of the draggable handles displayed at each anchor point. Set to zero to hide grips entirely.
Line Width — Thickness of the support and resistance curves.
Support Color / Resistance Color — Color settings for each curve.
Show Info Table — Toggle display of the info table showing the current curve method in the chart corner.
Advanced: Time/Price Coordinates
The settings panel includes precise time and price values for each of the six anchor points, grouped under Resistance Time/Price and Support Time/Price. These values are populated automatically when points are selected on the chart.
Adjusting anchor points by dragging the grip handles directly on the chart is faster and more intuitive. The time/price fields are available for situations requiring exact coordinate entry—such as aligning an anchor to a specific candle timestamp or a precise price level. These fields can be safely ignored unless fine-tuning is necessary.
🖼️ CHART EXAMPLES 🖼️
The Flexible S/R Channels indicator adapts to diverse market structures across multiple timeframes and instruments. Curved boundaries can define subtle momentum shifts in near-linear trends, dramatic reversals in rounding formations, or volatility compression as channels converge toward breakout points. The four curve-fitting methods accommodate different geometries—smooth parabolic arcs for continuous momentum changes, segmented linear paths for angular structures, and elastic splines for complex oscillations. Each anchor point adjustment instantly recalculates the curves, allowing iterative refinement until the rendered boundaries align with the trader's interpretation of market structure. Forward projections extend these mathematical relationships into future territory, providing visual context for hypothetical support and resistance levels if current trajectories persist.
Subtle Curve Alignment : Even in structures that appear linear, subtle curvature allows the channel boundaries to breathe with the market’s internal momentum. By utilizing three anchor points rather than two, the channel adapts to the slight acceleration of a trend, providing a more precise fit than a rigid, straight corridor.
Decelerating Momentum and Convergence : This classic rounding structure illustrates a transition where the initial wide oscillations between highs and lows begin to contract. As the boundaries converge, the curve captures the diminishing volatility and the shift in market energy, providing a clear visual representation of a trend losing its expansive momentum as it approaches a potential turning point.
Organic Trend Modeling : In an accelerating uptrend, the Natural Cubic Spline provides a highly adaptable boundary that mirrors the organic flow of momentum. This non-traditional approach allows the channel to follow complex price pulses that a standard linear trendline would likely cut through, maintaining a precise fit even as the angle of the trend shifts over time.
Non-Linear Projections : Unlike standard trendlines that converge at a fixed rate, curved projections adapt to the historical momentum of the move. This allows the indicator to map a dynamic squeeze, capturing the subtle nuances of how price action tightens toward an apex. It provides a more sophisticated view of future convergence points that traditional linear channels often fail to anticipate.
The "Draw What You See" Philosophy : Market structures are rarely perfect, and this example highlights the indicator’s ability to map unconventional rhythms. Rather than forcing price into a predefined category, the tool remains flexible enough to define any structural path the trader identifies. If you can see a trend's trajectory, the indicator can provide the mathematical framework to support it.
Comparative Projection Modeling : Using identical anchor points as above, this example demonstrates how selecting a different calculation method can alter the projected path. While the historical fit remains precise, the variation in the forward-looking trajectory allows traders to explore multiple mathematical interpretations of the same market structure, choosing the model that best aligns with the current volatility and trend behavior.
Extended Timeframe Channel Definition : This multi-year perspective demonstrates the indicator's ability to define curved channel boundaries across extended timeframes spanning hundreds of bars and multiple market cycles. The resistance curve captures the rounded distribution of swing highs while the support curve follows the accelerating base formation, creating a non-linear channel that frames long-term structural trends more precisely than traditional parallel channels or static trendlines.
Rounding Bottom Reversal and Channel Convergence : This example captures a classic rounding bottom formation—a reversal pattern that linear tools cannot adequately define. The Quadratic method produces a smooth parabolic arc through the resistance anchors, tracing the deceleration of the downtrend, the capitulation low, and the subsequent re-acceleration upward as a single continuous curve. The support boundary mirrors this momentum shift from below, creating a curved channel that narrows toward current price. This convergence represents structural compression—the boundaries tightening as volatility contracts and directional resolution approaches. Price action oscillates within these non-linear boundaries, demonstrating that channel behavior persists even when the geometry is curved rather than parallel. The projection extends both curves forward, mapping the hypothetical trajectory if the current momentum structure continues, providing visual context for potential breakout or breakdown levels as the channel reaches its apex.
Built-in Precision vs. Algorithmic Power : While TradingView offers basic curve drawing tools (shown here as dashed lines), the Flexible S/R Channels indicator elevates this concept into a functional analytical framework. By converting manual observations into mathematical models, it moves beyond mere drawing to provide a data-driven structure that can be utilized for advanced technical analysis and future Pine Script trading logic.
⚙️ TECHNICAL DETAILS ⚙️
Curve Fitting vs. Overfitting: The term curve fitting often carries negative connotations in quantitative analysis due to its association with overfitting—the practice of adjusting a model until it perfectly matches historical data, producing an illusion of accuracy that fails when applied to new data. The application here is fundamentally different. Flexible S/R Channels does not optimize parameters to maximize historical fit; it constructs a mathematical curve through user-selected anchor points, then projects that curve into unknown territory. The curve is not fitted to price data—it is fitted to structural pivots identified by the trader. The projection represents a hypothesis about trajectory continuation, not a prediction derived from statistical optimization. Future price action validates or invalidates this hypothesis in real time, exactly as it does with any trendline or channel. The anchor points remain fixed unless manually adjusted, ensuring the curve does not adapt to new data retroactively.
Non-Repainting Behavior: The indicator does not repaint historical bars. The mathematical coefficients that define each curve are calculated once—when the final anchor point is set—and stored as fixed values. These coefficients remain constant unless an anchor point is manually repositioned. The backfit polyline is drawn once using these coefficients, spanning the known range from the first to last anchor point. The plot() function applies the same coefficients to each subsequent bar, updating in real-time as new bars form but never altering previously plotted values. The projection polyline extends forward from the current bar using the same fixed coefficients, projecting a user-defined number of future bars (maximum 500). This projection redraws on each tick to maintain its position relative to the moving current bar, but the mathematical trajectory remains constant—only the starting point advances. The current bar's curve value will update tick-by-tick as price develops, which is standard real-time behavior, not repainting. Once a bar closes, all curve values on that bar are permanent. The hybrid architecture (backfit polyline for known history, plot() for unlimited real-time range, projection polyline for controlled forward extension) prevents overflow errors while maintaining non-repainting integrity across all components.
🗒️ NOTES 🗒️
The indicator renders curves based on any anchor points provided without validation. Unusual anchor placement produces mathematically accurate but potentially non-useful results. Adjustment is iterative—if the curve doesn't match expectations, reposition the anchors.
Because anchor points are stored as specific time and price coordinates, a new instance of the indicator should be added when analyzing a different chart or timeframe.
Grip handles can be hidden by setting Grip Size to zero in the settings. This is useful for clean chart screenshots or presentations where interactive elements are not needed.
Projection length can be set to zero if forward-looking curves are not desired. The indicator will still render the backfit curves through the anchor points and continue plotting in real-time without the dotted projection extensions.
Anchor points remain fixed at their selected time-price coordinates as new bars form. The curves extend forward automatically from these historical anchors, allowing observation of how projected trajectories align with developing price action.
⚠️ DISCLAIMER ⚠️
The Flexible S/R Channels indicator is a visual analysis tool designed to illustrate geometric market inertia and serve as a framework for understanding dynamic support and resistance. While the indicator generates structural channels and projected paths, no guarantee is made regarding the accuracy or profitability of these projections. Like all technical indicators, the curves and boundaries generated by this tool may appear to align with favorable trading opportunities in hindsight. However, these visualizations are not intended as standalone recommendations for trading decisions. This indicator is intended for educational and analytical purposes, complementing other tools and methods of market analysis.
🧠 BEYOND THE CODE 🧠
Flexible S/R Channels is part of a broader collection of tools designed to provide structured market analysis. This includes the Grid Bot Simulator , the Grid Bot Auto , the Grid Bot Parabolic , and the Gridbot Ping Pong . While each tool serves a distinct purpose, they all utilize dynamic anchor mechanics and non-linear boundaries to adapt to evolving market conditions.
This indicator shares the same educational philosophy as the Fibonacci Time-Price Zones and the Fibonacci Geometry Series - providing frameworks for understanding market concepts through visualization and experimentation rather than black-box signals.
The Flexible S/R Channels indicator, like other xxattaxx indicators , is designed to encourage both education and community engagement. Feedback and insights are invaluable to refining and enhancing this tool. We look forward to the creative applications, observations, and discussions this indicator inspires within the trading community.

RT-Custom Clouds|RSI|HMA|GPIntroduction
The RT-Custom Clouds|RSI|HMA|GP indicator is a multipurpose toolkit that combines custom Ichimoku clouds, custom RSI-based overlays, RSI Top/Bottom signals, Hull Moving Averages and automated Fibonacci Golden Pocket zones into a single indicator. It is designed to give traders flexible ways to view trend, momentum, and key zones on the chart.
This publication walks through each major component of the RT-Custom Clouds|RSI|HMA|GP indicator and how traders commonly use them.
Custom Ichimoku Clouds
The top section of RT Custom Clouds focuses on Ichimoku-style clouds. Traders can choose between different cloud variants and control whether they want the full Ichimoku toolkit or only the cloud itself on the chart.
A single toggle controls the cloud display: Cloud Only (All Versions) - When enabled, only the selected cloud is displayed. Core Ichimoku lines are hidden so traders who prefer a clean cloud view can keep their charts simple. Traders can select between three cloud styles: Josh Olszewicz Cloud (Preferred) - Uses a doubled parameter set inspired by the well-known Ichimoku variant popularized by Josh Olszewicz.
Standard Cloud - Uses the classic Ichimoku settings familiar from most charting platforms.
Custom Cloud - Allows full control over the main Ichimoku inputs:
Custom Conversion Line Length
Custom Base Line Length
Custom Leading Span Length
Custom Displacement
These options let traders move between a standard Ichimoku view, a doubled parameter variant, or a fully customized configuration tuned to their own style.
Custom RSI X's and RSI Bot Signals
The RT-Custom Clouds|RSI|HMA|GP indicator also includes an RSI X overlay that plots RSI information directly onto price candles instead of keeping it in a separate lower pane. This makes it easier to see momentum shifts and extended conditions without constantly looking down at another indicator. RSI Colors
Instead of drawing RSI as a line, the tool places colored X markers on candles to reflect RSI behavior. These markers use an adapted version of the Rainbow Trends color system. To keep candle colors and RSI markers visually distinct, the original Rainbow Trends color code is inverted for RSI. This inversion helps traders quickly distinguish between the underlying trend colors and the RSI-driven overlays: RSI Settings
The RSI section includes a focused set of options to tune how the X markers behave and how the RSI Bot interprets momentum:
RSI "X" Marker Sensitivity - Adjusts how sensitive the X markers are to RSI changes. Higher or lower values will change how often markers appear.
RSI Length - Controls how many candles are used when calculating RSI. The default value is similar to traditional 14-period RSI, but can be adjusted.
RSI Markers On/Off - Toggles the colored X markers on or off.
RSI Top/Bottom Signals On/Off - Toggles the RSI Bot signals that mark potential tops and bottoms.
RSI Overbought On/Off - Enables or disables overbought style X markers.
RSI Oversold On/Off - Enables or disables oversold style X markers.
RSI Bot - Tops And Bottoms
Over time, traders using this tool wanted a way to summarize longer stretches of RSI activity into clear signals. The RSI Top/Bottom Bot does this by watching runs of RSI X markers and waiting for those runs to pause.
Conceptually, the RSI Bot: Monitors when a strong sequence of RSI X markers is printing in one direction.
Waits for a candle where no RSI X marker appears after that run.
Marks that candle as a potential RSI Top or RSI Bottom, since the prior RSI pressure has paused and a reversal may start. These signals can be tied to TradingView alerts using standard alert conditions so traders can monitor major shifts in RSI behavior without watching every bar. Alerts can be set for either RSI Top signals or RSI Bottom signals. Hull Moving Average (HMA)
The RT-Custom Clouds|RSI|HMA|GP indicator also includes a Hull Moving Average component inspired by early users of Rainbow Trends tools who relied on tuned HMAs for trend context. The HMA implementation follows common definitions of the Hull Moving Average and can be configured with user-defined lengths. Many traders using this tool treat the HMA as a secondary trend filter or confirmation layer alongside other Rainbow Trends indicators. For example: Watching whether price is trading above or below a longer HMA to frame bullish or bearish bias.
Studying how price interacts with the HMA during extended trends or range rotations.
HMA Cross Alerts And Divergences
The tool can also draw and alert on HMA cross events and divergence style patterns: HMA Cross Alerts - Alerts can be configured when price or multiple HMAs cross, allowing traders to automate notifications for potential trend shifts.
HMA Divergences - An optional divergence mode looks for conditions similar to RSI divergence style setups, but applied to the HMA logic. These are intended as context layers around trend behavior, not as automatic entry and exit rules.
HMA Settings
The HMA module of this indicator can be tuned to meet each trader's preference.
Plot HMA - On/Off - Toggles the HMA Line on/off.
HMA Alerts - On/Off - Toggles HMA Alerts on/off.
Plot HMA Alerts - On/Off - Toggles HMA Alerts on/off.
Plot Divergences - On/Off - Toggles Divergences on/off so the trader can choose which specific ones they want to display.
HMA Period - Adjusts the period of candles the HMA is calculated off of.
HMA Source - Changes the base calculation of the HMA.
Pivot Lookbacks - Adjusts the candle lookback range for the HMA Divergences.
Max/Min of Lookback Range - Adjusts the min & max lookback range for the HMA Divergences. Fibonacci Golden Pockets
The RT-Custom Clouds|RSI|HMA|GP indicator also includes an automated Fibonacci Golden Pocket module. Instead of manually drawing Fibonacci retracements and marking the Golden Pocket region for each swing, the tool scans the chart and plots these zones for the trader.
The Golden Pocket module can be configured using:
Golden Pocket On/Off - Toggles automatic plotting of golden pocket zones.
Golden Pocket Colors - Controls line and fill appearance so zones can be made more or less prominent.
Lookback Period - Defines how far back the algorithm studies price action when searching for swings and drawing golden pocket zones.
Invert Fibs - Inverts the Golden Pocket measurement.
Extend Lines - Allows for the Fib lines to be plotted further across the chart.
Display Prices/Levels - Toggles plotting of the prices and Fib levels on and off. Some traders prefer to work with both traditional and inverted golden pockets at the same time. This can be done by adding RT Custom Clouds to the chart twice, running one instance with standard golden pocket settings and the second instance with inverted settings.
How Traders Commonly Use The RT-Custom Clouds|RSI|HMA|GP Indicator
Because the RT-Custom Clouds|RSI|HMA|GP indicator offers several tools into a single script, traders often use it as a multipurpose context layer rather than a one-dimensional indicator. Common patterns include: Using custom Ichimoku clouds to frame overall trend and support or resistance zones.
Overlaying RSI X markers and RSI Top/Bottom signals onto price to highlight momentum shifts and exhaustion areas.
Adding HMA and HMA cross alerts as a secondary trend confirmation tool.
Letting the Golden Pocket module continuously plot Fibonacci based zones to study how price reacts around them over time.
In all cases, RT Custom Clouds is designed to provide structured context that can be combined with other Rainbow Trends tools, price action, and volume analysis.
Important Note
The RT-Custom Clouds|RSI|HMA|GP indicator is intended to provide additional context around trend structure, momentum, and potential support or resistance zones. It is not a standalone signal generator and should always be used together with your own analysis, testing, and risk management. Historical examples or past interactions with clouds, RSI markers, HMAs, or golden pockets do not guarantee future results.
🐋 Tight lines and happy trading!

nATR*ATR Multiplication Indicator - Optimal Selection Tool forThis indicator is specifically designed as an analysis tool for investors using grid bot strategies. It displays both nATR (Normalized Average True Range) and ATR (Average True Range) values on a single chart screen, calculating the multiplication of these two critical volatility measurements.
Primary Purpose of the Indicator:
To facilitate the selection of the most optimal stock and time period for grid bot trading. The nATR*ATR multiplication provides a hybrid measurement that combines both percentage-based return potential (nATR) and absolute volatility magnitude (ATR).
Importance for Grid Bot Strategy:
High nATR: Greater percentage-based return potential
High ATR: Wider price range = Fewer grid levels = More budget allocation per grid
Formula: Price Range/ATR = Theoretical Grid Count
Usage Advantages:
Test different time periods to find the highest multiplication value
Make optimal stock and time frame selections for grid bot setup
Monitor both nATR and ATR values on a single screen
High multiplication values indicate ideal conditions for grid bots
Technical Features:
Adjustable calculation period (1-500 candles)
Visual alert system (high/low multiplication values)
Real-time value tracking table
SMA-based smoothed calculations
This serves as a reliable guide for grid bot investors in optimal timing and stock selection.

Fibonacci internal Break of Range PinescriptlabsThe uniqueness of this script lies in the synergy and dynamic interaction resulting from the advanced combination of key elements of technical analysis in the way it strategically merges Fibonacci Levels with the Linear Regression Channel and the internal price structure, creating a highly synergistic market analysis system.
The Linear Regression Channel, drawn from price regression and its standard deviation over a defined number of bars, offers a graphical representation of the prevailing market trend. The combination of this channel with Fibonacci Levels is deliberate and critical: the levels serve as additional filters to validate range breakouts within the channel, and vice versa, channel breakouts enhance the importance of Fibonacci levels by adjusting to the market context, represented by the specific length and displacement within the chart.
Fibonacci levels are updated with each new bar, and the detection of Break of Range (BoR) is integrated with the Fibonacci level plot to highlight significant breakout points. A unique aspect of this script is the way breakouts are identified not only by the price crossing certain Fibonacci levels but also by volume context and candlestick patterns, such as Engulfing patterns, which signal potential changes in market trends.
This interaction between the Linear Regression Channel and Fibonacci Levels, for example, a bullish price breakout above the upper channel boundary simultaneously crossing a significant Fibonacci level, suggests not only a possible continuation of the uptrend but also a strong support level established. Similarly, a bearish price breakout below the lower channel boundary, coinciding with a Fibonacci level, may signal a trend reversal confirmation and a new resistance level.
This script delves further into signal convergence, where the interaction between Break of Range and Fibonacci levels marks bullish and bearish breakouts, respectively, and when these signals coincide with breakouts of any Fibonacci level, they provide cross-confirmation that increases confidence in the generated signal. "BoR+Fib🔼" and "BoR+Fib🔽."
Additionally, the script introduces an innovative implementation of the Linear Regression Channel, which uses a customizable period and standard deviation to plot upper and lower trendlines. This approach allows traders to anticipate potential re-entry points after a breakout, as prices often retest the channel edges, providing low and high entry confirmation opportunities.
A differentiating technical aspect is the conditional logic implemented for bullish and bearish trend signal confirmation. For example, the script calibrates signals based on the intersection of price action with critical Fibonacci levels and confirmed candlestick patterns, enhancing signal reliability compared to using these indicators in isolation.
Key Features:
1. Dynamic calculation of Fibonacci levels.
2. Detection of internal price range breakouts (Break of Range).
3. Linear Regression Channel.
4. Detection of candlestick patterns (Engulfing Patterns).
Dynamic Fibonacci Level Calculation and Internal Range Breakout Detection (Break of Range):
The fusion of Fibonacci levels with the detection of internal range breakouts is crucial because it allows for precise identification of market turning points. Fibonacci levels act as initial filters, indicating potential support and resistance zones. When the price crosses a key Fibonacci level, especially in conjunction with an internal range breakout, the resulting signal is stronger and more reliable. This confluence significantly increases the probability of sustainable price movement.
Broken:
Function: The code identifies breakouts when the price crosses a key Fibonacci level (0%, 100%). A breakout is significant if the price crosses and holds beyond these levels.
Interaction: Breakouts validate Fibonacci levels. For example, a breakout above the 0% Fibonacci level can confirm an uptrend.
Structure Change:
Function: In the code, Structure Change can be interpreted through the detection of pivot patterns and price structure change signals, which we identify as Break of Range.
Interaction: This component acts as confirmation for range breakouts and Fibonacci levels. For example, if a range breakout is followed by a change in price structure (such as the formation of a new higher high), it strengthens the validity of the range breakout signal.
"BoR+Fib🔽": Indicates a bearish range breakout that has also crossed a Fibonacci level downward. This can be interpreted as a sell signal or a bearish trend indication.
"BoR+Fib🔼": Represents a bullish range breakout that has also crossed a Fibonacci level upward. It can be interpreted as a buy signal or a bullish trend indication.
Linear Regression Channel:
Function: The Linear Regression Channel is calculated and drawn using a defined number of bars to establish the overall market trend. Calculations involve summing and averaging closing prices and their products with the time index to calculate the regression line and its standard deviation. The script uses this channel to contextualize Fibonacci signals and range breakouts, with breakouts occurring in the direction of the channel's trend.
Interaction: Provides context to Fibonacci signals and range breakouts. For example, if a range breakout occurs in the same direction as indicated by the Linear Regression Channel, this adds credibility to the signal.
Integration Benefit: The Linear Regression Channel provides an overall trend context. When a range breakout signal and a Fibonacci level coincide within the direction indicated by the channel, the signal's validity is strengthened.
Signal Convergence: An ideal scenario occurs when all elements converge. For example, a good entry point could be when the price experiences a range breakout from a significant Fibonacci level, there is a change in price structure in the same direction, and all of this aligns with the trend indicated by the Linear Regression Channel.
Dynamic Volatility Visualization: Adjusts the width of the Linear Regression Channel based on market volatility.
Validation and Entry Confirmation after Linear Regression Channel Breakout:
Breakout Validation: The Linear Regression Channel breakout is validated not only by price crossing but also by an increase in volume, suggesting a significant breakout rather than a temporary fluctuation.
Entry Confirmation ('Low and High Entry Confirmation'):
Confirmation Bars: A specific number of bars (configurable entry) closing outside the channel are required to confirm an entry. This reduces the risk of false signals.
Channel Re-Test: After the breakout, the price often retests the channel's edge. An entry is confirmed if the price bounces from this area, validating the initial breakout.
Auxiliary Indicators: Oscillators or momentum indicators are used to confirm trend strength after the breakout.
Candlestick Pattern Detection (Engulfing Patterns):
Engulfing Pattern Identification: bullishEngulfing is activated in a bullish pattern with a previous bearish trend and a specific bullish candle. bearishEngulfing is activated in a bearish pattern with a previous bullish trend and a specific bearish candle.
Special Trend Signals:
Bullish signals are displayed as blue circles with "⬆️," while bearish signals are displayed as red circles with "⬇️."
Bullish Signals: Indicate that the price has crossed above certain Fibonacci levels, and the current trend is considered bullish, as the most recent closing price is higher than the closing price of a specific bar in the past.
Bearish Signals: Indicate that the price has crossed below certain Fibonacci levels, and the current trend is considered bearish, as the most recent closing price is lower than the closing price of a specific bar in the past.
Integration with 3Commas for Automation:
Signal Automation: The ability to integrate with platforms like 3Commas allows for the automatic execution of
strategies based on the script's signals, where a bot could execute trades based on the chart-generated signals, facilitating more efficient trading, reducing reaction time, and as an automated script, we only need to input our short Bot Id or our Long Bot ID into the previously loaded message alert.
Español:
La singularidad de este script radica en la sinergia y la interacción dinámica que resulta de la combinación avanzada de elementos clave del análisis técnico en la forma en que fusiona estratégicamente los Niveles de Fibonacci con el Canal de Regresión Lineal y la estructura interna del precio creando un sistema de análisis de mercado altamente sinérgico.
El Canal de Regresión Lineal, dibujado a partir de la regresión de precios y su desviación estándar sobre un número definido de barras, ofrece una representación gráfica de la tendencia predominante del mercado. La combinación de este canal con los Niveles de Fibonacci es deliberada y crítica: los niveles sirven como filtros adicionales para validar las rupturas de rango dentro del canal, y viceversa, las rupturas del canal potencian la importancia de los niveles de Fibonacci ajustándose al contexto del mercado, representado por la longitud y desplazamiento específicos dentro del gráfico.
Los niveles de Fibonacci se actualizan con cada nueva barra, La detección de rupturas de rango (Break of Range) se integra con la trama de niveles de Fibonacci para destacar los puntos de ruptura significativos. Un enfoque único de este script es la manera en que las rupturas no solo se identifican por el cruce de precios de ciertos niveles de Fibonacci sino también por el contexto de volumen y patrones de velas, como los patrones Engulfing, que señalan cambios potenciales en la tendencia del mercado.
Esta interacción entre el Canal de Regresión Lineal y los Niveles de Fibonacci Por ejemplo: una ruptura alcista del precio a través del límite superior del canal al mismo tiempo que cruza un nivel de Fibonacci significativo sugiere no solo una posible continuación de la tendencia alcista sino también un fuerte nivel de soporte establecido. Similarmente, una ruptura bajista del precio a través del límite inferior del canal, coincidiendo con un nivel de Fibonacci, puede señalar una confirmación de cambio de tendencia y un nuevo nivel de resistencia.
Este script profundiza aún más en la confluencia de señales, donde la interacción entre Break of Range y los niveles de Fibonacci marcan rupturas alcistas y bajistas respectivamente, y cuando estas señales coinciden con rupturas del de cualquier nivel de Fibonacci, proporcionan una confirmación cruzada que aumenta la confianza en la señal generada. "BoR+Fib🔼" y "BoR+Fib🔽"
Además, el script presenta una innovadora implementación de Canal de Regresión Lineal, que utiliza un periodo personalizable y una desviación estándar para trazar las líneas de tendencia superior e inferior. Este enfoque permite a los traders anticipar posibles puntos de reentrada después de una ruptura, con el precio a menudo retestando los bordes del canal, proporcionando así oportunidades de confirmación de entrada baja y alta.
Un aspecto técnico diferenciador es la lógica condicional implementada para la confirmación de señales de tendencia alcista y bajista. Por ejemplo, el script calibra señales basadas en la intersección de la acción del precio con los niveles críticos de Fibonacci y los patrones de velas confirmados, mejorando la confiabilidad de las señales en comparación con el uso de estos indicadores de forma aislada.
Características Principales:
1. Cálculo dinámico de niveles de Fibonacci.
2. Detección de rupturas internas del rango de precios (Break of Range).
3. Canal de regresión lineal.
4. Detección de patrones de velas (Patrones Engulfing).
Cálculo Dinámico de Niveles de Fibonacci y Detección de Rupturas Internas (Break of Range):
La fusión de los niveles de Fibonacci con la detección de rupturas internas del rango es crucial porque permite identificar con precisión los puntos de inflexión del mercado. Los niveles de Fibonacci funcionan como filtros iniciales, indicando potenciales zonas de soporte y resistencia. Cuando el precio cruza un nivel clave de Fibonacci, especialmente en conjunto con una ruptura interna del rango, la señal resultante es más robusta y fiable. Esta confluencia incrementa significativamente la probabilidad de que el movimiento del precio sea sostenible
Broken:
Función: El código identifica las rupturas cuando el precio cruza un nivel de Fibonacci clave (0%, 100%). Una ruptura es significativa si el precio cruza y se mantiene más allá de estos niveles.
Interacción: Las rupturas validan los niveles de Fibonacci. Por ejemplo, una ruptura por encima del nivel de Fibonacci del 0% puede confirmar una tendencia alcista.
Cambio de Estructura:
Función: En el código, el Cambio de Estructura se puede interpretar a través de la detección de patrones de pivote y señales de cambio en la estructura de precios, que identificamos como Break of Range.
Interacción: Este componente actúa como una confirmación de las rupturas de rango y los niveles de Fibonacci. Por ejemplo, si una ruptura de rango es seguida por un cambio en la estructura de precios (como la formación de un nuevo máximo más alto), esto refuerza la validez de la señal de ruptura de rango.
"BoR+Fib🔽": Indica una ruptura bajista del rango que también ha cruzado un nivel de Fibonacci hacia abajo. Esto puede interpretarse como una señal de venta o una indicación de tendencia bajista.
"BoR+Fib🔼": Representa una ruptura alcista del rango que también ha cruzado un nivel de Fibonacci hacia arriba. Puede interpretarse como una señal de compra o una indicación de tendencia alcista.
Canal de Regresión Lineal:
Función: El Canal de Regresión Lineal se calcula y dibuja utilizando un número definido de barras para establecer la tendencia general del mercado. Los cálculos involucran la suma y el promedio de los precios de cierre y sus productos con el índice de tiempo, para calcular la línea de regresión y su desviación estándar, el script utiliza este canal para contextualizar las señales de Fibonacci y las rupturas de rango, con rupturas que ocurren en la dirección de la tendencia del canal.
Interacción: Proporciona contexto a las señales de Fibonacci y rupturas de rango. Por ejemplo, si una ruptura de rango ocurre en la misma dirección que la tendencia indicada por el Canal de Regresión Lineal, esto añade credibilidad a la señal.
Beneficio de la Integración:El Canal de Regresión Lineal proporciona un contexto de tendencia general. Cuando una señal de ruptura de rango y un nivel de Fibonacci coinciden dentro de la dirección de la tendencia indicada por el canal, se fortalece la validez de la señal.
Convergencia de Señales: Un escenario ideal ocurre cuando todos los elementos convergen. Por ejemplo, un buen punto de entrada podría ser cuando el precio experimenta una ruptura de rango desde un nivel de Fibonacci importante, hay un cambio de estructura en la misma dirección, y todo esto ocurre en línea con la tendencia indicada por el Canal de Regresión Lineal.
Visualización de Volatilidad Dinámica: Ajusta el ancho del canal de regresión lineal en función de la volatilidad del mercado.
Validación y Confirmación de la Entrada después de la Ruptura del Canal de Regresión:
Confirmación de Ruptura: La ruptura del canal de regresión se valida no solo por el cruce del precio, sino también por un aumento en el volumen, lo que sugiere una ruptura significativa en lugar de una fluctuación temporal.
Confirmación de Entrada ('Confirmación de Entrada Baja y Alta'):
Barras de Confirmación: Se requiere un número específico de barras (entrada configurable) que cierren fuera del canal para confirmar una entrada. Esto reduce el riesgo de señales falsas.
Re-Test del Canal: Después de la ruptura, el precio a menudo vuelve a probar el borde del canal. Una entrada se confirma si el precio rebota desde esta área, validando la ruptura inicial.
Indicadores Auxiliares: Se utilizan osciladores o indicadores de impulso para confirmar la fuerza de la tendencia después de la ruptura.
Detección de Patrones de Velas (Patrones Engulfing):
Identificación de Patrones Engulfing: bullishEngulfing se activa en un patrón alcista con una tendencia bajista previa y una vela alcista específica. bearishEngulfing se activa en un patrón bajista con una tendencia alcista previa y una vela bajista específica.
Señales Especiales de Tendencia:
Las señales alcistas se muestran como círculos azules con "⬆️", mientras que las señales bajistas se muestran como círculos rojos "⬇️".
Señales Alcistas: Indican que el precio ha cruzado por encima de ciertos niveles de Fibonacci y la tendencia actual se considera alcista, ya que el precio de cierre más reciente es mayor que el precio de cierre de una barra específica en el pasado.
Señales Bajistas: Indican que el precio ha cruzado por debajo de ciertos niveles de Fibonacci y la tendencia actual se considera bajista, ya que el precio de cierre más reciente es menor que el precio de cierre de una barra específica en el pasado.
Integración con 3Commas para Automatización:
Automatización de Señales: La capacidad de integrar con plataformas como 3Commas permite la ejecución automática de estrategias basadas en las señales del script donde un bot podría ejecutar operaciones basadas en las señales generadas por el gráfico., facilitando un trading más eficiente y reduciendo el tiempo de reacción y como un script automatizado solo necesitamos poner en la alerta del mensaje previamente cargado nuestro short Bot Id o nuestro Long Bot ID.

All Support and Resistance Levels [PINESCRIPTLABS]First, we observe the Light Blue Macro Supports and the Pink Macro Resistances. These channels are automatically formed based on market data, identifying pivot points in price history and determining the strength of these levels based on the number of pivot points within these same channels. When the price interacts with the macro Supports, we have a strong reaction that we can take advantage of in two ways:
1. The first and most common, as we can see in the chart, is that these zones elicit a strong reaction, and the price respects the channel. For us, as traders, it signifies a pivot point where we can initiate a trade, either a buy at the macro Support or a sell at the macro Resistance.
2. The second way to use them, for which this algorithm is also prepared, is in case a movement occurs where the price breaks these Macro Supports or Macro Resistances. We have a special alert that will notify us because when these macro channels are broken, they tend to do so violently in a move that we can also capitalize on. Usually, when such a breakout occurs, we will visit the next support or resistance channel, which can bring us significant benefits.
The following complex and highly accurate calculation provided by this indicator allows us to work with price supports and resistances within the internal structure of macro channels. As we can see in the chart, "boxes" are formed that represent the detected support and resistance areas. It also detects breakouts when the price crosses below the support "box" or above the resistance "box" and displays labels on the chart indicating when the breakout occurred, all in real-time. But here comes something very special: the algorithm also has a calculation that, as we see in the chart, there are occasions when the breakout occurs, but the price returns to the support or resistance "box" and is detected. At this moment, a label appears on the chart indicating a possible confirmation of the breakout. In other words, as the price initially broke out but returned to the "box," the algorithm will notify us with another label and a special alert when the price confirms the breakout.
At the same time, we can see in the chart that the algorithm also provides us with a volume profile that allows us to see where the most trading activity has concentrated based on price levels. We can also use it to identify support and resistance levels based on the point of control (POC) and value area levels. As we can see in the chart, there are labels with the exact price where the highest volume was traded. The top label in the chart shows the highest price, and the last label we see is for the lowest price. These displayed labels are within the defined range of retrocession or Lookback Length, which we can configure in our indicator. As we observe, the algorithm shows a strong confluence between the Macro Support channels and the volume profile labels, confirming the strongest areas of the range.
Finally, after calculating supports and resistances from three different perspectives, the algorithm provides us with a macro view of the price in the form of trend lines. In other words, it shows us supports and resistances in the form of diagonal channels where we can see trends in the market and areas where the price has historically encountered difficulties in advancing or retreating, which we can corroborate with the supports and resistances mentioned at the beginning.
As we can see in the chart, the algorithm also shows us labels with the exact price where angular price supports and resistances are located. These calculations are very important as they provide a trend perspective, and we can get an idea of where the price is headed, combining these with the other support and resistance calculations.
Remember that all the previous calculations have their own alerts for when supports or resistances are broken, or in the case of new channels being created, also when there is a breakout of a box or a confirmation of a breakout.
The second type of alert from the indicator is configured to make our indicators work for us without the need to be present on the chart, thanks to special programming within the indicator's code. It will execute automatic buys and sells on our preferred exchange through an alert configured for the 3Commas bot. All you need to do is input your Bot ID, provided by 3Commas, into the alert. All premium indicators come with a configuration explanation that will guide you in detail on where to input your Bot ID.
ESPAÑOL:
En primer lugar, observamos los Macro Soportes en color azul claro y las Macro Resistencias en color rosa. Estos canales se forman automáticamente en función de los datos del mercado, identificando puntos de pivote en el historial de precios y determinando la fuerza de estos niveles según la cantidad de puntos de pivote dentro de estos mismos canales. Cuando el precio interactúa con los macro Soportes, tenemos una fuerte reacción que podemos aprovechar de dos formas:
1. La primera y más común, como observamos en el gráfico, es que estas zonas provocan una fuerte reacción, y el precio respeta el canal. Para nosotros, como traders, significa un punto de pivote donde podemos generar una entrada, ya sea de compra en el macro soporte o de venta en la macro resistencia.
2. La segunda forma de utilizarlos, para la cual este algoritmo también está preparado, es en caso de que se genere un movimiento en el que el precio rompa estos Macro Soportes o Macro Resistencias. Contamos con una alerta especial que nos avisará, ya que al romperse estos macro canales suelen hacerlo con violencia en un movimiento que también podemos aprovechar. Regularmente, cuando existe este rompimiento, visitaremos el siguiente canal de soporte o resistencia, lo que nos puede traer grandes beneficios.
El siguiente cálculo complejo y muy preciso que nos ofrece este indicador nos permite trabajar con soportes y resistencias del precio dentro de la estructura interna de los canales macro. Como observamos en el gráfico, se producen "boxes" que representan las áreas de soporte y resistencia detectadas. Además, detecta breakouts cuando el precio cruza por debajo del "box" de soporte o por encima del "box" de resistencia y muestra etiquetas en el gráfico que nos indican cuándo ocurrió el breakout, todo esto en tiempo real. Pero aquí viene algo super especial: el algoritmo también tiene un cálculo que, como vemos en el gráfico, hay ocasiones en las que el breakout ocurre, pero el precio retorna al "box" de soporte o resistencia y es detectado. En este momento, aparece una etiqueta en el gráfico que nos muestra que estamos ante una posible confirmación del breakout. Es decir, como el precio había hecho en primer lugar el breakout pero regresó al "box", el algoritmo nos avisará con otra etiqueta y alerta especial cuando el precio confirme el breakout.
Al mismo tiempo, observamos en el gráfico que el algoritmo también nos muestra un perfil de volumen que nos permite ver dónde se ha concentrado la mayor actividad de negociación en función de los niveles de precios. También podemos usarlo para identificar niveles de soporte y resistencia basados en el punto de control (POC) y los niveles de valor (Value Area). Como vemos en el gráfico, tenemos etiquetas con el precio exacto donde se negoció la mayor cantidad de volumen. La etiqueta superior del gráfico nos muestra el precio más alto, y la última etiqueta que observamos es la de la parte baja, que nos indica el precio más bajo. Estas etiquetas mostradas están dentro del rango de retroceso definido o Lookback Length, que podemos configurar en nuestro indicador. Como observamos, el algoritmo nos muestra una fuerte confluencia entre los canales de soporte Macro y las etiquetas del perfil de volumen, lo que nos confirma las áreas más fuertes del rango.
Por último, después de hacer los cálculos de soportes y resistencias desde tres perspectivas distintas, el algoritmo nos proporciona una visión macro del precio en forma de líneas de tendencia. Es decir, nos muestra soportes y resistencias en forma de canales diagonales donde tendremos representadas las tendencias en el mercado y áreas en las que el precio históricamente ha encontrado dificultades para avanzar o retroceder, lo que podemos corroborar con los soportes y resistencias de los que hablamos al principio.
Como observamos en el gráfico, el algoritmo también nos muestra las etiquetas con el precio exacto donde se encuentran los soportes angulares del precio y las resistencias angulares. Estos cálculos son importantísimos, ya que nos ofrecen una perspectiva de tendencia y podemos tener una visión de hacia dónde se dirige el precio, combinando estos con los otros cálculos de soportes y resistencias.
Recuerden que todos los cálculos anteriores tienen su propia alerta para cuando los soportes o resistencias se quiebren o en su caso, se creen nuevos canales, también cuando haya una ruptura de un "box" o una confirmación de ruptura.
El segundo tipo de alerta del indicador está configurada para que nuestros indicadores trabajen para nosotros sin necesidad de estar presentes en el gráfico, esto mediante una programación especial dentro del código del indicador que realizará compras y ventas automáticas en nuestro Exchange de preferencia mediante una alerta configurada para el bot 3Commas. Solo bastará con que pongamos nuestro número de Bot o Bot ID que da el proveedor de 3Commas y lo insertemos en la alerta. Todos los indicadores premium tienen en su configuración una explicación detallada sobre dónde poner tus Bot ID.