Crypto Scanner v4This guide explains a version 6 Pine Script that scans a user-provided list of cryptocurrency tokens to identify high probability tradable opportunities using several technical indicators. The script combines trend, momentum, and volume-based analyses to generate potential buying or selling signals, and it displays the results in a neatly formatted table with alerts for trading setups. Below is a detailed walkthrough of the script’s design, how traders can interpret its outputs, and recommendations for optimizing indicator inputs across different timeframes.
## Overview and Key Components
The script is designed to help traders assess multiple tokens by calculating several indicators for each one. The key components include:
- **Input Settings:**
- A comma-separated list of symbols to scan.
- Adjustable parameters for technical indicators such as ADX, RSI, MFI, and a custom Wave Trend indicator.
- Options to enable alerts and set update frequencies.
- **Indicator Calculations:**
- **ADX (Average Directional Index):** Measures trend strength. A value above the provided threshold indicates a strong trend, which is essential for validating momentum before entering a trade.
- **RSI (Relative Strength Index):** Helps determine overbought or oversold conditions. When the RSI is below the oversold level, it may present a buying opportunity, while an overbought condition (not explicitly part of this setup) could suggest selling.
- **MFI (Money Flow Index):** Similar in concept to RSI but incorporates volume, thus assessing buying and selling pressure. Values below the designated oversold threshold indicate potential undervaluation.
- **Wave Trend:** A custom indicator that calculates two components (WT1 and WT2); a crossover where WT1 moves from below to above WT2 (particularly near oversold levels) may signal a reversal and a potential entry point.
- **Scanning and Trading Zone:**
- The script identifies a *bullish setup* when the following conditions are met for a token:
- ADX exceeds the threshold (strong trend).
- Both RSI and MFI are below their oversold levels (indicating potential buying opportunities).
- A Wave Trend crossover confirms near-term reversal dynamics.
- A *trading zone* condition is also defined by specific ranges for ADX, RSI, MFI, and a limited difference between WT1 and WT2. This zone suggests that the token might be in a consolidation phase where even small moves may be significant.
- **Alerts and Table Reporting:**
- A table is generated, with each row corresponding to a token. The table contains columns for the symbol, ADX, RSI, MFI, WT1, WT2, and the trading zone status.
- Visual cues—such as different background colors—highlight tokens with a bullish setup or that are within the trading zone.
- Alerts are issued based on the detection of a bullish setup or entry into a trading zone. These alerts are limited per bar to avoid flooding the trader with notifications.
## How to Interpret the Indicator Outputs
Traders should use the indicator values as guidance, verifying them against their own analysis before making any trading decision. Here’s how to assess each output:
- **ADX:**
- **High values (above threshold):** Indicate strong trends. If other indicators confirm an oversold condition, a trader may consider a long position for a corrective reversal.
- **Low values:** Suggest that the market is not trending strongly, and caution should be taken when considering entry.
- **RSI and MFI:**
- **Below oversold levels:** These conditions are traditionally seen as signals that an asset is undervalued, potentially triggering a bounce.
- **Above typical resistance levels (not explicitly used here):** Would normally caution a trader against entering a long position.
- **Wave Trend (WT1 and WT2):**
- A crossover where WT1 moves upward above WT2 in an oversold environment can signal the beginning of a recovery or reversal, thereby reinforcing buy signals.
- **Trading Zone:**
- Being “in zone” means that the asset’s current values for ADX, RSI, MFI, and the closeness of the Wave Trend lines indicate a period of consolidation. This scenario might be suitable for both short-term scalping or as an early exit indicator, depending on further market analysis.
## Timeframe Optimization Input Table
Traders can optimize indicator inputs depending on the timeframe they use. The following table provides a set of recommended input values for various timeframes. These values are suggestions and should be adjusted based on market conditions and individual trading styles.
Timeframe ADX RSI MFI ADX RSI MFI WT Channel WT Average
5-min 10 10 10 20 30 20 7 15
15-min 12 12 12 22 30 20 9 18
1-hour 14 14 14 25 30 20 10 21
4-hour 16 16 16 27 30 20 12 24
1-day 18 18 18 30 30 20 14 28
Adjust these parameters directly in the script’s input settings to match the selected timeframe. For shorter timeframes (e.g., 5-min or 15-min), the shorter lengths help filter high-frequency noise. For longer timeframes (e.g., 1-day), longer input values may reduce false signals and capture more significant trends.
## Best Practices and Usage Tips
- **Token Limit:**
- Limit the number of tokens scanned to 10 per query line. If you need to scan more tokens, initiate a new query line. This helps manage screen real estate and ensures the table remains legible.
- **Confirming Signals:**
- Use this script as a starting point for identifying high potential trades. Each indicator’s output should be used to confirm your trading decision. Always cross-reference with additional technical analysis tools or market context.
- **Regular Review:**
- Since the script updates the table every few bars (as defined by the update frequency), review the table and alerts regularly. Market conditions change rapidly, so timely decisions are crucial.
## Conclusion
This Pine Script provides a comprehensive approach for scanning multiple cryptocurrencies using a combination of trend strength (ADX), momentum (RSI and MFI), and reversal signals (Wave Trend). By using the provided recommendation table for different timeframes and limiting the tokens to 20 per query line (with a maximum of four query lines), traders can streamline their scanning process and more effectively identify high probability tradable tokens. Ultimately, the outputs should be critically evaluated and combined with additional market research before executing any trades.
ابحث في النصوص البرمجية عن "crypto"

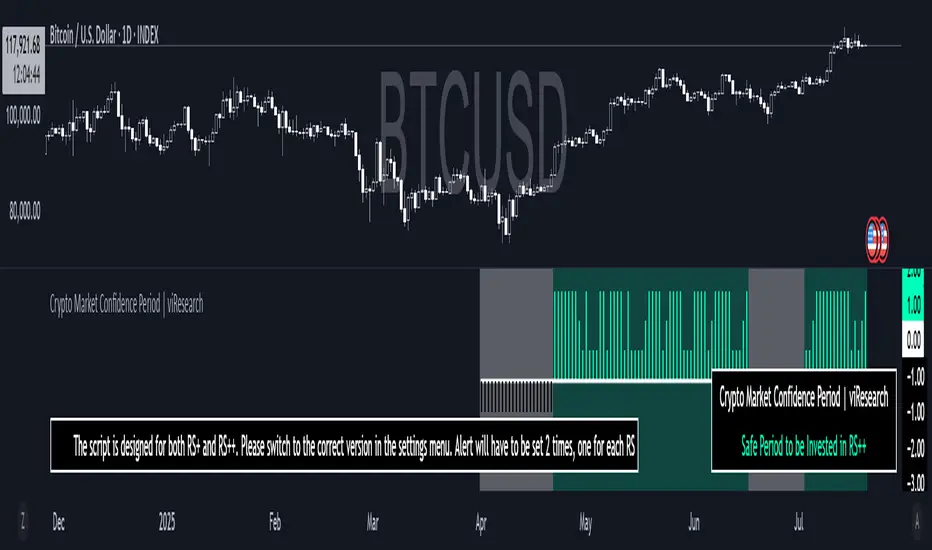
Crypto Market Confidence Period | viResearchCrypto Market Confidence Period | viResearch
Conceptual Foundation and Innovation
The "Crypto Market Confidence Period" indicator from viResearch offers traders a precise way to evaluate market conditions and identify safe investment periods in the crypto market. This tool combines market performance metrics across different assets and uses a dynamic approach to pinpoint periods of market confidence. By assessing historical performance and relative asset strength, the indicator classifies periods as either "safe" or "unsafe" for investment, helping traders make data-driven decisions. It is particularly useful for those looking to understand the cyclical nature of market trends and determine the optimal time for entering or exiting the market.
Technical Composition and Calculation
The "Crypto Market Confidence Period" indicator utilizes key market performance data, including price changes and historical trends, to evaluate the overall market climate. The core calculation involves comparing the system equity over a specified period (based on peak and nadir values) to determine periods of market confidence. The indicator calculates the highest and lowest points in system equity over a user-defined period, marking these as safe and unsafe periods. If the system equity reaches its highest value (peak), it indicates a "Safe Period" for investment, while a drop to its lowest value (nadir) signals an "Unsafe Period." These periods help traders assess when the market is more likely to experience mean reversion or continued trends.
Practical Applications
The "Crypto Market Confidence Period" indicator is designed to provide traders with a clear understanding of market conditions, specifically identifying safe and unsafe investment periods. By tracking system equity and evaluating market highs and lows, this tool can help traders make informed decisions about when to enter or exit trades. The key applications include:
Determining Mean Reversion Periods: The indicator highlights when the market is moving away from its average, signaling a potential mean reversion period. Traders can use this information to anticipate a reversal in market direction.
Identifying Trending Periods: When the market remains consistently in a "Safe Period," it may indicate that a trend is in motion, and the likelihood of continued price movement is higher. Traders can focus on trend-following strategies during these periods.
Advantages and Strategic Value
The "Crypto Market Confidence Period" indicator offers significant value by helping traders identify periods where market behavior is more predictable. This tool enhances trading strategies by distinguishing between periods of market stability (safe) and volatility (unsafe). Traders can use these insights to reduce risk during unsafe periods and capitalize on trends during safe periods.
Alerts and Visual Cues
The indicator includes alert conditions for both safe and unsafe periods. Alerts are triggered when the market enters a "Safe Period" or an "Unsafe Period," allowing traders to take action based on the market's current state. Additionally, the indicator provides visual cues, such as background color changes, to help traders quickly identify the market's condition and make timely decisions.
Summary and Usage Tips
The "Crypto Market Confidence Period" indicator is an invaluable tool for traders looking to manage risk and optimize their investment timing in the crypto market. By providing insights into market confidence, this indicator helps identify when the market is likely to revert to its mean or when a trend is likely to continue. Traders can use this tool to guide their decision-making, making it a versatile addition to any trading strategy.
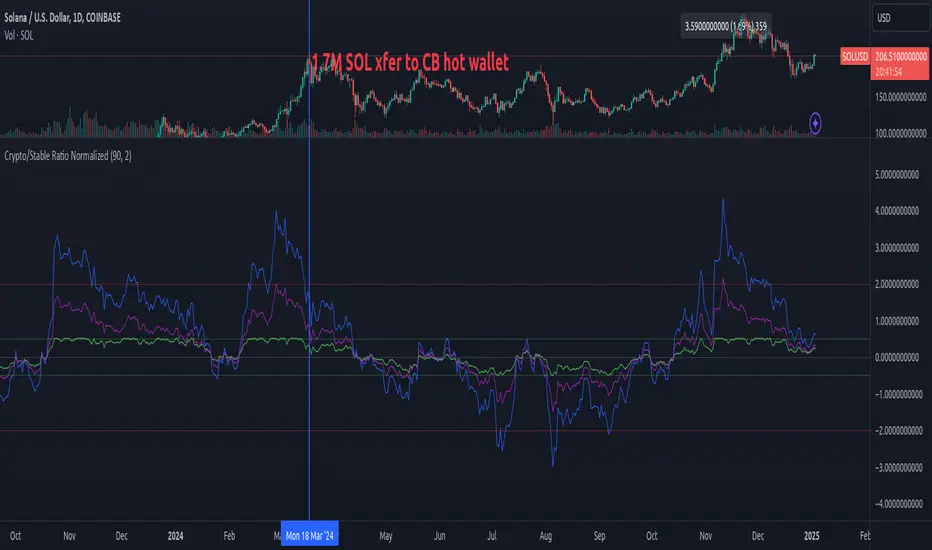
Crypto/Stable Mcap Ratio NormalizedCreate a normalized ratio of total crypto market cap to stablecoin supply (USDT + USDC + DAI). Idea is to create a reference point for the total market cap's position, relative to total "dollars" in the crypto ecosystem. It's an imperfect metric, but potentially helpful. V0.1.
This script provides four different normalization methods:
Z-Score Normalization:
Shows how many standard deviations the ratio is from its mean
Good for identifying extreme values
Mean-reverting properties
Min-Max Normalization:
Scales values between 0 and 1
Good for relative position within recent range
More sensitive to recent changes
Percent of All-Time Range:
Shows where current ratio is relative to all-time highs/lows
Good for historical context
Less sensitive to recent changes
Bollinger Band Position:
Similar to z-score but with adjustable sensitivity
Good for trading signals
Can be tuned via standard deviation multiplier
Features:
Adjustable lookback period
Reference bands for overbought/oversold levels
Built-in alerts for extreme values
Color-coded plots for easy visualization
Crypto Index Creator (MEMES & AI Supercycle Dominance, etc)This indicator aims to help to create any INDEX desired including but not limited to its Market Cap and Dominance on the crypto market.
This script was inspired originally by Murad's "Memecoins Dominance" but then I extended it to AI and can be extended to anything in fact, so you can create any index!
I made each token entry editable so that the script can survive the evolution of time as likely projects and INDEXES are going to change a lot, so that you can add/modify your own indices of preference if not listed by default and in order to make it future proof.
You can play with the settings, can compare to BTC, ETC, SOL, etc. for helping in your studies
You also have the option to check the info of each symbol on a table available on the settings, in order to help you figure out if there are any errors and also help you to easily check how the symbols are performing individually
Notes:
- Many projects are not like MEMECOINS that have fixed supply, normally VC projects have a very variable circulating supply, so you might want to update the info of the circulating supply for your projects to make it more accurate if you desire.
- For this script there is a limit of 32 Symbols, due to tradingview own limits, yet you can always "add" multiple projects per line as long as their circulating supply is the same.
- You might want to edit/sort the tickers of the top3, top5 and top10 if they follow bellow those top ranks, but this is not necessary if you don't care about Top 3-10 specific calculations.
- My default "indices" were made of token selections of mine as of November 2024, those defaults indices/tickers I might or might not update them eventually but you are free to adapt/modify the tickers in the settings as history evolves, and you can leave your own indexes on the comment section of this post for others to use
- As you might not be able to create/store multiple different indexes at the same time, you might want to add this indicator multiple times on your screen and then modify the tickers of each instance of this indicator, by that you can have multiple indexes.

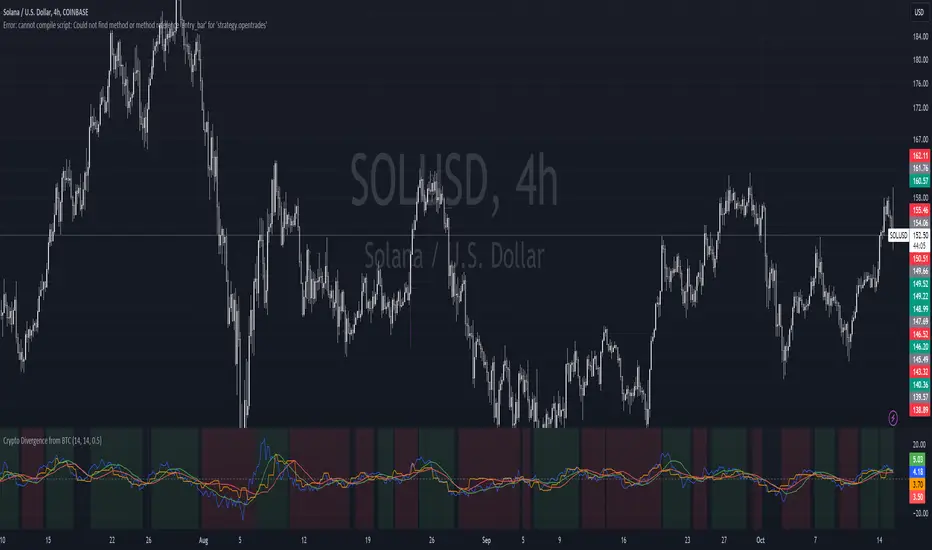
Crypto Divergence from BTCThis script is used to indicate when price action of a crypto coin is diverging significantly from that of BTC.
Explanation of the Script:
Inputs:
roc_length: The period used for calculating the Rate of Change.
ma_length: The period used for the moving average of the ROC.
threshold: The percentage difference that indicates a divergence.
Price Data:
The script retrieves the current asset's price and Bitcoin's price.
ROC Calculation:
The ROC for both the current asset and BTC is calculated based on the defined roc_length.
Moving Averages:
Simple moving averages (SMA) of the ROC values are calculated to smooth out the data.
Divergence Detection:
The indicator checks if the current asset's ROC MA is significantly higher or lower than Bitcoin's ROC MA based on the specified threshold.
Plotting:
The script plots the ROC values and their moving averages.
It also highlights the background in green when a bullish divergence is detected (when the asset is moving up while BTC is lagging) and in red for a bearish divergence.
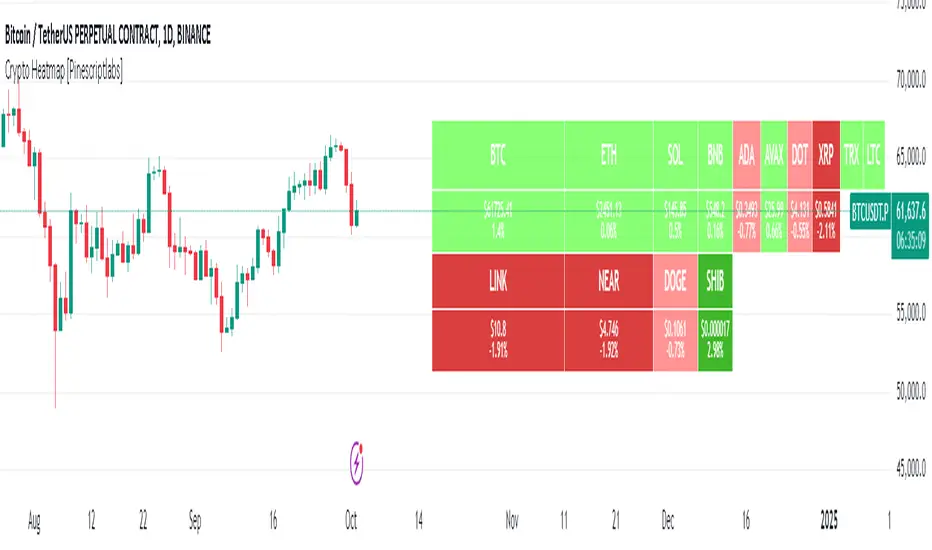
Crypto Heatmap [Pinescriptlabs]🌟 Crypto Heatmap is a visual tool that enables quick and efficient visualization of price behavior and percentage changes of various cryptocurrencies.
📊 It generates a heatmap to show variations in daily closing prices, helping traders quickly identify assets with the most movement.
📈 Percentage Change Calculation: It calculates the difference between the current price and the previous day's price, updating with each ticker.
✨ It uses a dynamic approach that adjusts colors based on market movements, making it easier to detect trading opportunities.
👀 You will notice for a moment that some cells disappear; this is because the table updates with each ticker to show real-time changes.
Español:
🌟 Crypto Heatmap es una herramienta visual que permite una rápida y eficiente visualización del comportamiento de precios y cambios porcentuales de varias criptomonedas.
📊 Genera un mapa de calor para mostrar las variaciones en los precios de cierre diario, ayudando a los traders a identificar rápidamente los activos con mayor movimiento.
📈 Cálculo del cambio porcentual: Calcula la diferencia entre el precio actual y el del día anterior, actualizándose en cada ticker.
✨ Utiliza un enfoque dinámico que ajusta los colores según los movimientos del mercado, facilitando la detección de oportunidades de trading.
Aquí tienes la traducción al español:
👀 **Observarás por un momento que algunas celdas desaparecen; esto es porque la tabla se actualiza en cada ticker para mostrar el cambio en tiempo real.**
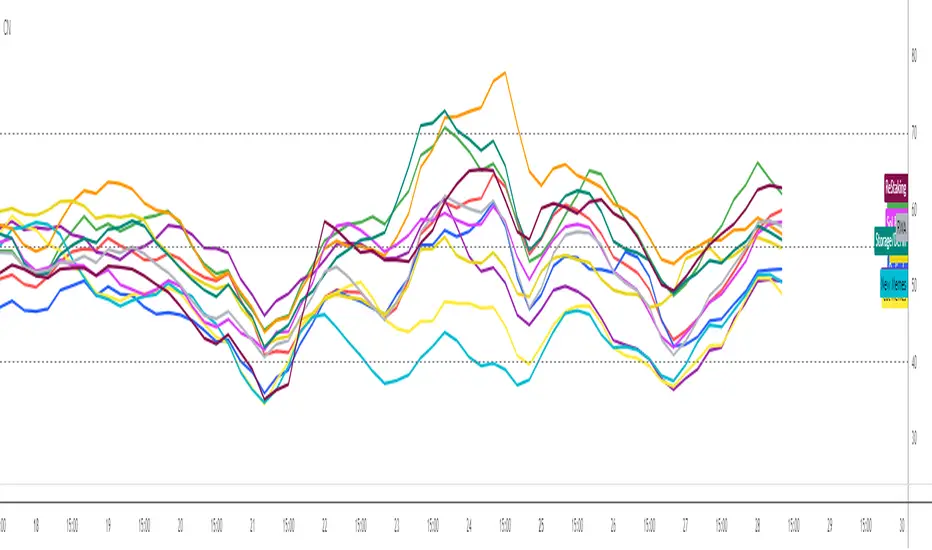
Crypto Narratives: Relative StrengthThis indicator offers a unique perspective on the crypto market by focusing on the relative strength of different narratives. It aggregates RSI data from multiple tokens associated with each narrative, providing a comprehensive view of the sentiment and momentum behind these themes. You can use it to take profit, find W bottoms or M tops to enter and exit narratives. and generally see what hot at the moment with lots of pretty colours.
This indicator tracks the relative strength of various crypto narratives using the Relative Strength Index (RSI) of representative tokens. It allows users to gauge the momentum and sentiment behind different themes in the cryptocurrency market.
Functionality:
The indicator calculates the average RSI values for the current leading tokens associated with ten different crypto narratives:
- AI (Artificial Intelligence)
- Ordinals
- DeFi (Decentralized Finance)
- Memes
- Gaming
- Level 1 (Layer 1 Protocols)
- Sol Betas (Solana Ecosystem)
- Storage/DePin
- RWA (Real-World Assets)
- ReStaking
he average RSI values for each narrative are calculated by summing the RSI values of the associated tokens and dividing by the number of tokens. The indicator plots the 3-period simple moving average (SMA) of each narrative's RSI using different colors and line styles.
Users can customize the RSI length, line width, and label offset through the input options. If the "Show Labels" option is enabled, the indicator displays labels for each narrative's RSI value on the most recent bar.
The indicator also includes horizontal lines representing overbought and oversold levels, which can be adjusted through the input options. Alerts are triggered when a narrative's RSI crosses above the overbought level or below the oversold level. The alerts include the narrative name, RSI value, and a suggestion to consider selling or buying.
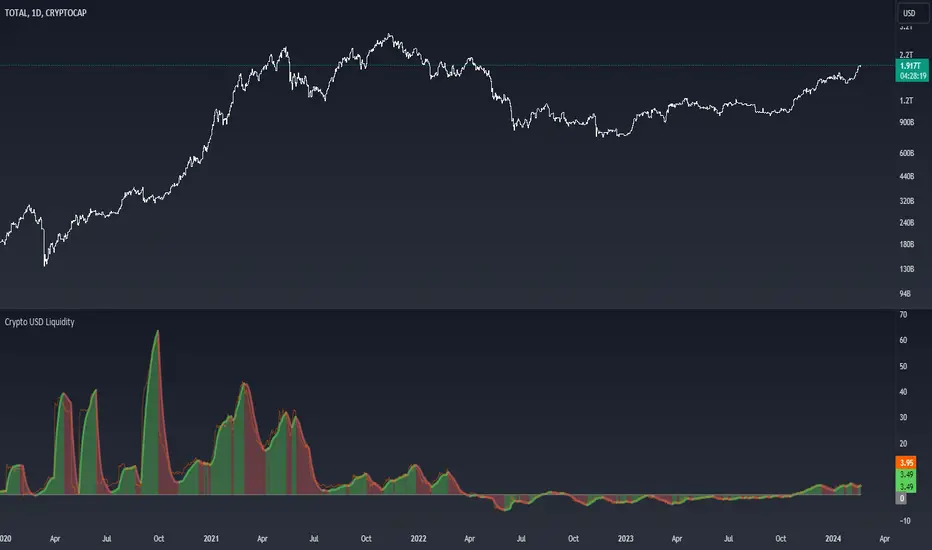
Crypto USD LiquidityThe "Crypto USD Liquidity " indicator is designed to offer a comprehensive analysis of liquidity dynamics within the cryptocurrency market, specifically focusing on various stablecoins. This versatile tool allows users to tailor their analysis by adjusting key parameters such as the Rate of Change (ROC) length and the smoothing rate.
The indicator incorporates a user-friendly interface with options to selectively display the supply data for major stablecoins, including USDT, BUSD, USDC, DAI, and TUSD . Users can toggle these options to observe and compare the liquidity trends of different stablecoin assets.
The total liquidity is computed as the summation of the selected stablecoin supplies, providing a holistic view of the overall crypto market liquidity. The Rate of Change (ROC) and its smoothing are then applied to the aggregated liquidity data. This process helps users identify trends and potential turning points in the liquidity landscape.
The visual representation on the chart includes a color-coded display: positive changing ROC values are shaded in green, indicating potential increases in liquidity, while negative values are shaded in red, suggesting potential decreases. This color scheme enhances the user's ability to quickly interpret the changing dynamics of stablecoin liquidity.
Moreover, the script includes a Zero Line for reference and overlays the raw ROC values for additional insight. The resulting chart not only serves as a powerful analytical tool for traders and investors but also contributes to a deeper understanding of the nuanced movements within the broader cryptocurrency market.
In summary, the "Crypto USD Liquidity" Pine Script indicator empowers users with a customizable and visually informative tool for analyzing and interpreting the complex dynamics of stablecoin liquidity, facilitating more informed decision-making in the realm of cryptocurrency trading and investment.
Crypto Candlestick Patterns - CN VersionIntroduction:
The candlestick chart has been used for centuries since the Japanese applications. Based on the candlestick charting, people developed candle pattern analysis. Now we have tons of books or articles illustrating the usage of reversal patterns and continuation patterns, and computers provide a faster and preciser way to recognize these pattern.
Originally we have a common *All Candlestick Patterns* indicator to use. This indicator works well for most of the markets or commodities including stocks and futures. However, for cryptocurrency market, quite a few patterns are not suitable anymore. For example, crypto markets are continuously running 7x24hrs and the big coins with good volume tend to have almost continuous price in commonly used time periods. Hence, original patterns with "window" or "jump" concepts are usually not applied to crypto.
For these issues, I modified the original *All Candlestick Patterns* indicator and introduced the Chinese version for people speaking such language.
Like most of the other indicators, I personally do not recommend anyone to simply follow the patterns it shows to enter the market. You may take these recognized patterns as a reference, and further actions on trading should be done with several other tools, such as MACD, RSI, Stochastic and etc.
Usage:
The application of this indicator is basically the same as the original *All Candlestick Patterns* and you will get an automatically generated pattern recognition by your computer system.
There are a few parameters to adjust for the indicator:
Trending Detection Settings: Here you can choose SMA-Fast, SMA-Fast/Slow or None detecting options to recognize the current market trend. This is a minor improvement from the original indicator and you can choose your preferred trending detecting settings by changing the length of SMA.
Candlestick Settings: You may adjust the rules to recognize the properties of candlesticks. I add a "perturbation" parameter here, which actually is an error tolerance for pattern recognition. Some seemingly pattern may not fulfill the strict rules of classic candlestick patterns, but we may recognize them by watch the charting on our own. Hence this error tolerance may show more potential patterns from the charting.
Plot Settings: It is the usually colour choice and providing options for bullish/bearish.
Pattern Settings: Here you can select the patterns that you would like to see from the charting. You can pick the preferred reversal patterns or choose to show all the patterns. It's all up to you!
Features:
Language Translation: Since this is a Chinese language version. I have replaced all the English explanation of patterns to Chinese ones. Move your mouse to the label, you will find a brief intro of the pattern and a notice about bullish or bearish signals it indicates.
Alerts: As the same as the original one, we will have the alert options from this indicator. All the alerts and their messages are Chinese. You can activate alerts based on this indicator from the alert management section, as the same as many other indicators you have used before.
Future Improvements:
For now I am satisfied with the work I have done, and I may apply it to several charts. It's welcome for any users to take a look at the codes and put modifications or improvements towards it. Currently most of the comments in the code are in Chinese language, since basically it's for Chinese speaking users, while the code itself and the parameter names should be pretty easy to understand in English. (I have been using English for writing in the past 8 years, hence this introduction is in English as well.)

Crypto Spot/Futures Dominance Indicator with AlertsFutures/Spot Dominance Indicator:
Overview:
The futures/spot dominance indicator is a versatile tool used by traders and analysts to assess the relative strength or dominance of the futures market in relation to the spot (or cash) market for a specific asset. It offers insights into market sentiment, potential arbitrage opportunities, and risk management while incorporating the VWAP indicator for added context.
How It Works:
This indicator automatically detects and adapts to the futures symbol applied to the chart, simplifying the setup for traders. However, it still necessitates manual input of the corresponding spot pair to ensure accuracy.
Automatic Futures Symbol Detection: The indicator starts by automatically detecting the futures symbol on the trading chart, eliminating the need for manual configuration. This ensures that the indicator is applied to the correct futures contract.
Manual Spot Pair Entry: To provide a reliable reference point for the comparison, traders must manually input the corresponding spot symbol via the indicator's inputs. For instance, if the indicator detects the BTCUSDT.P futures symbol, traders would manually enter the BTCUSDT spot symbol.
Gathering Data: The indicator collects historical price data for both the detected futures contract and the manually specified spot symbol. This data includes open, high, low, and close prices, as well as trading volume.
VWAP Calculation: To gain a deeper understanding of price trends and market dynamics, the indicator calculates the VWAP (Volume Weighted Average Price) for both the futures and spot markets. The VWAP places more weight on prices with higher trading volume, offering a weighted average that reflects market consensus.
Premium/Discount Calculation: By subtracting the VWAP of the spot market from the VWAP of the futures market, the indicator quantifies the premium or discount of the futures price concerning the spot price. A positive value indicates a premium, while a negative value suggests a discount.
Plotting: The premium/discount value is displayed as a line on the chart, often alongside moving averages or other smoothing techniques for improved trend analysis.
Alerts: In addition to its analysis capabilities, this indicator now includes alerts to enhance your trading experience. It alerts you in the following scenarios:
Premium Above Average: Notifies you when the premium crosses above the average line.
Premium Below Average: Alerts you when the premium crosses below the average line.
Premium Above Zero: Provides an alert when the premium crosses above the zero line.
Premium Below Zero: Generates an alert when the premium crosses below the zero line.
Benefits of the Futures/Spot Dominance Indicator:
Sentiment Analysis: Traders use the indicator to assess market sentiment. A futures premium might signify bullish sentiment, while a discount could indicate bearish sentiment.
Arbitrage Opportunities: Identifying price discrepancies between futures and spot markets can help traders spot arbitrage opportunities, where they can profit from price differentials.
Risk Management: The indicator assists in evaluating risks associated with futures positions, helping traders manage their exposure effectively.
Trend Confirmation: When used in conjunction with other technical indicators, futures/spot dominance, along with VWAP, can provide additional confirmation of price trends.
Hedging: Investors and corporations use this tool to gauge the effectiveness of hedging strategies based on futures contracts.
Speculative Trading: Traders and investors use the indicator to inform speculative positions, aligning their trades with perceived market strength or weakness.
Insightful Analysis: Futures/spot dominance analysis, enriched by VWAP data, offers insights into market behavior during specific events or changes in economic conditions.
In summary, the futures/spot dominance indicator, with its integration of VWAP and automatic futures symbol detection, provides traders and investors with a comprehensive tool to assess market dynamics. It aids in sentiment analysis, risk management, and trend confirmation while offering potential arbitrage opportunities. The newly added alerts enhance the indicator's functionality, providing timely notifications of key market events. However, it relies on manual input of the corresponding spot pair to ensure precise comparisons between futures and spot markets. It should be used alongside other analysis techniques for a well-rounded view of the market.

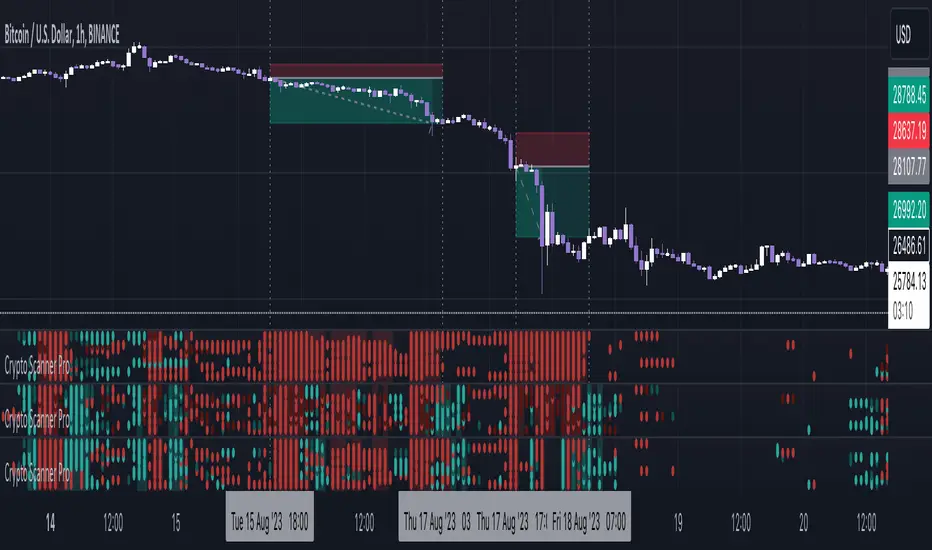
Crypto Scanner Pro [FxScripts]***** FEATURES *****
Crypto Scanner Pro is both an indicator and market scanner combined. The combination allows you to have multiple eyes across the market, all from a single chart.
Each scanner is comprised of an intuitively designed 3-in-1 tool that tracks the key metrics that drive markets.
They each use advanced algorithms to gather information from multiple data points, distilled into one simplified view.
***** TREND SCANNER *****
The Trend Scanner allows you to track price action across the wider market. Instantly see pattern shifts and emerging trends; when the market moves, you can move with it.
***** MOMENTUM SCANNER *****
The Momentum Scanner offers realtime insights into momentum shifts as they occur. This allows you to monitor false breakouts and catch the moves that matter.
***** VOLUME SCANNER *****
The Volume Scanner provides unique indications into where buy and sell volume is being placed. It offers a further way of determining entry and exit points or simply confirmation that a trend is underway.
***** INSTRUMENTS *****
Crypto Scanner Pro works effortlessly with the following large cap coins:
Avalanche, Bitcoin Cash, Bitcoin, BITO, BNB, Cardano, Chainlink, Dogecoin, Ethereum, Litecoin, Polkadot, Polygon, Shiba Inu, Solana, Stellar, Toncoin, XRP (Ripple) *
***** SETTINGS OVERVIEW *****
The scanner features the following customizable settings:
~~ Trend Settings ~~
Trend Filter - adjusting this will allow you to focus on short term trends (most suitable for scalping), medium or long term (best for swing trading).
Countertrend Strength - increases the sensitivity of weaker vs stronger countertrends. As countertrends are trends that run against the main trend, this will assist in detecting the strength of a pullback or reversal and allow you to either hold, exit or reverse the trade with confidence.
~~ Momentum Settings ~~
Momentum Filter - increase or decrease the sensitivity of the momentum scanner. Increase to avoid periods of low or weak momentum, decrease to highlight stronger surges in momentum.
~~ Volume Settings ~~
Volume Filter - increase or decrease the sensitivity of the volume scanner. Increase to avoid periods where buy and sell volume can potentially cancel each other out.
~~ Volatility Settings ~~
Volatility Offset - use this to fine tune the volatility filter. A higher value generally delays the volatility filter allowing for confirmation of stronger trends, a lower value will detect trend, momentum or volume movement sooner but may be less accurate.
Each scanner has its own setting allowing you to adjust how you monitor the underlying volatility for each.
As with all settings, we recommend adjusting this to your style of trading, instrument and timeframe.
~~ Alerts ~~
Alerts can be configured to send notifications when anything from 6-10 bullish or bearish dots are showing. Exit markers can be configured when anything from 2+ dots are revealed. This adds an extra layer of sensitivity for traders who appreciate complete control over their trade.
~~ Display Settings ~~
You have the ability to hide all colored dots and only show the background or, alternatively, hide the background and only show colored dots.
***** TRIAL PERIOD *****
We offer a FREE, no questions asked, 7-day trial with every new registration. Visit the link below to register.
* list subject to change as coins increase or decrease in popularity
Cryptocurrency Market Sentiment v1.0Introduction:
Capable of observing the market sentiment of the cryptocurrency market
The relative status of BTC and altcoins
How it works:
1. The general uptrend process of the cryptocurrency market is BTC → ETH → high-cap altcoins → low-cap altcoins. When funds cannot push up BTC's market cap, funds gradually flow into smaller-cap altcoins until the upward trend ends.
2. Select ETH as the representative of altcoins, and understand the sentiment and current stage
3. Mathematical principle : divide the price of ETH by the price of BTC, and then apply it to the RSI formula .
How to use it:
1. Similar to the RSI indicator , when CMS enters the overbought zone, it represents an active altcoin market, a passionate market sentiment , and the end of the uptrend.
2. When CMS enters the oversold zone, it indicates the leading stage of BTC in the rising trend or the capital flow back to BTC in the declining process .
3. If CMS is at a low level, long positions should focus on altcoins, and short positions should focus on BTC, and vice versa.
----------------------------------------------------------------------------------------------------------
简单介绍:
能够观察加密市场市场情绪
BTC和寨币的相对状态
如何工作:
1、加密市场一般的上涨过程为 BTC → ETH → 大市值山寨 → 小市值山寨,当资金无法推动大市值的BTC上涨时,资金就会逐渐流向市值较小的山寨,直到一轮上涨结束。
2、选取ETH作为altcoins的代表,通过ETH与BTC的关系来了解加密市场的情绪和目前上涨的阶段。
3、数学原理:将ETH的价格/BTC的价格,随后将其带入RSI公式
如何使用:
1、与RSI指标类似,当cms进入超买时,代表寨币市场的活跃,市场情绪热烈,上涨进入尾声。
2、当cms进入超卖时,为上涨中BTC领涨的阶段或下降过程中资金回流BTC。
3、如果cms在低位,做多应关注altcoins,做空应关注btc,反之亦然。

Trendmaster - Crypto Collated Open Interest OscillatorThe Crypto Collated Open Interest Oscillator collates Open Interest for Crypto Futures
Across the Crypto Exchanges and updated on the Daily Timeframe.
This is then smoothed to be actionable when massive Green structure on the oscillator
shows potentially a top before dumping and massive Red structure on the oscillator

CryptoCurrency Short X-RayIndicator to show the data on short sellers for cryptocurrencies. Color coded as the following:
Orange=Shortsellers are Shorting
Blue =Shortsellers are Covering
Red =Others are Selling
Green =Others are Buying
Includes lines to show the range that shortsellers have recently (within the last 1024 bars) been operating in to give indication on how extended they are, along with 25%, 50%, and 75% levels inbetween. Do not rely exclusively on this indicator as this can change wildly depending on the situation at hand, and be sure to select the short data in the settings that matches the ticker you're trading.

ScalpiusTrendCrypto trader and trading system developer Scott Phillips recently introduced a crypto trading system that specifies a set of rules for determining whether the crypto is in a trend. While the rules are not overly complex, they are complex enough that manual trend determination is somewhat laborious and prone to error. The ScalpiusTrend script is designed to automate this process. It operates is briefly summarized as follows:
1. It looks for a bar that breaks the Bollinger Band. That starts a pending trend.
2. When we find another bar with a higher high and higher close (uptrend) or lower low and lower close (downtrend), then the trend is confirmed.
3. The trend ends when the price touches the opposite Bollinger Band, or goes 20 bars without making a new low and new close.
The indicator is shown as a histogram plot below the main chart window. By default, the short black pending trend bars are off, but you can enable the Pending Bars checkbox in the indicator Settings menu to turn them on.

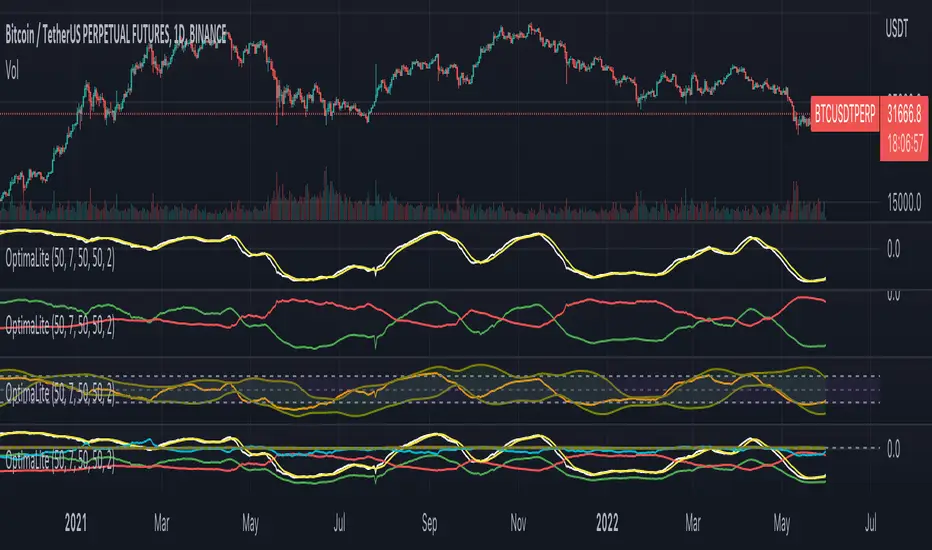
OptimaLiteThe OptimaLite algorithm performs the calculation of the integrated profits and losses for all the buyers and sellers that they have for the given “Calculation period” back in history for every time point. The idea is based on the principle of the accumulation and distribution of the capital among the market participants leading to the price trend change.
The indicator consists of the several components (signal lines):
1) “Return” – the main signal that reflects the integrated profits and losses delta (the “Return” moving average is added)
2) “Profit” and “Loss” – integrated profits and losses correspondingly
3) “Return Normalized” – the normalized “Return” for a given period of time
4) “Return High Frequency” – the “Return” signal compensated with the short-term fluctuations by RSI
How to use the indicator:
– Highs and lows of the indicator are associated with the overbought and oversold conditions points correspondingly.
– Crosses of the moving average with the main indicator line are associated with the trend change
– Divergencies between the indicator and price highs or lows can be used as signals for the trend reversal
– “Profit” and “Loss” signal lines intersections indicate the bulls/bears take over the market
Adjustments:
The periods of the calculation, averaging and normalization are the main parameters that could be tuned in order to optimize the indicator performance. Generally, the default values are sufficient for the nominal performance thought. But the best combination of those parameters is specific for each asset and timeframe, so it recommended to optimize them.
[Crypto] Dow theory strategy - Commission: 0.06 = Binance future fee.
- Autotrade by webhook to Binance future options:
1. Trend Identification:
a. UPTRENDTREND:
- HH_Trend: Higher High trend.
- HL_Trend: Higher Low trend.
b. DOWNTREND:
- LL_Trend: Lower Low trend.
- LH_Trend: Lower Low trend.
2. Open trades conditions:
a. LONG OPEN CONDITION: Điều kiện MUA.
- HH_E: Higher High entries.
- HL_E: Higher Low entries.
b. SHORT OPEN CONDITION: Điều kiện BÁN.
- LL_E: Lower Low entries.
- LH_E: Lower Low entries.
3. Stop loss and Take profit:
Stoploss, Profit = Entry Price +- ATR(20) * 5
4. Summary every year:
- 2021 to 15 Dec, 2021
- 2020 to 2021:
- 2019 to 2020:
- 2018 to 2019:
- 2017 to 2018:
- 2016 to 2017:
- 2015 to 2016:
- 2014 to 2015:
- 2013 to 2014:
5. Summary long-range:
- 2019 to 15 Dec, 2021:
- 2016 to 2019:
- 2013 to 2016:
6. List of other pairs:

Crypto Relative Performance and ProfitabilityGraph shows performance of current crypto symbol relative to average crypto market.
Green means: in profit, Red: not in profit.

[Crypto] DinhChienFX [2 orders]1. Supertrend indicator at Daily timeframe:
- Long trend: the close of candle is above the Green line of Supertrend Indicator.
- Short trend: the close of candle is below the Red line of Supertrend Indicator.
2. Keltner Channels:
- Only buy is above Upper Keltner.
- Only sell is below Lower Keltner.
3. ADX indicator:
- BUY when the ADX indicator crosses 46 + Supertrend is GREEN + Candle's close above Upper Keltner.
- SELL when the ADX indicator crosses 46 + Supertrend is RED + Candle's close below Upper Keltner.
4. Order 2: just active when the Order 1 is opening.
- At the fibonacci retracement 63% ~ Risk/reward 1/1.7
5. Not repaint:
6. Stoploss and Take Profit: risk/reward 1/1.05
- Stoploss = The height of Keltner Channels from lower to upper.
- Take profit = The height of Keltner Channels from lower to upper x 1.05
7. Alert for webhook:
* Historical data with 1 Entry.
- 2013 - 2016:
- 2016 - 2019:
- 2019 to 20/10/2021
---------
Every year:
2013-2014:
2014-2015:
2015-2016:
2016-2017:
2017-2018:
2018-2019:
2019-2020:
2020-2021:
2021-20/10/2021:

Parabolic SAR Strategy With take profit and stop lossDo not make it too difficult!
This is my first strategy! I took the Parabolic SAR Strategy and added Stop Loss and Take profit, and I can see some fantastic results in 2h-3h-4h on some of the Crypto coins.
This is for training only, and I do not recommend using it as part of a trading bot, however, I do myself.

Crypto Strategy for Bearish Markets (Binance, FTX, Futures...)BINANCE:BTCUSDTPERP
Even in months like May '21 you can win by going long on Bitcoin. This strategy proves it and is not overwhelmed by Elon's ...
The backtest was carried out during the month of May of this year and, as you can see, all the long operations opened during the fall were successful.
So if we are going to continue to have a bear market for some time, why not take advantage of it while we remain bulls?
This strategy uses Dollar-Cost-Average (DCA) to average the entry price. Thanks to this, it is able to close profitable trades even in times of great volatility and bearish pressure.
It includes alerts that can be configured that will be sent every time the conditions to operate are met. These alerts can also be linked with 3commas for a fully automatic operation.
For Leverage Futures or Margin traders, all you have to do is divide the initial capital by the leverage used.
Enjoy!

Crypto price action strategy long onlyThis is a very powerful strategy, which I adapted mostly for futures perp pairs like BTCUSDTPERP or ETHUSDTPERP.
Its made purely of price action rules like :
We check for the last down candle before a sequence of up candles, or the last up candle before a sequence of down candles.
At the same time I combine with other rules ,like for example during this sequence comparing the actual candle high and low with the min/max of the candles from the sequece before establishing if its a potential entry or not.
So far I have noticed that it works greatly with big timeframes 1h+ .
The results from above are using 1h on BTCUSDTPERP binance, together with 4 on length and 0.03% comission for futures on perp binance
If there are any questions , let me know in private !

Crypto ENGULF Candle with EMAThis is strategy based on the popular candle pattern, the ENGULFING candle together with multiple EMA for small and big length, in this case 5,20,50 and 200.
The logic for long is the next one, we have a big engulf candle, meaning the the engulf low is lower than the previous low and the high of the candle is higher than the previous candle, together with close of the engulf higher than the previous candle. At the same time I am checking that the EMA are in ascending order , like small one bigger than the middle one and the middle one above big one.
For short, we check the same patterns for engulf, but this time applied to a red candle, opposite to a green candle in long. The same we check for EMA that they are in descending order, like 5<20 and 20<50 and so on.
For exit in both situations, I use the EMA 200 cross above or below, together with a tp/sl system.
If you have any questions, please let me know on private
