ابحث في النصوص البرمجية عن "fvg"
HTF Fractal Candle OverlayHTF Fractal Candle Overlay is a technical visualization tool designed to display higher-timeframe candle structures directly on lower-timeframe charts.
In this script, fractal refers to the repetition and projection of higher-timeframe price structures across lower timeframes. By overlaying HTF candles onto the active chart, traders can observe how lower-timeframe price action evolves within larger timeframe candles, without switching timeframes or using multiple charts.
Core Functionality
• Projects selected higher-timeframe candles onto lower timeframes as a visual overlay
• Displays HTF candle bodies, wicks, opens, highs, lows, and midpoints
• Maintains accurate candle alignment using time-based calculations
• Supports session-aware and time-based candle segmentation
• Includes optional imbalance (FVG) and midpoint visualization
• Provides time-remaining tracking for active HTF candles
Fractal Concept Explained
The fractal behavior in this script is expressed through multi-timeframe structure repetition. Each higher-timeframe candle contains a sequence of lower-timeframe price movements that collectively form the same structural behavior. This overlay allows traders to study that relationship in real time and understand how HTF structure develops internally.
Use Cases
• Multi-timeframe context without timeframe switching
• Refining entries using HTF candle structure on LTF execution charts
• Studying internal candle behavior and volatility distribution
• Session-based structure analysis
• Educational visualization of HTF/LTF price relationships
Design Notes
• Built with performance-focused array management
• Automatically manages drawing lifecycle to prevent chart clutter
• Designed for clarity, not signal generation
• No repainting of completed HTF candles
This indicator is intended as a visual analysis tool, not a trading signal. It provides structural context to support discretionary decision-making based on price behavior.

Simple ICT Sweep + FVG (LuxAlgo Swings FIXED)something i created if anyone can improve it or change for better visual


FLUXO COMPRA E VENDA MGThe “FLUXO COMPRA E VENDA MG” indicator is a scoring-based system designed to evaluate buying and selling pressure by combining trend, volume, order flow, momentum, and Smart Money concepts (liquidity, sweeps, and FVG).
It does not rely on a single condition. Instead, it aggregates multiple weighted factors and only generates buy or sell signa

[Sebo] HTF FVGHigher-timeframe Fair Value Gaps only. Fixed logic, no filters, no signals. Built strictly for objective HTF market structure
This script is invite-only. If you want access, please send me a private message!!!

The Reaper WhistleThe Reaper Whistle is a high-precision RSI momentum system engineered for scalpers and intraday traders.
It combines a customizable RSI with a dynamic moving average signal line to detect micro-shifts in momentum, early reversals, and continuation setups with extreme speed.
The indicator includes five key zones used by liquidity and SMC-style traders:
• Strong Sell (90) – Extreme momentum exhaustion
• Sell (80) – Overextension area
• TP Zone (50) – Momentum balance / decision point
• Buy (20) – Discount area
• Strong Buy (10) – Extreme sell-side exhaustion
By tracking how RSI interacts with its MA inside these zones, traders can identify high-probability sniper entries on the 1m, 3m, and 5m charts.
⸻
⭐ HOW IT WORKS (Quick Breakdown)
• RSI Period: defines momentum sensitivity
• MA Period: smooths RSI noise and clarifies direction shifts
• MA Type: SMA, EMA, or WMA for different reaction speeds
• Crossovers: show momentum flips or trend continuation
• Zones: filter out weak signals and highlight only premium setups
⸻
⚡ STRATEGY EXAMPLES
1️⃣ Liquidity Sweep Reversal (Most Powerful Setup)
Use case: Gold, NAS100, NQ, US30
1. Price sweeps a previous high/low
2. RSI spikes into Strong Sell (90) or Strong Buy (10)
3. RSI crosses its MA back inside the zone
4. Enter on candle confirmation
5. TP at the next imbalance, VWAP, or volume cluster
This setup catches V-shaped reversals and trap plays.
⸻
2️⃣ Trend Continuation Pullback
Use case: Trending markets
1. Identify trend direction (EMA 200, structure, etc.)
2. Wait for RSI to pull back to the TP (50) zone
3. Watch for RSI crossing its MA in trend direction
4. Enter with trend
5. TP at previous swing high/low
This setup filters out weak pullbacks and catches clean momentum continuation.
⸻
3️⃣ Breakout Confirmation
Use case: Range breakouts, opening range breaks
1. Price breaks a consolidation high/low
2. RSI holds above Sell (80) in uptrend or below Buy (20) in downtrend
3. RSI crosses its MA with momentum
4. Enter breakout
5. TP at HTF zone or liquidity target
Perfect for fast markets like NAS100 and Bitcoin.
⸻
4️⃣ Divergence + Whistle Flip
Use case: Slow markets or pre-session moves
1. Look for bullish or bearish RSI divergence
2. Wait for RSI to cross the MA in direction of divergence
3. Enter once momentum confirms
4. TP at imbalance, FVG, or mid-range
This increases divergence accuracy dramatically.
⸻
🔥 RECOMMENDED SETTINGS
• Scalping (1m–3m):
• RSI: 5
• MA: 3
• Type: EMA
• Intraday 5m–15m:
• RSI: 7–14
• MA: 5
• Type: SMA
⸻
⭐ WHO IT’S BUILT FOR
• Liquidity + SMC traders
• Scalpers who need fast confirmation
• Traders who want clean, simple entries
• Beginners who want visual guidance
• Professionals who want momentum precision
The Reaper Whistle is intentionally designed for speed, clarity, and reliability — no clutter, no lag, just pure momentum read.
— Created by TheTrendSniper (ChartReaper)
“When the market whispers… the Reaper whistles.”

11-MA Institutional System (ATR+HTF Filters)11-MA Institutional Trading System Analysis.
This is a comprehensive Trading View Pine Script indicator that implements a sophisticated multi-timeframe moving average system with institutional-grade filters. Let me break down its key components and functionality:
🎯 Core Features
1. 11 Moving Average System. The indicator plots 11 customizable moving averages with different roles:
MA1-MA4 (5, 8, 10, 12): Fast-moving averages for short-term trends
MA5 (21 EMA): Short-term anchor - critical pivot point
MA6 (34 EMA): Intermediate support/resistance
MA7 (50 EMA): Medium-term bridge between short and long trends
MA8-MA9 (89, 100): Transition zone indicators
MA10-MA11 (150, 200): Long-term anchors for major trend identification
Each MA is fully customizable:
Type: SMA, EMA, WMA, TMA, RMA
Color, width, and enable/disable toggle
📊 Signal Generation System
Three Signal Tiers: Short-Term Signals (ST)
Trigger: MA8 (EMA 8) crossing MA21 (EMA 21)
Filters Applied:
✅ ATR-based post-cross confirmation (optional)
✅ Momentum confirmation (RSI > 50, MACD positive)
✅ Volume spike requirement
✅ HTF (Higher Timeframe) alignment
✅ Strong candle body ratio (>50%)
✅ Multi-MA confirmation (3+ MAs supporting direction)
✅ Price beyond MA21 with conviction
✅ Minimum bar spacing (prevents signal clustering)
✅ Consolidation filter
✅ Whipsaw protection (ATR-based price threshold)
Medium-Term Signals (MT)
Trigger: MA21 crossing MA50
Less strict filtering for swing trades
Major Signals
Golden Cross: MA50 crossing above MA200 (major bullish)
Death Cross: MA50 crossing below MA200 (major bearish)
🔍 Advanced Filtering System1. ATR-Based ConfirmationPrice must move > (ATR × 0.25) beyond the MA after crossover
This prevents false signals during low-volatility consolidation.2. Momentum Filters
RSI (14)
MACD Histogram
Rate of Change (ROC)
Composite momentum score (-3 to +3)
3. Volume Analysis
Volume spike detection (2x MA)
Volume classification: LOW, MED, HIGH, EXPL
Directional volume confirmation
4. Higher Timeframe Alignment
HTF1: 60-minute (default)
HTF2: 4-hour (optional)
HTF3: Daily (optional)
Signals only trigger when current TF aligns with HTF trend
5. Market Structure Detection
Break of Structure (BOS): Price breaking recent swing highs/lows
Order Blocks (OB): Institutional demand/supply zones
Fair Value Gaps (FVG): Imbalance areas for potential fills
📈 Comprehensive DashboardReal-Time Metrics Display: {scrollbar-width:none;-ms-overflow-style:none;-webkit-overflow-scrolling:touch;} ::-webkit-scrollbar{display:none}MetricDescriptionPriceCurrent close priceTimeframeCurrent chart timeframeSHORT/MEDIUM/MAJORTrend classification (🟢BULL/🔴BEAR/⚪NEUT)HTF TrendsHigher timeframe alignment indicatorsMomentumSTR↑/MOD↑/WK↑/WK↓/MOD↓/STR↓VolatilityLOW/MOD/HIGH/EXTR (based on ATR%)RSI(14)Color-coded: >70 red, <30 greenATR%Volatility as % of priceAdvanced Dashboard Features (Optional):
Price Distance from Key MAs
vs MA21, MA50, MA200 (percentage)
Color-coded: green (above), red (below)
MA Alignment Score
Calculates % of MAs in proper order
🟢 for bullish alignment, 🔴 for bearish
Trend Strength
Based on separation between MA21 and MA200
NONE/WEAK/MODERATE/STRONG/EXTREME
Consolidation Detection
Identifies low-volatility ranges
Prevents signals during sideways markets
⚙️ Customization OptionsFilter Toggles:
☑️ Require Momentum
☑️ Require Volume
☑️ Require HTF Alignment
☑️ Use ATR post-cross confirmation
☑️ Whipsaw filter
Min bars between signals (default: 5)
Dashboard Styling:
9 position options
6 text sizes
Custom colors for header, rows, and text
Toggle individual metrics on/off
🎨 Visual Elements
Signal Labels:
ST▲/ST▼ (green/red) - Short-term
MT▲/MT▼ (blue/orange) - Medium-term
GOLDEN CROSS / DEATH CROSS - Major signals
Volume Spikes:
Small labels showing volume class + direction
Example: "HIGH🟢" or "EXPL🔴"
Market Structure:
Dashed lines for Break of Structure levels
Automatic detection of swing highs/lows
🔔 Alert Conditions
Pre-configured alerts for:
Short-term bullish/bearish crosses
Medium-term bullish/bearish crosses
Golden Cross / Death Cross
Volume spikes
💡 Key Strengths
Institutional-Grade Filtering: Multiple confirmation layers reduce false signals
Multi-Timeframe Analysis: Ensures alignment across timeframes
Adaptive to Market Conditions: ATR-based thresholds adjust to volatility
Comprehensive Dashboard: All critical metrics in one view
Highly Customizable: 100+ input parameters
Signal Quality Over Quantity: Strict filters prioritize high-probability setups
⚠️ Usage Recommendations
Best for: Swing trading and position trading
Timeframes: Works on all TFs, optimized for 15m-Daily
Markets: Stocks, Forex, Crypto, Indices
Signal Frequency: Conservative (quality over quantity)
Combine with: Support/resistance, price action, risk management
🔧 Technical Implementation Notes
Uses Pine Script v6 syntax
Efficient calculation with minimal repainting
Maximum 500 labels for performance
Security function for HTF data (no lookahead bias)
Array-based MA alignment calculation
State variables to track signal spacing
This is a professional-grade trading system that combines classical technical analysis (moving averages) with modern institutional concepts (market structure, order blocks, multi-timeframe alignment).
The extensive filtering system is designed to eliminate noise and focus on high-probability trade setups.

CODEX OB + BBMA V1CODEX OB + BBMA is a multi-purpose Smart Money Concepts (SMC) indicator that automatically detects and visualizes key institutional trading elements such as Order Blocks, Fair Value Gaps, Rejection Blocks, Break of Structure, Pivots, High Volume Bars, and several qualitative SMC signals.
In addition to SMC tools, this indicator also incorporates multi-timeframe BBMA logic, allowing traders to view higher-timeframe momentum, trend direction, and volatility envelopes directly from the current chart. This makes it easier to align SMC setups—like OB, FVG, and BOS—with BBMA structure such as MA touches, re-entry zones, extreme candles, and volatility expansions.
This combination helps traders identify institutional footprints, multi-timeframe confluence, and displacement-based setups with high clarity.

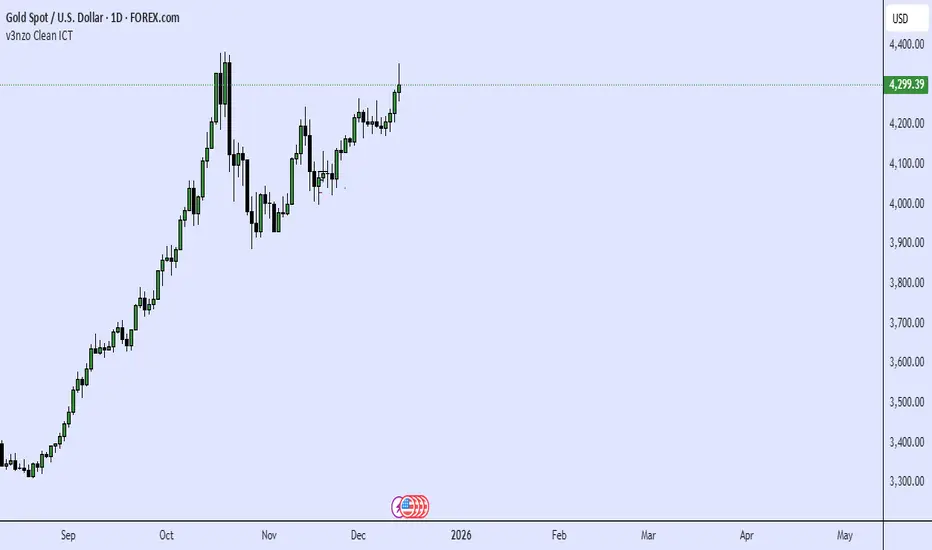
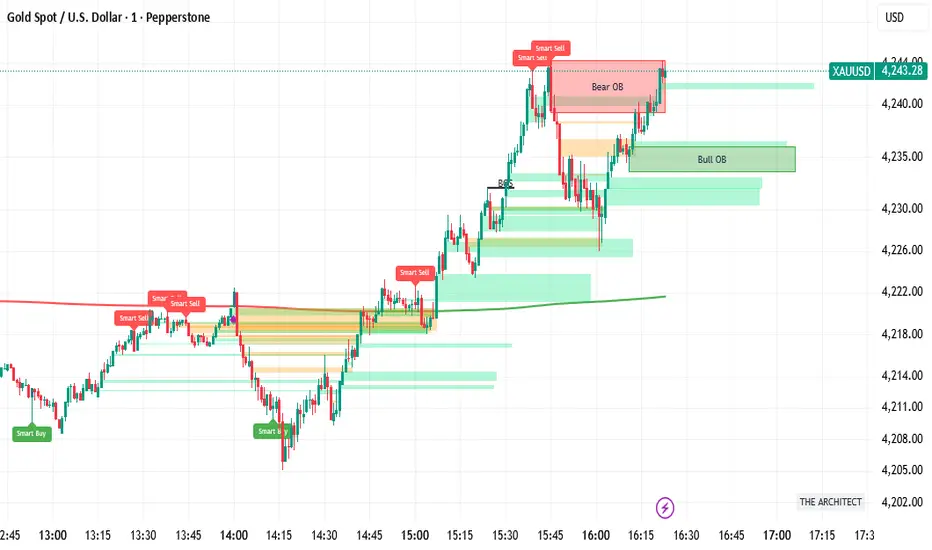
FVH THE ARCHITECT (The Consensus)HE ARCHITECT - Institutional Logic Engine
System Philosophy: THE ARCHITECT is a defensive consensus engine designed to filter market noise and align price structure with institutional momentum. It does not generate signals in isolation; it requires a "Consensus" between Price Action, Volume, and Divergence before confirming a setup.
Core Features:
Institutional Structure: Automatically identifies Order Blocks (Bull/Bear), Fair Value Gaps (FVG), and Break of Structure (BOS) based on fractal logic.
Smart Consensus Filter:
Smart VWAP: Color-coded trend filter (Green = Up, Red = Down).
Volume Spikes: Identifies institutional injection (Purple Candles) at >1.5x average volume.
Smart Reversals: RSI Divergence labels are only printed if the candle color confirms the rejection.
Focus Mode: A toggle to switch between "History Mode" (Context) and "Focus Mode" (Active Zones Only) to reduce chart clutter.
How to Use:
Buy: Wait for price to enter a Green Bull OB. Look for a "Smart Buy" label or Purple Volume Spike.
Sell: Wait for price to enter a Red Bear OB. Look for a "Smart Sell" label.
Alerts: Includes hard-coded alerts for "Smart Buy", "Smart Sell", and "Volume Spikes" for automated notifications.
SMC Pro [Stansbooth]
🔮 SMC × Fibonacci Confluence Engine — The Hidden Algorithm of the Markets
Welcome to a level of chart analysis where mathematics , market psychology , and institutional logic merge into one ultra-intelligent system.
This indicator decodes the true structure of price delivery by combining Smart Money Concepts with the timeless precision of Fibonacci ratios , revealing what retail traders can’t see — *the algorithmic heartbeat of the market*.
✨ What Makes This Indicator Different
Instead of drawing random lines or reacting to late signals, this tool **anticipates** market behavior by reading the footprints left behind by institutional algorithms. Every element is placed with purpose — every zone, every shift, every fib level — all forming a seamless narrative that explains *why* price moves the way it does.
🔥 Core Intelligence Features
Advanced BOS/CHOCH Auto-Detection — Spot structure shifts before momentum even forms.
Institutional Liquidity Mapping
— Identify liquidity pools, engineered sweeps, equal highs/lows, and trap zones designed by smart money.
Fibonacci-Aligned Precision Zones
— Auto-generated fib grids synced with SMC levels for pinpoint reversal and continuation setups.
Imbalance Engine
— FVGs, displacement, inefficiencies, and mitigation blocks displayed with crystal clarity.
Premium/Discount Algorithm
— Understand instantly whether price is in a zone of accumulation or distribution.
🚀 Designed for Traders Who Want an Edge
Whether you're scalping fast moves, capturing intraday swings, or holding higher-timeframe plays, this indicator provides a professional lens into the market. It turns complex price action into a structured, predictable system where every move has logic and every entry has confluence.
You don’t just see the chart —
you see the intention behind every push, pull, manipulation, and reversal.
💎 Why It Feels Like a Cheat Code
Because it mirrors the way institutions analyze the market:
— Identify liquidity
— Seek equilibrium
— Deliver price
— Create inefficiency
— Mitigate
— Continue the narrative
Using SMC and Fibonacci together unlocks the “algorithmic geometry” behind price movement, giving you clarity where others see chaos.
⚡ Trade With Confidence, Confluence & Control
This indicator isn’t just a tool.
It’s a complete trading framework — structured, intelligent, and deadly accurate.
Master the markets.
Decode the algorithm.
Trade like smart money .

ICT POIs By DSIndicator to identify POI's like OB/FVG and SCOB. It also have a different ATR based filters and inside bar logic for OB detection

Rolling Volume Profile [Matrix Volume Heatmap] by NXT2017Description
This indicator offers a unique visual approach to Volume Profile analysis. Instead of the traditional histogram bars or boxes, this script renders a Rolling Volume Profile as a background "Matrix Heatmap" directly on your chart.
By dividing the price action of the most recent N-candles into 30 horizontal zones (buckets), it visualizes where the most trading activity has occurred within your defined lookback period. The visualization uses dynamic transparency to highlight the Point of Control (POC) and high-volume nodes, while fading out low-volume areas.
🧠 How it Works
The script operates on a "Rolling Window" basis, meaning it recalculates the profile at every bar to reflect the immediate market context.
Dynamic Range: It calculates the highest High and lowest Low of the user-defined Lookback Length (default: 1000 bars).
Bucket Slicing: This vertical range is divided into 30 equal price buckets.
Volume Distribution (Overlap Logic): The script iterates through the historical data. If a candle is large and spans multiple buckets, its volume is distributed proportionally across those buckets. This ensures a more realistic profile compared to simply assigning volume to the close price.
Heatmap Visualization:
The script calculates the Maximum Volume (POC) within the profile.
It uses a Reference Length to normalize this maximum.
Dynamic Opacity: Zones with volume close to the maximum are rendered opaque (solid). Zones with low relative volume become highly transparent. This creates an automatic "Heatmap" effect, allowing you to instantly spot the most significant price levels.
⚙️ Settings
Lookback Length (candles): Defines how far back the profile calculates volume (e.g., 1000 bars).
POC Reference Length: Defines the smoothing window for the 100% volume baseline. Increasing this stabilizes the color changes; decreasing it makes the heatmap more reactive to sudden volume spikes.
Profil Color: Choose the base color for the matrix. The transparency is calculated automatically.
💡 Use Case
This tool is ideal for traders who want to see the "Value Area" of the current range without cluttering the chart with complex boxes or side-bars. It works excellent as a background context tool to identify:
High Volume Nodes (Support/Resistance)
Low Volume Nodes (Price gaps/Rejection areas)
Migrating Points of Control (Trend direction)

LSI Slim - EMA4/8 + Volume Filter + Sweep Targets V1📌 LSI Slim – EMA4/8 + Volume Filter + Sweep Targets
LSI Slim is a lightweight but highly effective market-structure tool that combines liquidity sweep detection, volume confirmation, higher-TF EMA signals, and dynamic target generation.
It is designed for traders who want a clean chart, fast confirmation, and objective target levels derived from real market behavior.
🔍 Key Features
1. Liquidity Sweep Detection
Automatically identifies simple bullish and bearish liquidity sweeps using recent swing extremes.
Each sweep is stored and plotted with optional fading lines to visually track market intent.
2. EMA 4/8 Confirmation (Higher Timeframe)
Built-in higher-timeframe confirmation using EMA 4 and EMA 8 crossovers.
Cross signals can optionally display labels and debug markers.
3. Adaptive Volume Filter
Two selectable volume-strength modes:
Incremental z-score increase
Negative-to-positive transition
The volume filter acts as an additional confirmation layer for sweep validations.
4. Intelligent Target Generation
Once a sweep is confirmed:
Targets (TP1–TP4) are projected using daily range or ATR fallback
Optional FVG override automatically snaps TP1 to the nearest Fair Value Gap when relevant
Targets are rendered with adjustable opacity and forward extension
5. Clean Visual Interface
Designed to stay lightweight and non-intrusive:
Adjustable max number of sweep lines
Optional fading for older levels
Minimalistic labels and shapes for clarity
🎯 Ideal For
Liquidity-based traders
Market structure practitioners
EMA-trend traders
Volume confirmation strategies
Intraday and swing trading across all markets
⚠️ Disclaimer
This script is for educational purposes only and does not constitute financial advice.
Always test on historical data and use proper risk management.

Ghost Robo [Bit2Billions]Ghost Robo — Automated Gap-Based Trading System
*An intelligent, fully automated trading strategy designed to identify high-probability opportunities using fair-value gaps, volume, and price action—without adding clutter to your chart.*
Ghost Robo combines gap detection, volume analysis, and smart entry logic into a single, streamlined system. It executes trades cleanly while offering backtesting, position sizing, alerts, and risk management—all internally. The strategy is engineered to maximize precision and reduce noise, giving traders an actionable, automated trading workflow.
Key Features
1. Automatic Gap Analysis
* Detects bullish and bearish fair-value gaps internally for trade logic.
* Evaluates gap “fill” percentages against configurable thresholds for high-probability entries.
2. Volume-Based Decision Making
* Integrates buying and selling activity to assess the strength of each gap.
* Filters trades based on real-time volume analysis for reliable execution.
3. Smart Entry Rules
* Trades are triggered automatically based on gap characteristics, candle confirmation, and user-defined thresholds.
* Queue management and deduplication avoid repeated trades on the same opportunity.
4. Flexible Filters
* Conditions include volume, bull/bear balance, gap age, and candle patterns.
* Allows traders to tune the strategy for their preferred market conditions.
5. Built-in Risk Management
* Stop-loss enforcement, optional trailing stops, and single-position restrictions.
* Ensures disciplined execution and controlled risk exposure.
6. Clean, No-Visual Execution
* All gap detection and calculations occur internally; charts remain uncluttered.
* Ideal for traders who prefer automated logic without additional chart overlays.
What Ghost Robo Solves
* Automates gap-based trading strategies with precision.
* Ensures disciplined entries using multiple filters and predictive gap logic.
* Reduces repeated trades and focuses on high-quality opportunities.
* Provides a complete system for backtesting, alerts, and position management.
Recommended Timeframes & Markets
* Timeframes: 15m and higher (15m, 1H, 4H, Daily). Works on intraday but benefits from higher timeframe structure.
* Markets: Liquid FX pairs, major crypto, indices, and liquid equities.
* Notes: For illiquid instruments, tighten volume filters or use higher timeframes for cleaner signals.
Inputs & Settings
* Default settings pre-configured
* Simple Show/Hide toggles for modules
* Minimal exposed fields for ease of use
Recommended Timeframes & Markets
* Works best on 15M, 1H, 4H, Daily, and higher
* Suitable across forex, crypto, indices, and liquid equities
* Pivot-based modules may show noise on illiquid assets
Performance & Limitations
* May draw many objects → disable unused modules for speed
* Refresh the chart if historical buffer issues occur
* TradingView platform limitations handled internally
License & Legal
* Proprietary © 2025
* Redistribution, resale, or disclosure prohibited
* Independently developed with proprietary extensions
* Any resemblance to other tools may result from public-domain concepts
Respect & Transparency
* Built on widely recognized public trading concepts.
* Developed with respect for the TradingView community.
* Any overlaps or similarities can be addressed constructively.
Disclaimer
* Educational purposes only
* Not financial advice
* Trading carries risk — always use paper testing and proper risk management
FAQs
* Source code is not public
* Works best on 15m, 1H, 4H, Daily, Weekly charts
* Modules can be hidden/shown with toggles
* Alerts can be set up manually by users
* Supports multiple markets: forex, crypto, indices, and equities
About Ghost Trading Suite
Author: BIT2BILLIONS
Project: Ghost Trading Suite © 2025
Indicators: Ghost Matrix, Ghost Protocol, Ghost Cipher, Ghost Shadow
Strategies: Ghost Robo, Ghost Robo Plus
Pine Version: V6
The Ghost Trading Suite is designed to simplify and automate many aspects of chart analysis. It helps traders identify market structure, divergences, support and resistance levels, and momentum efficiently, reducing manual charting time.
The suite includes several integrated tools — such as Ghost Matrix, Ghost Protocol, Ghost Cipher, Ghost Shadow, Ghost Robo, and Ghost Robo Plus — each combining analytical modules for enhanced clarity in trend direction, volatility, pivot detection, and momentum tracking.
Together, these tools form a cohesive framework that assists in visualizing market behavior, measuring momentum, detecting pivots, and analyzing price structure effectively.
This project focuses on providing adaptable and professional-grade tools that turn complex market data into clear, actionable insights for technical analysis.
Crafted with 💖 by BIT2BILLIONS for Traders. That's All Folks!
Changelog
v1.0 – Core Release
* Introduced fully automated gap-based strategy using fair-value gaps (FVGs) for trade logic.
* Added internal volume analysis to evaluate bullish/bearish strength for each gap.
* Implemented smart entry triggers based on gap “fill” percentages.
* Added configurable filters for volume, bull/bear balance, age of gap, candle confirmation, and cooldown between trades.
* Introduced queue management & deduplication, ensuring only the most relevant gaps are traded and repeated entries are avoided.
* Implemented risk management features, including percentage stop-loss, optional trailing stops, and single-position enforcement.
* Fully non-visual execution, keeping charts clean while all gap detection and trade calculations happen internally.
* Enabled backtesting, position sizing, and alert creation for complete strategy management.

Displacement + FVG + Structure Break (ICT-style)Identifies the displacement candle. Can be used in conjunction with 1 min chart to identify true displacement
