Multi-Timeframe Fair Value Gap by Vigna📊 Multi-Timeframe Fair Value Gap (FVG) Indicator
This indicator displays Fair Value Gaps (FVGs) from multiple timeframes simultaneously on your chart. FVGs are price gaps that occur when the market moves quickly and skips certain price levels. These gaps tend to be "filled" later and often serve as important support and resistance zones.
🎯 What are Fair Value Gaps?
A Fair Value Gap occurs when:
Bullish FVG: The current low is higher than the high from 2 candles ago (gap upward)
Bearish FVG: The current high is lower than the low from 2 candles ago (gap downward)
⏱️ Supported Timeframes:
1 Hour (1H)
2 Hours (2H)
3 Hours (3H)
4 Hours (4H)
1 Day (1D)
1 Week (1W)
🎨 Features:
✅ All timeframes visible simultaneously
✅ Each timeframe has its own color (bullish & bearish)
✅ Labels show the timeframe of each gap
✅ Automatic deletion when gap is filled
✅ Optional: MidPoint Fill (gap marked as filled at 50%)
✅ Extend right: Gaps extend to the right until filled
✅ All colors fully customizable
⚙️ Settings:
Timeframes: Enable/disable individual timeframes as needed
MidPoint Fill: Mark gap as filled when 50% is reached
Delete On Fill: Automatically remove filled gaps from chart
Label Timeframes: Show labels with timeframe names
Colors: Customize all colors to your preferences
💡 Application:
FVGs often serve as magnetic attraction points for price
Higher timeframe FVGs (4H, 1D, 1W) are typically more significant
Use FVGs as potential entry/exit zones
Combine with other indicators for better confirmation
📈 Recommended Use:
Works best on timeframes from 15min to 1H
Ideal for Forex, Crypto, and Stocks
Especially useful for Swing Trading and Day Trading
🔧 Technical Details:
Uses optimized request.security() calls (12 total, under the 40 limit)
Employs tuple syntax for efficient data fetching
Real-time gap detection and filling mechanism
Memory-efficient array management with var keyword
ابحث في النصوص البرمجية عن "gaps"

Manifold Singularity EngineManifold Singularity Engine: Catastrophe Theory Detection Through Multi-Dimensional Topology Analysis
The Manifold Singularity Engine applies catastrophe theory from mathematical topology to multi-dimensional price space analysis, identifying potential reversal conditions by measuring manifold curvature, topological complexity, and fractal regime states. Unlike traditional reversal indicators that rely on price pattern recognition or momentum oscillators, this system reconstructs the underlying geometric surface (manifold) that price evolves upon and detects points where this topology undergoes catastrophic folding—mathematical singularities that correspond to forced directional changes in price dynamics.
The indicator combines three analytical frameworks: phase space reconstruction that embeds price data into a multi-dimensional coordinate system, catastrophe detection that measures when this embedded manifold reaches critical curvature thresholds indicating topology breaks, and Hurst exponent calculation that classifies the current fractal regime to adaptively weight detection sensitivity. This creates a geometry-based reversal detection system with visual feedback showing topology state, manifold distortion fields, and directional probability projections.
What Makes This Approach Different
Phase Space Embedding Construction
The core analytical method reconstructs price evolution as movement through a three-dimensional coordinate system rather than analyzing price as a one-dimensional time series. The system calculates normalized embedding coordinates: X = normalize(price_velocity, window) , Y = normalize(momentum_acceleration, window) , and Z = normalize(volume_weighted_returns, window) . These coordinates create a trajectory through phase space where price movement traces a path across a geometric surface—the market manifold.
This embedding approach differs fundamentally from traditional technical analysis by treating price not as a sequential data stream but as a dynamical system evolving on a curved surface in multi-dimensional space. The trajectory's geometric properties (curvature, complexity, folding) contain information about impending directional changes that single-dimension analysis cannot capture. When this manifold undergoes rapid topological deformation, price must respond with directional change—this is the mathematical basis for catastrophe detection.
Statistical normalization using z-score transformation (subtracting mean, dividing by standard deviation over a rolling window) ensures the coordinate system remains scale-invariant across different instruments and volatility regimes, allowing identical detection logic to function on forex, crypto, stocks, or indices without recalibration.
Catastrophe Score Calculation
The catastrophe detection formula implements a composite anomaly measurement combining multiple topology metrics: Catastrophe_Score = 0.45×Curvature_Percentile + 0.25×Complexity_Ratio + 0.20×Condition_Percentile + 0.10×Gradient_Percentile . Each component measures a distinct aspect of manifold distortion:
Curvature (κ) is computed using the discrete Laplacian operator: κ = √ , which measures how sharply the manifold surface bends at the current point. High curvature values indicate the surface is folding or developing a sharp corner—geometric precursors to catastrophic topology breaks. The Laplacian measures second derivatives (rate of change of rate of change), capturing acceleration in the trajectory's path through phase space.
Topological Complexity counts sign changes in the curvature field over the embedding window, measuring how chaotically the manifold twists and oscillates. A smooth, stable surface produces low complexity; a highly contorted, unstable surface produces high complexity. This metric detects when the geometric structure becomes informationally dense with multiple local extrema, suggesting an imminent topology simplification event (catastrophe).
Condition Number measures the Jacobian matrix's sensitivity: Condition = |Trace| / |Determinant|, where the Jacobian describes how small changes in price produce changes in the embedding coordinates. High condition numbers indicate numerical instability—points where the coordinate transformation becomes ill-conditioned, suggesting the manifold mapping is approaching a singularity.
Each metric is converted to percentile rank within a rolling window, then combined using weighted sum. The percentile transformation creates adaptive thresholds that automatically adjust to each instrument's characteristic topology without manual recalibration. The resulting 0-100% catastrophe score represents the current bar's position in the distribution of historical manifold distortion—values above the threshold (default 65%) indicate statistically extreme topology states where reversals become geometrically probable.
This multi-metric ensemble approach prevents false signals from isolated anomalies: all four geometric features must simultaneously indicate distortion for a high catastrophe score, ensuring only true manifold breaks trigger detection.
Hurst Exponent Regime Classification
The Hurst exponent calculation implements rescaled range (R/S) analysis to measure the fractal dimension of price returns: H = log(R/S) / log(n) , where R is the range of cumulative deviations from mean and S is the standard deviation. The resulting value classifies market behavior into three fractal regimes:
Trending Regime (H > 0.55) : Persistent price movement where future changes are positively correlated with past changes. The manifold exhibits directional momentum with smooth topology evolution. In this regime, catastrophe signals receive 1.2× confidence multiplier because manifold breaks in trending conditions produce high-magnitude directional changes.
Mean-Reverting Regime (H < 0.45) : Anti-persistent price movement where future changes tend to oppose past changes. The manifold exhibits oscillatory topology with frequent small-scale distortions. Catastrophe signals receive 0.8× confidence multiplier because reversal significance is diminished in choppy conditions where the manifold constantly folds at minor scales.
Random Walk Regime (H ≈ 0.50) : No statistical correlation in returns. The manifold evolution is geometrically neutral with moderate topology stability. Standard 1.0× confidence multiplier applies.
This adaptive weighting system solves a critical problem in reversal detection: the same geometric catastrophe has different trading implications depending on the fractal regime. A manifold fold in a strong trend suggests a significant reversal opportunity; the same fold in mean-reversion suggests a minor oscillation. The Hurst-based regime filter ensures detection sensitivity automatically adjusts to market character without requiring trader intervention.
The implementation uses logarithmic price returns rather than raw prices to ensure
stationarity, and applies the calculation over a configurable window (default 5 bars) to balance responsiveness with statistical validity. The Hurst value is then smoothed using exponential moving average to reduce noise while maintaining regime transition detection.
Multi-Layer Confirmation Architecture
The system implements five independent confirmation filters that must simultaneously validate
before any singularity signal generates:
1. Catastrophe Threshold : The composite anomaly score must exceed the configured threshold (default 0.65 on 0-1 scale), ensuring the manifold distortion is statistically extreme relative to recent history.
2. Pivot Structure Confirmation : Traditional swing high/low patterns (using ta.pivothigh and ta.pivotlow with configurable lookback) must form at the catastrophe bar. This ensures the geometric singularity coincides with observable price structure rather than occurring mid-swing where interpretation is ambiguous.
3. Swing Size Validation : The pivot magnitude must exceed a minimum threshold measured in ATR units (default 1.5× Average True Range). This filter prevents signals on insignificant price jiggles that lack meaningful reversal potential, ensuring only substantial swings with adequate risk/reward ratios generate signals.
4. Volume Confirmation : Current volume must exceed 1.3× the 20-period moving average, confirming genuine market participation rather than low-liquidity price noise. Manifold catastrophes without volume support often represent false topology breaks that don't translate to sustained directional change.
5. Regime Validity : The market must be classified as either trending (ADX > configured threshold, default 30) or volatile (ATR expansion > configured threshold, default 40% above 30-bar average), and must NOT be in choppy/ranging state. This critical filter prevents trading during geometrically unfavorable conditions where edge deteriorates.
All five conditions must evaluate true simultaneously for a signal to generate. This conjunction-based logic (AND not OR) dramatically reduces false positives while preserving true reversal detection. The architecture recognizes that geometric catastrophes occur frequently in noisy data, but only those catastrophes that align with confirming evidence across price structure, participation, and regime characteristics represent tradable opportunities.
A cooldown mechanism (default 8 bars between signals) prevents signal clustering at extended pivot zones where the manifold may undergo multiple small catastrophes during a single reversal process.
Direction Classification System
Unlike binary bull/bear systems, the indicator implements a voting mechanism combining four
directional indicators to classify each catastrophe:
Pivot Vote : +1 if pivot low, -1 if pivot high, 0 otherwise
Trend Vote : Based on slow frequency (55-period EMA) slope—+1 if rising, -1 if falling, 0 if flat
Flow Vote : Based on Y-gradient (momentum acceleration)—+1 if positive, -1 if negative, 0 if neutral
Mid-Band Vote : Based on price position relative to medium frequency (21-period EMA)—+1 if above, -1 if below, 0 if at
The total vote sum classifies the singularity: ≥2 votes = Bullish , ≤-2 votes = Bearish , -1 to +1 votes = Neutral (skip) . This majority-consensus approach ensures directional classification requires alignment across multiple timeframes and analysis dimensions rather than relying on a single indicator. Neutral signals (mixed voting) are displayed but should not be traded, as they represent geometric catastrophes without clear directional resolution.
Core Calculation Methodology
Embedding Coordinate Generation
Three normalized phase space coordinates are constructed from price data:
X-Dimension (Velocity Space):
price_velocity = close - close
X = (price_velocity - mean) / stdev over hurstWindow
Y-Dimension (Acceleration Space):
momentum = close - close
momentum_accel = momentum - momentum
Y = (momentum_accel - mean) / stdev over hurstWindow
Z-Dimension (Volume-Weighted Space):
vol_normalized = (volume - mean) / stdev over embedLength
roc = (close - close ) / close
Z = (roc × vol_normalized - mean) / stdev over hurstWindow
These coordinates define a point in 3D phase space for each bar. The trajectory connecting these points is the reconstructed manifold.
Gradient Field Calculation
First derivatives measure local manifold slope:
dX/dt = X - X
dY/dt = Y - Y
Gradient_Magnitude = √
The gradient direction indicates where the manifold is "pushing" price. Positive Y-gradient suggests upward topological pressure; negative Y-gradient suggests downward pressure.
Curvature Tensor Components
Second derivatives measure manifold bending using discrete Laplacian:
Laplacian_X = X - 2×X + X
Laplacian_Y = Y - 2×Y + Y
Laplacian_Magnitude = √
This is then normalized:
Curvature_Normalized = (Laplacian_Magnitude - mean) / stdev over embedLength
High normalized curvature (>1.5) indicates sharp manifold folding.
Complexity Accumulation
Sign changes in curvature field are counted:
Sign_Flip = 1 if sign(Curvature ) ≠ sign(Curvature ), else 0
Topological_Complexity = sum(Sign_Flip) over embedLength window
This measures oscillation frequency in the geometry. Complexity >5 indicates chaotic topology.
Condition Number Stability Analysis
Jacobian matrix sensitivity is approximated:
dX/dp = dX/dt / (price_change + epsilon)
dY/dp = dY/dt / (price_change + epsilon)
Jacobian_Determinant = (dX/dt × dY/dp) - (dX/dp × dY/dt)
Jacobian_Trace = dX/dt + dY/dp
Condition_Number = |Trace| / (|Determinant| + epsilon)
High condition numbers indicate numerical instability near singularities.
Catastrophe Score Assembly
Each metric is converted to percentile rank over embedLength window, then combined:
Curvature_Percentile = percentrank(abs(Curvature_Normalized), embedLength)
Gradient_Percentile = percentrank(Gradient_Magnitude, embedLength)
Condition_Percentile = percentrank(abs(Condition_Z_Score), embedLength)
Complexity_Ratio = clamp(Topological_Complexity / embedLength, 0, 1)
Final score:
Raw_Anomaly = 0.45×Curvature_P + 0.25×Complexity_R + 0.20×Condition_P + 0.10×Gradient_P
Catastrophe_Score = Raw_Anomaly × Hurst_Multiplier
Values are clamped to range.
Hurst Exponent Calculation
Rescaled range analysis on log returns:
Calculate log returns: r = log(close) - log(close )
Compute cumulative deviations from mean
Find range: R = max(cumulative_dev) - min(cumulative_dev)
Calculate standard deviation: S = stdev(r, hurstWindow)
Compute R/S ratio
Hurst = log(R/S) / log(hurstWindow)
Clamp to and smooth with 5-period EMA
Regime Classification Logic
Volatility Regime:
ATR_MA = SMA(ATR(14), 30)
Vol_Expansion = ATR / ATR_MA
Is_Volatile = Vol_Expansion > (1.0 + minVolExpansion)
Trend Regime (Corrected ADX):
Calculate directional movement (DM+, DM-)
Smooth with Wilder's RMA(14)
Compute DI+ and DI- as percentages
Calculate DX = |DI+ - DI-| / (DI+ + DI-) × 100
ADX = RMA(DX, 14)
Is_Trending = ADX > (trendStrength × 100)
Chop Detection:
Is_Chopping = NOT Is_Trending AND NOT Is_Volatile
Regime Validity:
Regime_Valid = (Is_Trending OR Is_Volatile) AND NOT Is_Chopping
Signal Generation Logic
For each bar:
Check if catastrophe score > topologyStrength threshold
Verify regime is valid
Confirm Hurst alignment (trending or mean-reverting with pivot)
Validate pivot quality (price extended outside spectral bands then re-entered)
Confirm volume/volatility participation
Check cooldown period has elapsed
If all true: compute directional vote
If vote ≥2: Bullish Singularity
If vote ≤-2: Bearish Singularity
If -1 to +1: Neutral (display but skip)
All conditions must be true for signal generation.
Visual System Architecture
Spectral Decomposition Layers
Three harmonic frequency bands visualize entropy state:
Layer 1 (Surface Frequency):
Center: EMA(8)
Width: ±0.3 × 0.5 × ATR
Transparency: 75% (most visible)
Represents fast oscillations
Layer 2 (Mid Frequency):
Center: EMA(21)
Width: ±0.5 × 0.5 × ATR
Transparency: 85%
Represents medium cycles
Layer 3 (Deep Frequency):
Center: EMA(55)
Width: ±0.7 × 0.5 × ATR
Transparency: 92% (most transparent)
Represents slow baseline
Convergence of layers indicates low entropy (stable topology). Divergence indicates high entropy (catastrophe building). This decomposition reveals how different frequency components of price movement interact—when all three align, the manifold is in equilibrium; when they separate, topology is unstable.
Energy Radiance Fields
Concentric boxes emanate from each singularity bar:
For each singularity, 5 layers are generated:
Layer n: bar_index ± (n × 1.5 bars), close ± (n × 0.4 × ATR)
Transparency gradient: inner 75% → outer 95%
Color matches signal direction
These fields visualize the "energy well" of the catastrophe—wider fields indicate stronger topology distortion. The exponential expansion creates a natural radiance effect.
Singularity Node Geometry
N-sided polygon (default hexagon) at each signal bar:
Vertices calculated using polar coordinates
Rotation angle: bar_index × 0.1 (creates animation)
Radius: ATR × singularity_strength × 2
Connects vertices with colored lines
The rotating geometric primitive marks the exact catastrophe bar with visual prominence.
Gradient Flow Field
Directional arrows display manifold slope:
Spawns every 3 bars when gradient_magnitude > 0.1
Symbol: "↗" if dY/dt > 0.1, "↘" if dY/dt < -0.1, "→" if neutral
Color: Bull/bear/neutral based on direction
Density limited to flowDensity parameter
Arrows cluster when gradient is strong, creating intuitive topology visualization.
Probability Projection Cones
Forward trajectory from each singularity:
Projects 10 bars forward
Direction based on vote classification
Center line: close + (direction × ATR × 3)
Uncertainty width: ATR × singularity_strength × 2
Dashed boundaries, solid center
These are mathematical projections based on current gradient, not price targets. They visualize expected manifold evolution if topology continues current trajectory.
Dashboard Metrics Explanation
The real-time control panel displays six core metrics plus regime status:
H (Hurst Exponent):
Value: Current Hurst (0-1 scale)
Label: TREND (>0.55), REVERT (<0.45), or RANDOM (0.45-0.55)
Icon: Direction arrow based on regime
Purpose: Shows fractal character—only trade when favorable
Σ (Catastrophe Score):
Value: Current composite anomaly (0-100%)
Bar gauge shows relative strength
Icon: ◆ if above threshold, ○ if below
Purpose: Primary signal strength indicator
κ (Curvature):
Value: Normalized Laplacian magnitude
Direction arrow shows sign
Color codes severity (green<0.8, yellow<1.5, red≥1.5)
Purpose: Shows manifold bending intensity
⟳ (Topology Complexity):
Value: Count of sign flips in curvature
Icon: ◆ if >3, ○ otherwise
Color codes chaos level
Purpose: Indicates geometric instability
V (Volatility Expansion):
Value: ATR expansion percentage above 30-bar average
Icon: ● if volatile, ○ otherwise
Purpose: Confirms energy present for reversal
T (Trend Strength):
Value: ADX reading (0-100)
Icon: ● if trending, ○ otherwise
Purpose: Shows directional bias strength
R (Regime):
Label: EXPLOSIVE / TREND / VOLATILE / CHOP / NEUTRAL
Icon: ✓ if valid, ✗ if invalid
Purpose: Go/no-go filter for trading
STATE (Bottom Display):
Shows: "◆ BULL SINGULARITY" (green), "◆ BEAR SINGULARITY" (red), "◆ WEAK/NEUTRAL" (orange), or "— Monitoring —" (gray)
Purpose: Current signal status at a glance
How to Use This Indicator
Initial Setup and Configuration
Apply the indicator to your chart with default settings as a starting point. The default parameters (21-bar embedding, 5-bar Hurst window, 2.5σ singularity threshold, 0.65 topology confirmation) are optimized for balanced detection across most instruments and timeframes. For very fast markets (scalping crypto, 1-5min charts), consider reducing embedding depth to 13-15 bars and Hurst window to 3 bars for more responsive detection. For slower markets (swing trading stocks, 4H-Daily charts), increase embedding depth to 34-55 bars and Hurst window to 8-10 bars for more stable topology measurement.
Enable the dashboard (top right recommended) to monitor real-time metrics. The control panel is your primary decision interface—glancing at the dashboard should instantly communicate whether conditions favor trading and what the current topology state is. Position and size the dashboard to remain visible but not obscure price action.
Enable regime filtering (strongly recommended) to prevent trading during choppy/ranging conditions where geometric edge deteriorates. This single setting can dramatically improve overall performance by eliminating low-probability environments.
Reading Dashboard Metrics for Trade Readiness
Before considering any trade, verify the dashboard shows favorable conditions:
Hurst (H) Check:
The Hurst Exponent reading is your first filter. Only consider trades when H > 0.50 . Ideal conditions show H > 0.60 with "TREND" label—this indicates persistent directional price movement where manifold catastrophes produce significant reversals. When H < 0.45 (REVERT label), the market is mean-reverting and catastrophes represent minor oscillations rather than substantial pivots. Do not trade in mean-reverting regimes unless you're explicitly using range-bound strategies (which this indicator is not optimized for). When H ≈ 0.50 (RANDOM label), edge is neutral—acceptable but not ideal.
Catastrophe (Σ) Monitoring:
Watch the Σ percentage build over time. Readings consistently below 50% indicate stable topology with no imminent reversals. When Σ rises above 60-65%, manifold distortion is approaching critical levels. Signals only fire when Σ exceeds the configured threshold (default 65%), so this metric pre-warns you of potential upcoming catastrophes. High-conviction setups show Σ > 75%.
Regime (R) Validation:
The regime classification must read TREND, VOLATILE, or EXPLOSIVE—never trade when it reads CHOP or NEUTRAL. The checkmark (✓) must be present in the regime cell for trading conditions to be valid. If you see an X (✗), skip all signals until regime improves. This filter alone eliminates most losing trades by avoiding geometrically unfavorable environments.
Combined High-Conviction Profile:
The strongest trading opportunities show simultaneously:
H > 0.60 (strong trending regime)
Σ > 75% (extreme topology distortion)
R = EXPLOSIVE or TREND with ✓
κ (Curvature) > 1.5 (sharp manifold fold)
⟳ (Complexity) > 4 (chaotic geometry)
V (Volatility) showing elevated ATR expansion
When all metrics align in this configuration, the manifold is undergoing severe distortion in a favorable fractal regime—these represent maximum-conviction reversal opportunities.
Signal Interpretation and Entry Logic
Bullish Singularity (▲ Green Triangle Below Bar):
This marker appears when the system detects a manifold catastrophe at a price low with bullish directional consensus. All five confirmation filters have aligned: topology score exceeded threshold, pivot low structure formed, swing size was significant, volume/volatility confirmed participation, and regime was valid. The green color indicates the directional vote totaled +2 or higher (majority bullish).
Trading Approach: Consider long entry on the bar immediately following the signal (bar after the triangle). The singularity bar itself is where the geometric catastrophe occurred—entering after allows you to see if price confirms the reversal. Place stop loss below the singularity bar's low (with buffer of 0.5-1.0 ATR for volatility). Initial target can be the previous swing high, or use the probability cone projection as a guide (though not a guarantee). Monitor the dashboard STATE—if it flips to "◆ BEAR SINGULARITY" or Hurst drops significantly, consider exiting even if target not reached.
Bearish Singularity (▼ Red Triangle Above Bar):
This marker appears when the system detects a manifold catastrophe at a price high with bearish directional consensus. Same five-filter confirmation process as bullish signals. The red color indicates directional vote totaled -2 or lower (majority bearish).
Trading Approach: Consider short entry on the bar following the signal. Place stop loss above the singularity bar's high (with buffer). Target previous swing low or use cone projection as reference. Exit if opposite signal fires or Hurst deteriorates.
Neutral Signal (● Orange Circle at Price Level):
This marker indicates the catastrophe detection system identified a topology break that passed catastrophe threshold and regime filters, but the directional voting system produced a mixed result (vote between -1 and +1). This means the four directional components (pivot, trend, flow, mid-band) are not in agreement about which way the reversal should resolve.
Trading Approach: Skip these signals. Neutral markers are displayed for analytical completeness but should not be traded. They represent geometric catastrophes without clear directional resolution—essentially, the manifold is breaking but the direction of the break is ambiguous. Trading neutral signals dramatically increases false signal rate. Only trade green (bullish) or red (bearish) singularities.
Visual Confirmation Using Spectral Layers
The three colored ribbons (spectral decomposition layers) provide entropy visualization that helps confirm signal quality:
Divergent Layers (High Entropy State):
When the three frequency bands (fast 8-period, medium 21-period, slow 55-period) are separated with significant gaps between them, the manifold is in high entropy state—different frequency components of price movement are pulling in different directions. This geometric tension precedes catastrophes. Strong signals often occur when layers are divergent before the signal, then begin reconverging immediately after.
Convergent Layers (Low Entropy State):
When all three ribbons are tightly clustered or overlapping, the manifold is in equilibrium—all frequency components agree. This stable geometry makes catastrophe detection more reliable because topology breaks clearly stand out against the baseline stability. If you see layers converge, then a singularity fires, then layers diverge, this pattern suggests a genuine regime transition.
Signal Quality Assessment:
High-quality singularity signals should show:
Divergent layers (high entropy) in the 5-10 bars before signal
Singularity bar occurs when price has extended outside at least one of the spectral bands (shows pivot extended beyond equilibrium)
Close of singularity bar re-enters the spectral band zone (shows mean reversion starting)
Layers begin reconverging in 3-5 bars after signal (shows new equilibrium forming)
This pattern visually confirms the geometric narrative: manifold became unstable (divergence), reached critical distortion (extended outside equilibrium), broke catastrophically (singularity), and is now stabilizing in new direction (reconvergence).
Using Energy Fields for Trade Management
The concentric glowing boxes around each singularity visualize the topology distortion
magnitude:
Wide Energy Fields (5+ Layers Visible):
Large radiance indicates strong catastrophe with high manifold curvature. These represent significant topology breaks and typically precede larger price moves. Wide fields justify wider profit targets and longer hold times. The outer edge of the largest box can serve as a dynamic support/resistance zone—price often respects these geometric boundaries.
Narrow Energy Fields (2-3 Layers):
Smaller radiance indicates moderate catastrophe. While still valid signals (all filters passed), expect smaller follow-through. Use tighter profit targets and be prepared for quicker exit if momentum doesn't develop. These are valid but lower-conviction trades.
Field Interaction Zones:
When energy fields from consecutive signals overlap or touch, this indicates a prolonged topology distortion region—often corresponds to consolidation zones or complex reversal patterns (head-and-shoulders, double tops/bottoms). Be more cautious in these areas as the manifold is undergoing extended restructuring rather than a clean catastrophe.
Probability Cone Projections
The dashed cone extending forward from each singularity is a mathematical projection, not a
price target:
Cone Direction:
The center line direction (upward for bullish, downward for bearish, flat for neutral) shows the expected trajectory based on current manifold gradient and singularity direction. This is where the topology suggests price "should" go if the catastrophe completes normally.
Cone Width:
The uncertainty band (upper and lower dashed boundaries) represents the range of outcomes given current volatility (ATR-based). Wider cones indicate higher uncertainty—expect more price volatility even if direction is correct. Narrower cones suggest more constrained movement.
Price-Cone Interaction:
Price following near the center line = catastrophe resolving as expected, geometric projection accurate
Price breaking above upper cone = stronger-than-expected reversal, consider holding for larger targets
Price breaking below lower cone (for bullish signal) = catastrophe failing, manifold may be re-folding in opposite direction, consider exit
Price oscillating within cone = normal reversal process, hold position
The 10-bar projection length means cones show expected behavior over the next ~10 bars. Don't confuse this with longer-term price targets.
Gradient Flow Field Interpretation
The directional arrows (↗, ↘, →) scattered across the chart show the manifold's Y-gradient (vertical acceleration dimension):
Upward Arrows (↗):
Positive Y-gradient indicates the momentum acceleration dimension is pushing upward—the manifold topology has upward "slope" at this location. Clusters of upward arrows suggest bullish topological pressure building. These often appear before bullish singularities fire.
Downward Arrows (↘):
Negative Y-gradient indicates downward topological pressure. Clusters precede bearish singularities.
Horizontal Arrows (→):
Neutral gradient indicates balanced topology with no strong directional pressure.
Using Flow Field:
The arrows provide real-time topology state information even between singularity signals. If you're in a long position from a bullish singularity and begin seeing increasing downward arrows appearing, this suggests manifold gradient is shifting—consider tightening stops. Conversely, if arrows remain upward or neutral, topology supports continuation.
Don't confuse arrow direction with immediate price direction—arrows show geometric slope, not price prediction. They're confirmatory context, not entry signals themselves.
Parameter Optimization for Your Trading Style
For Scalping / Fast Trading (1m-15m charts):
Embedding Depth: 13-15 bars (faster topology reconstruction)
Hurst Window: 3 bars (responsive fractal detection)
Singularity Threshold: 2.0-2.3σ (more sensitive)
Topology Confirmation: 0.55-0.60 (lower barrier)
Min Swing Size: 0.8-1.2 ATR (accepts smaller moves)
Pivot Lookback: 3-4 bars (quick pivot detection)
This configuration increases signal frequency for active trading but requires diligent monitoring as false signal rate increases. Use tighter stops.
For Day Trading / Standard Approach (15m-4H charts):
Keep default settings (21 embed, 5 Hurst, 2.5σ, 0.65 confirmation, 1.5 ATR, 5 pivot)
These are balanced for quality over quantity
Best win rate and risk/reward ratio
Recommended for most traders
For Swing Trading / Position Trading (4H-Daily charts):
Embedding Depth: 34-55 bars (stable long-term topology)
Hurst Window: 8-10 bars (smooth fractal measurement)
Singularity Threshold: 3.0-3.5σ (only extreme catastrophes)
Topology Confirmation: 0.75-0.85 (high conviction only)
Min Swing Size: 2.5-4.0 ATR (major moves only)
Pivot Lookback: 8-13 bars (confirmed swings)
This configuration produces infrequent but highly reliable signals suitable for position sizing and longer hold times.
Volatility Adaptation:
In extremely volatile instruments (crypto, penny stocks), increase Min Volatility Expansion to 0.6-0.8 to avoid over-signaling during "always volatile" conditions. In stable instruments (major forex pairs, blue-chip stocks), decrease to 0.3 to allow signals during moderate volatility spikes.
Trend vs Range Preference:
If you prefer trading only strong trends, increase Min Trend Strength to 0.5-0.6 (ADX > 50-60). If you're comfortable with volatility-based trading in weaker trends, decrease to 0.2 (ADX > 20). The default 0.3 balances both approaches.
Complete Trading Workflow Example
Step 1 - Pre-Session Setup:
Load chart with MSE indicator. Check dashboard position is visible. Verify regime filter is enabled. Review recent signals to gauge current instrument behavior.
Step 2 - Market Assessment:
Observe dashboard Hurst reading. If H < 0.45 (mean-reverting), consider skipping this session or using other strategies. If H > 0.50, proceed. Check regime shows TREND, VOLATILE, or EXPLOSIVE with checkmark—if CHOP, wait for regime shift alert.
Step 3 - Signal Wait:
Monitor catastrophe score (Σ). Watch for it climbing above 60%. Observe spectral layers—look for divergence building. If you see curvature (κ) rising above 1.0 and complexity (⟳) increasing, catastrophe is building. Do not anticipate—wait for the actual signal marker.
Step 4 - Signal Recognition:
▲ Bullish or ▼ Bearish triangle appears at a bar. Dashboard STATE changes to "◆ BULL/BEAR SINGULARITY". Energy field appears around the signal bar. Check signal quality:
Was Σ > 70% at signal? (Higher quality)
Are energy fields wide? (Stronger catastrophe)
Did layers diverge before and reconverge after? (Clean break)
Is Hurst still > 0.55? (Good regime)
Step 5 - Entry Decision:
If signal is green/red (not orange neutral), all confirmations look strong, and no immediate contradicting factors appear, prepare entry on next bar open. Wait for confirmation bar to form—ideally it should close in the signal direction (bullish signal → bar closes higher, bearish signal → bar closes lower).
Step 6 - Position Entry:
Enter at open or shortly after open of bar following signal bar. Set stop loss: for bullish signals, place stop at singularity_bar_low - (0.75 × ATR); for bearish signals, place stop at singularity_bar_high + (0.75 × ATR). The buffer accommodates volatility while protecting against catastrophe failure.
Step 7 - Trade Management:
Monitor dashboard continuously:
If Hurst drops below 0.45, consider reducing position
If opposite singularity fires, exit immediately (manifold has re-folded)
If catastrophe score drops below 40% and stays there, topology has stabilized—consider partial profit taking
Watch gradient flow arrows—if they shift to opposite direction persistently, tighten stops
Step 8 - Profit Taking:
Use probability cone as a guide—if price reaches outer cone boundary, consider taking partial profits. If price follows center line cleanly, hold for larger target. Traditional technical targets work well: previous swing high/low, round numbers, Fibonacci extensions. Don't expect precision—manifold projections give direction and magnitude estimates, not exact prices.
Step 9 - Exit:
Exit on: (a) opposite signal appears, (b) dashboard shows regime became invalid (checkmark changes to X), (c) technical target reached, (d) Hurst deteriorates significantly, (e) stop loss hit, or (f) time-based exit if using session limits. Never hold through opposite singularity signals—the manifold has broken in the other direction and your trade thesis is invalidated.
Step 10 - Post-Trade Review:
After exit, review: Did the probability cone projection align with actual price movement? Were the energy fields proportional to move size? Did spectral layers show expected reconvergence? Use these observations to calibrate your interpretation of signal quality over time.
Best Performance Conditions
This topology-based approach performs optimally in specific market environments:
Favorable Conditions:
Well-Developed Swing Structure: Markets with clear rhythm of advances and declines where pivots form at regular intervals. The manifold reconstruction depends on swing formation, so instruments that trend in clear waves work best. Stocks, major forex pairs during active sessions, and established crypto assets typically exhibit this characteristic.
Sufficient Volatility for Topology Development: The embedding process requires meaningful price movement to construct multi-dimensional coordinates. Extremely quiet markets (tight consolidations, holiday trading, after-hours) lack the volatility needed for manifold differentiation. Look for ATR expansion above average—when volatility is present, geometry becomes meaningful.
Trending with Periodic Reversals: The ideal environment is not pure trend (which rarely reverses) nor pure range (which reverses constantly at small scale), but rather trending behavior punctuated by occasional significant counter-trend reversals. This creates the catastrophe conditions the system is designed to detect: manifold building directional momentum, then undergoing sharp topology break at extremes.
Liquid Instruments Where EMAs Reflect True Flow: The spectral layers and frequency decomposition require that moving averages genuinely represent market consensus. Thinly traded instruments with sporadic orders don't create smooth manifold topology. Prefer instruments with consistent volume where EMA calculations reflect actual capital flow rather than random tick sequences.
Challenging Conditions:
Extremely Choppy / Whipsaw Markets: When price oscillates rapidly with no directional persistence (Hurst < 0.40), the manifold undergoes constant micro-catastrophes that don't translate to tradable reversals. The regime filter helps avoid these, but awareness is important. If you see multiple neutral signals clustering with no follow-through, market is too chaotic for this approach.
Very Low Volatility Consolidation: Tight ranges with ATR below average cause the embedding coordinates to compress into a small region of phase space, reducing geometric differentiation. The manifold becomes nearly flat, and catastrophe detection loses sensitivity. The regime filter's volatility component addresses this, but manually avoiding dead markets improves results.
Gap-Heavy Instruments: Stocks that gap frequently (opening outside previous close) create discontinuities in the manifold trajectory. The embedding process assumes continuous evolution, so gaps introduce artifacts. Most gaps don't invalidate the approach, but instruments with daily gaps >2% regularly may show degraded performance. Consider using higher timeframes (4H, Daily) where gaps are less proportionally significant.
Parabolic Moves / Blowoff Tops: When price enters an exponential acceleration phase (vertical rally or crash), the manifold evolves too rapidly for the standard embedding window to track. Catastrophe detection may lag or produce false signals mid-move. These conditions are rare but identifiable by Hurst > 0.75 combined with ATR expansion >2.0× average. If detected, consider sitting out or using very tight stops as geometry is in extreme distortion.
The system adapts by reducing signal frequency in poor conditions—if you notice long periods with no signals, the topology likely lacks the geometric structure needed for reliable catastrophe detection. This is a feature, not a bug: it prevents forced trading during unfavorable environments.
Theoretical Justification for Approach
Why Manifold Embedding?
Traditional technical analysis treats price as a one-dimensional time series: current price is predicted from past prices in sequential order. This approach ignores the structure of price dynamics—the relationships between velocity, acceleration, and participation that govern how price actually evolves.
Dynamical systems theory (from physics and mathematics) provides an alternative framework: treat price as a state variable in a multi-dimensional phase space. In this view, each market condition corresponds to a point in N-dimensional space, and market evolution is a trajectory through this space. The geometry of this space (its topology) constrains what trajectories are possible.
Manifold embedding reconstructs this hidden geometric structure from observable price data. By creating coordinates from velocity, momentum acceleration, and volume-weighted returns, we map price evolution onto a 3D surface. This surface—the manifold—reveals geometric relationships that aren't visible in price charts alone.
The mathematical theorem underlying this approach (Takens' Embedding Theorem from dynamical systems theory) proves that for deterministic or weakly stochastic systems, a state space reconstruction from time-delayed observations of a single variable captures the essential dynamics of the full system. We apply this principle: even though we only observe price, the embedded coordinates (derivatives of price) reconstruct the underlying dynamical structure.
Why Catastrophe Theory?
Catastrophe theory, developed by mathematician René Thom (Fields Medal 1958), describes how continuous systems can undergo sudden discontinuous changes when control parameters reach critical values. A classic example: gradually increasing force on a beam causes smooth bending, then sudden catastrophic buckling. The beam's geometry reaches a critical curvature where topology must break.
Markets exhibit analogous behavior: gradual price changes build tension in the manifold topology until critical distortion is reached, then abrupt directional change occurs (reversal). Catastrophes aren't random—they're mathematically necessary when geometric constraints are violated.
The indicator detects these geometric precursors: high curvature (manifold bending sharply), high complexity (topology oscillating chaotically), high condition number (coordinate mapping becoming singular). These metrics quantify how close the manifold is to a catastrophic fold. When all simultaneously reach extreme values, topology break is imminent.
This provides a logical foundation for reversal detection that doesn't rely on pattern recognition or historical correlation. We're measuring geometric properties that mathematically must change when systems reach critical states. This is why the approach works across different instruments and timeframes—the underlying geometry is universal.
Why Hurst Exponent?
Markets exhibit fractal behavior: patterns at different time scales show statistical self-similarity. The Hurst exponent quantifies this fractal structure by measuring long-range dependence in returns.
Critically for trading, Hurst determines whether recent price movement predicts future direction (H > 0.5) or predicts the opposite (H < 0.5). This is regime detection: trending vs mean-reverting behavior.
The same manifold catastrophe has different trading implications depending on regime. In trending regime (high Hurst), catastrophes represent significant reversal opportunities because the manifold has been building directional momentum that suddenly breaks. In mean-reverting regime (low Hurst), catastrophes represent minor oscillations because the manifold constantly folds at small scales.
By weighting catastrophe signals based on Hurst, the system adapts detection sensitivity to the current fractal regime. This is a form of meta-analysis: not just detecting geometric breaks, but evaluating whether those breaks are meaningful in the current fractal context.
Why Multi-Layer Confirmation?
Geometric anomalies occur frequently in noisy market data. Not every high-curvature point represents a tradable reversal—many are artifacts of microstructure noise, order flow imbalances, or low-liquidity ticks.
The five-filter confirmation system (catastrophe threshold, pivot structure, swing size, volume, regime) addresses this by requiring geometric anomalies to align with observable market evidence. This conjunction-based logic implements the principle: extraordinary claims require extraordinary evidence .
A manifold catastrophe (extraordinary geometric event) alone is not sufficient. We additionally require: price formed a pivot (visible structure), swing was significant (adequate magnitude), volume confirmed participation (capital backed the move), and regime was favorable (trending or volatile, not chopping). Only when all five dimensions agree do we have sufficient evidence that the geometric anomaly represents a genuine reversal opportunity rather than noise.
This multi-dimensional approach is analogous to medical diagnosis: no single test is conclusive, but when multiple independent tests all suggest the same condition, confidence increases dramatically. Each filter removes a different category of false signals, and their combination creates a robust detection system.
The result is a signal set with dramatically improved reliability compared to any single metric alone. This is the power of ensemble methods applied to geometric analysis.
Important Disclaimers
This indicator applies mathematical topology and catastrophe theory to multi-dimensional price space reconstruction. It identifies geometric conditions where manifold curvature, topological complexity, and coordinate singularities suggest potential reversal zones based on phase space analysis. It should not be used as a standalone trading system.
The embedding coordinates, catastrophe scores, and Hurst calculations are deterministic mathematical formulas applied to historical price data. These measurements describe current and recent geometric relationships in the reconstructed manifold but do not predict future price movements. Past geometric patterns and singularity markers do not guarantee future market behavior will follow similar topology evolution.
The manifold reconstruction assumes certain mathematical properties (sufficient embedding dimension, quasi-stationarity, continuous dynamics) that may not hold in all market conditions. Gaps, flash crashes, circuit breakers, news events, and other discontinuities can violate these assumptions. The system attempts to filter problematic conditions through regime classification, but cannot eliminate all edge cases.
The spectral decomposition, energy fields, and probability cones are visualization aids that represent mathematical constructs, not price predictions. The probability cone projects current gradient forward assuming topology continues current trajectory—this is a mathematical "if-then" statement, not a forecast. Market topology can and does change unexpectedly.
All trading involves substantial risk. The singularity markers represent analytical conditions where geometric mathematics align with threshold criteria, not certainty of directional change. Use appropriate risk management for every trade: position sizing based on account risk tolerance (typically 1-2% maximum risk per trade), stop losses placed beyond recent structure plus volatility buffer, and never risk capital needed for living expenses.
The confirmation filters (pivot, swing size, volume, regime) are designed to reduce false signals but cannot eliminate them entirely. Markets can produce geometric anomalies that pass all filters yet fail to develop into sustained reversals. This is inherent to probabilistic systems operating on noisy real-world data.
No indicator can guarantee profitable trades or eliminate losses. The catastrophe detection provides an analytical framework for identifying potential reversal conditions, but actual trading outcomes depend on numerous factors including execution, slippage, spreads, position sizing, risk management, psychological discipline, and market conditions that may change after signal generation.
Use this tool as one component of a comprehensive trading plan that includes multiple forms of analysis, proper risk management, emotional discipline, and realistic expectations about win rates and drawdowns. Combine catastrophe signals with additional confirmation methods such as support/resistance analysis, volume patterns, multi-timeframe alignment, and broader market context.
The spacing filter, cooldown mechanism, and regime validation are designed to reduce noise and over-signaling, but market conditions can change rapidly and render any analytical signal invalid. Always use stop losses and never risk capital you cannot afford to lose. Past performance of detection accuracy does not guarantee future results.
Technical Implementation Notes
All calculations execute on closed bars only—signals and metric values do not repaint after bar close. The indicator does not use any lookahead bias in its calculations. However, the pivot detection mechanism (ta.pivothigh and ta.pivotlow) inherently identifies pivots with a lag equal to the lookback parameter, meaning the actual pivot occurred at bar but is recognized at bar . This is standard behavior for pivot functions and is not repainting—once recognized, the pivot bar never changes.
The normalization system (z-score transformation over rolling windows) requires approximately 30-50 bars of historical data to establish stable statistics. Values in the first 30-50 bars after adding the indicator may show instability as the rolling means and standard deviations converge. Allow adequate warmup period before relying on signals.
The spectral layer arrays, energy field boxes, gradient flow labels, and node geometry lines are subject to TradingView drawing object limits (500 lines, 500 boxes, 500 labels per indicator as specified in settings). The system implements automatic cleanup by deleting oldest objects when limits approach, but on very long charts with many signals, some historical visual elements may be removed to stay within limits. This does not affect signal generation or dashboard metrics—only historical visual artifacts.
Dashboard and visual rendering update only on the last bar to minimize computational overhead. The catastrophe detection logic executes on every bar, but table cells and drawing objects refresh conditionally to optimize performance. If experiencing chart lag, reduce visual complexity: disable spectral layers, energy fields, or flow field to improve rendering speed. Core signal detection continues to function with all visual elements disabled.
The Hurst calculation uses logarithmic returns rather than raw price to ensure stationarity, and implements clipping to range to handle edge cases where R/S analysis produces invalid values (which can occur during extended periods of identical prices or numerical overflow). The 5-period EMA smoothing reduces noise while maintaining responsiveness to regime transitions.
The condition number calculation adds epsilon (1e-10) to denominators to prevent division by zero when Jacobian determinant approaches zero—which is precisely the singularity condition we're detecting. This numerical stability measure ensures the indicator doesn't crash when detecting the very phenomena it's designed to identify.
The indicator has been tested across multiple timeframes (5-minute through daily) and multiple asset classes (forex majors, stock indices, individual equities, cryptocurrencies, commodities, futures). It functions identically across all instruments due to the adaptive normalization approach and percentage-based metrics. No instrument-specific code or parameter sets are required.
The color scheme system implements seven preset themes plus custom mode. Color assignments are applied globally and affect all visual elements simultaneously. The opacity calculation system multiplies component-specific transparency with master opacity to create hierarchical control—adjusting master opacity affects all visuals proportionally while maintaining their relative transparency relationships.
All alert conditions trigger only on bar close to prevent false alerts from intrabar fluctuations. The regime transition alerts (VALID/INVALID) are particularly useful for knowing when trading edge appears or disappears, allowing traders to adjust activity levels accordingly.
— Dskyz, Trade with insight. Trade with anticipation.

Entries + FVG SignalsE+FVG: A Masterclass in Institutional Trading Concepts
Chapter 1: The Modern Trader's Dilemma—Decoding the Institutional Footprint
In the vast, often chaotic ocean of the financial markets, retail traders navigate with the tools they are given: conventional indicators like moving averages, RSI, and MACD. While useful for gauging momentum and general trends, these tools often fall short because they were not designed to interpret the primary force that moves markets: institutional order flow. The modern trader faces a critical challenge: the tools and concepts taught in mainstream trading education are often decades behind the sophisticated, algorithm-driven strategies employed by banks, hedge funds, and large financial institutions.
This leads to a frustrating cycle of seemingly inexplicable price movements. A trader might see a perfect breakout from a classic pattern, only for it to reverse viciously, stopping them out. They might identify a strong trend, yet struggle to find a logical entry point, consistently feeling "late to the party." These experiences are not random; they are often the result of institutional market manipulation designed to engineer liquidity.
The fundamental problem that E+FVG (Entries + FVG Signals) addresses is this informational asymmetry. It is a sophisticated, institutional-grade framework designed to move a trader's perspective from a retail mindset to a professional one. It does not rely on lagging, derivative indicators. Instead, it focuses on the two core elements of price action that reveal the true intentions of "Smart Money": liquidity and imbalances.
This is not merely another indicator to add to a chart; it is a complete analytical engine designed to help you see the market through a new lens. It deconstructs price action to pinpoint two critical things:
Where institutions are likely to hunt for liquidity (running stop-loss orders).
The specific price inefficiencies (Fair Value Gaps) they are likely to target.
By focusing on these core principles, E+FVG provides a logical, rules-based solution to identifying high-probability trade setups. It is built for the discerning trader who is ready to evolve beyond conventional technical analysis and learn a methodology that is aligned with how the market truly operates at an institutional level. It is, in essence, an operating system for "Smart Money" trading.
Chapter 2: The Core Philosophy—Liquidity is the Fuel, Imbalances are the Destination
To fully grasp the power of this tool, one must first understand its foundational philosophy, which is rooted in the core tenets of institutional trading, often referred to as Smart Money Concepts (SMC). This philosophy can be distilled into two simple, powerful ideas:
1. Liquidity is the Fuel that Moves the Market:
The market does not move simply because there are more buyers than sellers, or vice-versa. It moves to seek liquidity. Large institutions cannot simply click "buy" or "sell" to enter or exit their multi-million or billion-dollar positions. Doing so would cause massive slippage and alert the entire market to their intentions. Instead, they must strategically accumulate and distribute their positions in areas where there is a high concentration of orders.
Where are these orders located? They are clustered in predictable places: above recent swing highs (buy-stop orders from shorts, and breakout buy orders) and below recent swing lows (sell-stop orders from longs, and breakout sell orders). This collective pool of orders is called liquidity. Institutions will often drive price towards these liquidity pools in a "stop hunt" or "liquidity grab" to trigger those orders, creating the necessary volume for them to fill their own large positions, often in the opposite direction of the liquidity grab itself. Understanding this concept is the key to avoiding being the "fuel" and instead learning to trade alongside the institutions.
2. Imbalances (Fair Value Gaps) are the Magnets for Price:
When institutions enter the market with overwhelming force, they create an imbalance in the order book. This energetic, one-sided price movement often leaves behind a gap in the market's pricing mechanism. On a candlestick chart, this appears as a Fair Value Gap (FVG)—a three-candle formation where the wicks of the first and third candles do not fully overlap the range of the middle candle.
These are not random gaps; they represent an inefficiency in the market's price delivery. The market, in its constant quest for equilibrium, has a natural tendency to revisit these inefficiently priced areas to "rebalance" the order book. Therefore, FVGs act as powerful magnets for price. They serve as high-probability targets for a price move and, critically, as logical points of interest where price may reverse after filling the imbalance. A fresh, unfilled FVG is one of the most significant clues an institution leaves behind.
E+FVG is built entirely on this philosophy. The "Entries Simplified" engine is designed to identify the liquidity grabs, and the "FVG Signals" engine is designed to identify the imbalances. Together, they provide a complete, synergistic framework for institutional-grade analysis.
Chapter 3: The Engine, Part I—"Entries Simplified": A Framework for Precision Entry
This is the primary trade-spotting engine of the E+FVG tool. It is a multi-layered system designed to identify a very specific, high-probability entry model based on institutional behavior. It filters out market noise by focusing solely on the sequence of a liquidity sweep followed by a clear and energetic displacement.
Feature 1: The Multi-Timeframe Liquidity Engine
The first and most crucial step in the engine's logic is to identify a valid liquidity grab. The script understands that the most significant reversals are often initiated after price has swept a key high or low from a higher timeframe. A sweep of yesterday's high holds far more weight than a sweep of the last 5-minute high.
Automatic Timeframe Adaptation: The engine intelligently analyzes your current chart's timeframe and automatically selects an appropriate higher timeframe (HTF) for its core analysis. For instance, if you are on a 15-minute chart, it might reference the 4-hour or Daily chart to identify key structural points. This is done seamlessly in the background, ensuring the analysis is always anchored to a significant structural context without requiring manual input.
The "Sweep" Condition: The script is not looking for a simple touch of a high or low. It is looking for a definitive sweep (also known as a "stop hunt" or "Judas swing"). This is defined as price pushing just beyond a key prior candle's high or low and then closing back within its range. This specific price action pattern is a classic signature of a liquidity grab, indicating that the move's purpose was to trigger stops, not to start a new, sustained trend. The "Entries Simplified" engine is constantly scanning the HTF price action for these sweep events, as they are the necessary precondition for any potential setup.
Feature 2: The Upshift/Downshift Signal—Confirming the Reversal
Once a valid HTF liquidity sweep has occurred, the engine moves to its next phase: identifying the confirmation. A sweep alone is not enough; institutions must show their hand and reveal their intention to reverse the market. This confirmation comes in the form of a powerful structural breakout (for bullish reversals) or breakdown (for bearish reversals). We call these events Upshifts and Downshifts.
Defining the Upshift & Downshift: This is the critical moment of confirmation, the market "tipping its hand."
An Upshift occurs after a liquidity sweep below a key low. Following the sweep, price reverses with energy and produces a decisive breakout to the upside, closing above a recent, valid swing high. This action confirms that the prior downtrend's momentum is broken, the downward move was a trap to engineer liquidity, and institutional buyers are now in aggressive control.
A Downshift occurs after a liquidity sweep above a key high. Following the sweep, price reverses aggressively and produces a sharp breakdown to the downside, closing below a recent, valid swing low. This confirms that the prior uptrend's momentum has failed, the upward move was a liquidity grab, and institutional sellers have now taken control of the market.
Algorithmic Identification: The E+FVG engine uses a proprietary algorithm to identify these moments. It analyzes the candle sequence immediately following a sweep, looking for a specific type of market structure break characterized by high energy and displacement—often leaving imbalances (Fair Value Gaps) in its wake. This is not a simple "pivot break"; the algorithm is designed to distinguish between a weak, indecisive wiggle and a true, institutionally-backed Upshift or Downshift.
The Signal: When this precise sequence—a HTF liquidity sweep followed by a valid Upshift or Downshift on the trading timeframe—is confirmed, the indicator plots a clear arrow on the chart. A green arrow below a low signifies a Bullish setup (confirmed by an Upshift), while a red arrow above a high signifies a Bearish setup (confirmed by a Downshift). This is the core entry signal of the "Entries Simplified" engine.
Feature 3: Automated Price Projections—A Built-In Trade Management Framework
A valid entry signal is only one part of a successful trade. A trader also needs a logical framework for taking profits. The E+FVG engine completes its trade-spotting process by providing automated, mathematically-derived price projections.
Fibonacci-Based Logic: After a valid Upshift or Downshift signal is generated, the script analyzes the price leg that created the setup (i.e., the range from the liquidity sweep to the confirmation breakout/breakdown). It then uses a methodology based on standard Fibonacci extension principles to project several potential take-profit (TP) levels.
Multiple TP Levels: The indicator projects four distinct TP levels (TP1, TP2, TP3, TP4). This provides a comprehensive trade management framework. A conservative trader might aim for TP1 or TP2, while a more aggressive trader might hold a partial position for the higher targets. These levels are plotted on the chart as clear, labeled lines, removing the guesswork from profit-taking.
Dynamic and Adaptive: These projections are not static. They are calculated uniquely for each individual setup, based on the specific volatility and range of the price action that generated the signal. This ensures that the take-profit targets are always relevant to the current market conditions.
The "Entries Simplified" engine, therefore, provides a complete, end-to-end framework: it waits for a high-probability condition (HTF sweep), confirms it with a specific entry model (Upshift/Downshift), and provides a logical road map for managing the trade (automated projections).
Chapter 4: The Engine, Part II—"FVG Signals": Mapping Market Inefficiencies
This second, complementary engine of the E+FVG tool operates as a market mapping system. Its sole purpose is to identify, plot, and monitor Fair Value Gaps (FVGs)—the critical price inefficiencies that act as magnets and potential reversal points.
Feature 1: Dual Timeframe FVG Detection
The significance of an FVG is directly related to the timeframe on which it forms. A 1-hour FVG is a more powerful magnet for price than a 1-minute FVG. The FVG engine gives you the ability to monitor both simultaneously, providing a richer, multi-dimensional view of the market's inefficiencies.
Chart TF FVGs: The indicator will, by default, identify and plot the FVGs that form on your current, active chart timeframe. These are useful for short-term scalping and for fine-tuning entries.
Higher Timeframe (HTF) FVGs: With a single click, you can enable the HTF FVG detection. This allows you to overlay, for example, 1-hour FVGs onto your 5-minute chart. This is an incredibly powerful feature. Seeing a 5-minute price rally approaching a fresh, unfilled 1-hour bearish FVG gives you a high-probability context for a potential reversal. The HTF FVGs act as major points of interest that can override the short-term price action.
Feature 2: The Intelligent "Tap-In" Logic—Beyond a Simple Touch
Many FVG indicators will simply alert you when price touches an FVG. The E+FVG engine employs a more sophisticated, two-stage logic to generate its signals, which helps to filter out weak reactions and focus on confirmed reversals.
Stage 1: The Entry. The first event is when price simply enters the FVG zone. This is a "heads-up" moment, and the indicator can be configured to provide an initial alert for this event.
Stage 2: The Confirmed "Tap-In." The official signal, however, is the "Tap-In." This is a more stringent condition. For a bullish FVG, a Tap-In is only confirmed after price has touched or entered the FVG zone and then closed back above the FVG's high. For a bearish FVG, the price must touch or enter the zone and then close back below the FVG's low. This confirmation logic ensures that the FVG has not just been touched, but has been respected and rejected by the market, making the resulting arrow signal significantly more reliable than a simple touch alert.
Feature 3: Interactive and Clean Visuals
The FVG engine is designed to provide maximum information with minimum chart clutter.
Clear, Color-Coded Boxes: Bullish FVGs are plotted in one color (e.g., green or blue), and bearish FVGs in another (e.g., red or orange), with a clear distinction between Chart TF and HTF zones.
Optional Box Display: Recognizing that some traders prefer a cleaner chart, you have the option to hide the FVG boxes entirely. Even with the boxes hidden, the underlying logic remains active, and the script will still generate the crucial Tap-In arrow signals.
Automatic Fading: Once an FVG has been successfully "tapped," the script can be set to automatically fade the color of the box. This provides a clear visual cue that the zone has been tested and may have less significance going forward.
Expiration: FVGs do not remain relevant forever. The script automatically removes old FVG boxes from the chart after a user-defined number of bars, ensuring your analysis is always focused on the most recent and relevant market inefficiencies.
Chapter 5: The Power of Synergy—How the Two Engines Work Together
While both the "Entries Simplified" engine and the "FVG Signals" engine are powerful standalone tools, their true potential is unlocked when used in combination. They are designed to provide confluence—a scenario where two or more independent analytical concepts align to produce a single, high-conviction trade idea.
Scenario A: The A+ Setup (Upshift into FVG). This is the highest probability setup. Imagine the "Entries Simplified" engine detects a HTF liquidity sweep below a key low, followed by a bullish Upshift signal. You look at your chart and see that this strong upward displacement is heading directly towards a fresh, unfilled bearish HTF FVG. This provides you with both a high-probability entry signal and a logical, high-probability target for the trade.
Scenario B: The FVG Confirmation. A trader might see the "Entries Simplified" engine generate a bearish Downshift signal. They feel it is a valid setup but want one extra layer of confirmation. They wait for price to rally a little further and "tap-in" to a nearby bearish FVG that formed during the Downshift's displacement. The FVG Tap-In signal then serves as their final confirmation trigger to enter the trade.
Scenario C: The Standalone FVG Trade. The FVG engine can also be used as a primary trading tool. A trader might notice that price is in a strong uptrend. They see price pulling back towards a fresh, bullish HTF FVG. They are not waiting for a full Upshift/Downshift setup; instead, they are simply waiting for the FVG Tap-In signal to confirm that the pullback is likely over and the trend is ready to resume.
By learning to read the interplay between these two engines, a trader can elevate their analysis from a one-dimensional process to a multi-dimensional, context-aware methodology.
Chapter 6: The Workflow—A Step-by-Step Guide to Practical Application
Step 1: The Pre-Market Analysis (Mapping the Battlefield). Before your session begins, enable the HTF FVG detection. Identify the key, unfilled HTF FVGs above and below the current price. These are your major points of interest for the day—your potential targets and reversal zones.
Step 2: Await the Primary Condition (Patience for Liquidity). During your trading session, your primary focus should be on the "Entries Simplified" engine. Your job is to wait patiently for the script to identify a valid HTF liquidity sweep. Do not force trades in the middle of a price range where no significant liquidity has been taken.
Step 3: The Upshift/Downshift Alert (The Call to Action). When the red or green arrow from the "Entries Simplified" engine appears, it is your cue to focus your attention. This is a potential high-probability setup.
Step 4: The Confluence Check (Building Conviction). With the Upshift or Downshift signal on your chart, ask the key confluence questions:
Did the displacement from the Upshift/Downshift create a new FVG?
Is the projected path of the trade heading towards a pre-identified HTF FVG?
Has an FVG Tap-In signal appeared shortly after the initial signal, offering further confirmation?
Step 5: Execute and Manage. If you have sufficient confluence, execute the trade. Use the automated price projections as your guide for profit-taking. A logical stop-loss is typically placed just beyond the high or low of the liquidity sweep that initiated the entire sequence.
Chapter 7: The Trader's Mind—Mastering the Institutional Mindset
This tool is more than a set of algorithms; it is a training system for professional trading psychology.
From Chasing to Trapping: You stop chasing breakouts and instead learn to identify where others are being trapped.
From FOMO to Patience: The strict, sequential logic of the entry model (Sweep -> Upshift/Downshift) forces you to wait for the highest quality setups, curing the Fear Of Missing Out.
Probabilistic Thinking: By focusing on liquidity and imbalances, you begin to think in terms of probabilities, not certainties. You understand that you are putting on trades where the odds are statistically in your favor, which is the cornerstone of any professional trading career.
Clarity and Confidence: The clear, rules-based signals remove ambiguity and second-guessing. This builds the confidence needed to execute trades decisively when the opportunity arises.
Chapter 8: Frequently Asked Questions & Scenarios
Q: The "Entries Simplified" code looks complex. Do I need to understand all of it?
A: No. The engine is designed to perform its complex analysis in the background. Your job is to understand the principles—liquidity sweep and the resulting Upshift or Downshift—and to recognize the clear arrow signals that the script generates when those conditions are met.
Q: Can I turn one of the engines off?
A: Yes, the indicator is modular. If you only want to focus on Fair Value Gaps, for example, you can disable the plot shapes for the "Entries Simplified" signals in the settings, and vice-versa.
Q: Does this work on all assets and timeframes?
A: The principles of liquidity and imbalance are universal and apply to all markets, from cryptocurrencies to forex to indices. The fractal nature of the analysis means the concepts are valid on all timeframes. However, it is always recommended that a trader backtest and forward-test the tool on their specific instrument and timeframe of choice to understand its unique behavior.
Author's Instructions
To request access to this script, please send me a direct private message here on TradingView.
Alternatively, you can find more information and contact details via the link on my profile signature.
Please DO NOT request access in the Comments section. Comments are for questions about the script's methodology and for sharing constructive feedback.

FVG Premium [no1x]█ OVERVIEW
This indicator provides a comprehensive toolkit for identifying, visualizing, and tracking Fair Value Gaps (FVGs) across three distinct timeframes (current chart, a user-defined Medium Timeframe - MTF, and a user-defined High Timeframe - HTF). It is designed to offer traders enhanced insight into FVG dynamics through detailed state monitoring (formation, partial fill, full mitigation, midline touch), extensive visual customization for FVG representation, and a rich alert system for timely notifications on FVG-related events.
█ CONCEPTS
This indicator is built upon the core concept of Fair Value Gaps (FVGs) and their significance in price action analysis, offering a multi-layered approach to their detection and interpretation across different timeframes.
Fair Value Gaps (FVGs)
A Fair Value Gap (FVG), also known as an imbalance, represents a range in price delivery where one side of the market (buying or selling) was more aggressive, leaving an inefficiency or an "imbalance" in the price action. This concept is prominently featured within Smart Money Concepts (SMC) and Inner Circle Trader (ICT) methodologies, where such gaps are often interpreted as footprints left by "smart money" due to rapid, forceful price movements. These methodologies suggest that price may later revisit these FVG zones to rebalance a prior inefficiency or to seek liquidity before continuing its path. These gaps are typically identified by a three-bar pattern:
Bullish FVG : This is a three-candle formation where the second candle shows a strong upward move. The FVG is the space created between the high of the first candle (bottom of FVG) and the low of the third candle (top of FVG). This indicates a strong upward impulsive move.
Bearish FVG : This is a three-candle formation where the second candle shows a strong downward move. The FVG is the space created between the low of the first candle (top of FVG) and the high of the third candle (bottom of FVG). This indicates a strong downward impulsive move.
FVGs are often watched by traders as potential areas where price might return to "rebalance" or find support/resistance.
Multi-Timeframe (MTF) Analysis
The indicator extends FVG detection beyond the current chart's timeframe (Low Timeframe - LTF) to two higher user-defined timeframes: Medium Timeframe (MTF) and High Timeframe (HTF). This allows traders to:
Identify FVGs that might be significant on a broader market structure.
Observe how FVGs from different timeframes align or interact.
Gain a more comprehensive perspective on potential support and resistance zones.
FVG State and Lifecycle Management
The indicator actively tracks the lifecycle of each detected FVG:
Formation : The initial identification of an FVG.
Partial Fill (Entry) : When price enters but does not completely pass through the FVG. The indicator updates the "current" top/bottom of the FVG to reflect the filled portion.
Midline (Equilibrium) Touch : When price touches the 50% level of the FVG.
Full Mitigation : When price completely trades through the FVG, effectively "filling" or "rebalancing" the gap. The indicator records the mitigation time.
This state tracking is crucial for understanding how price interacts with these zones.
FVG Classification (Large FVG)
FVGs can be optionally classified as "Large FVGs" (LV) if their size (top to bottom range) exceeds a user-defined multiple of the Average True Range (ATR) for that FVG's timeframe. This helps distinguish FVGs that are significantly larger relative to recent volatility.
Visual Customization and Information Delivery
A key concept is providing extensive control over how FVGs are displayed. This control is achieved through a centralized set of visual parameters within the indicator, allowing users to configure numerous aspects (colors, line styles, visibility of boxes, midlines, mitigation lines, labels, etc.) for each timeframe. Additionally, an on-chart information panel summarizes the nearest unmitigated bullish and bearish FVG levels for each active timeframe, providing a quick glance at key price points.
█ FEATURES
This indicator offers a rich set of features designed to provide a highly customizable and comprehensive Fair Value Gap (FVG) analysis experience. Users can tailor the FVG detection, visual representation, and alerting mechanisms across three distinct timeframes: the current chart (Low Timeframe - LTF), a user-defined Medium Timeframe (MTF), and a user-defined High Timeframe (HTF).
Multi-Timeframe FVG Detection and Display
The core strength of this indicator lies in its ability to identify and display FVGs from not only the current chart's timeframe (LTF) but also from two higher, user-selectable timeframes (MTF and HTF).
Timeframe Selection: Users can specify the exact MTF (e.g., "60", "240") and HTF (e.g., "D", "W") through dedicated inputs in the "MTF (Medium Timeframe)" and "HTF (High Timeframe)" settings groups. The visibility of FVGs from these higher timeframes can be toggled independently using the "Show MTF FVGs" and "Show HTF FVGs" checkboxes.
Consistent Detection Logic: The FVG detection logic, based on the classic three-bar imbalance pattern detailed in the 'Concepts' section, is applied consistently across all selected timeframes (LTF, MTF, HTF)
Timeframe-Specific Visuals: Each timeframe's FVGs (LTF, MTF, HTF) can be customized with unique colors for bullish/bearish states and their mitigated counterparts. This allows for easy visual differentiation of FVGs originating from different market perspectives.
Comprehensive FVG Visualization Options
The indicator provides extensive control over how FVGs are visually represented on the chart for each timeframe (LTF, MTF, HTF).
FVG Boxes:
Visibility: Main FVG boxes can be shown or hidden per timeframe using the "Show FVG Boxes" (for LTF), "Show Boxes" (for MTF/HTF) inputs.
Color Customization: Colors for bullish, bearish, active, and mitigated FVG boxes (including Large FVGs, if classified) are fully customizable for each timeframe.
Box Extension & Length: FVG boxes can either be extended to the right indefinitely ("Extend Boxes Right") or set to a fixed length in bars ("Short Box Length" or "Box Length" equivalent inputs).
Box Labels: Optional labels can display the FVG's timeframe and fill percentage on the box. These labels are configurable for all timeframes (LTF, MTF, and HTF). Please note: If FVGs are positioned very close to each other on the chart, their respective labels may overlap. This can potentially lead to visual clutter, and it is a known behavior in the current version of the indicator.
Box Borders: Visibility, width, style (solid, dashed, dotted), and color of FVG box borders are customizable per timeframe.
Midlines (Equilibrium/EQ):
Visibility: The 50% level (midline or EQ) of FVGs can be shown or hidden for each timeframe.
Style Customization: Width, style, and color of the midline are customizable per timeframe. The indicator tracks if this midline has been touched by price.
Mitigation Lines:
Visibility: Mitigation lines (representing the FVG's opening level that needs to be breached for full mitigation) can be shown or hidden for each timeframe. If shown, these lines are always extended to the right.
Style Customization: Width, style, and color of the mitigation line are customizable per timeframe.
Mitigation Line Labels: Optional price labels can be displayed on mitigation lines, with a customizable horizontal bar offset for positioning. For optimal label placement, the following horizontal bar offsets are recommended: 4 for LTF, 8 for MTF, and 12 for HTF.
Persistence After Mitigation: Users can choose to keep mitigation lines visible even after an FVG is fully mitigated, with a distinct color for such lines. Importantly, this option is only effective if the general setting 'Hide Fully Mitigated FVGs' is disabled, as otherwise, the entire FVG and its lines will be removed upon mitigation.
FVG State Management and Behavior
The indicator tracks and visually responds to changes in FVG states.
Hide Fully Mitigated FVGs: This option, typically found in the indicator's general settings, allows users to automatically remove all visual elements of an FVG from the chart once price has fully mitigated it. This helps maintain chart clarity by focusing on active FVGs.
Partial Fill Visualization: When price enters an FVG, the indicator offers a dynamic visual representation: the portion of the FVG that has been filled is shown as a "mitigated box" (typically with a distinct color), while the original FVG box shrinks to clearly highlight the remaining, unfilled portion. This two-part display provides an immediate visual cue about how much of the FVG's imbalance has been addressed and what potential remains within the gap.
Visual Filtering by ATR Proximity: To help users focus on the most relevant price action, FVGs can be dynamically hidden if they are located further from the current price than a user-defined multiple of the Average True Range (ATR). This behavior is controlled by the "Filter Band Width (ATR Multiple)" input; setting this to zero disables the filter entirely, ensuring all detected FVGs remain visible regardless of their proximity to price.
Alternative Usage Example: Mitigation Lines as Key Support/Resistance Levels
For traders preferring a minimalist chart focused on key Fair Value Gap (FVG) levels, the indicator's visualization settings can be customized to display only FVG mitigation lines. This approach leverages these lines as potential support and resistance zones, reflecting areas where price might revisit to address imbalances.
To configure this view:
Disable FVG Boxes: Turn off "Show FVG Boxes" (for LTF) or "Show Boxes" (for MTF/HTF) for the desired timeframes.
Hide Midlines: Disable the visibility of the 50% FVG Midlines (Equilibrium/EQ).
Ensure Mitigation Lines are Visible: Keep "Mitigation Lines" enabled.
Retain All Mitigation Lines:
Disable the "Hide Fully Mitigated FVGs" option in the general settings.
Enable the feature to "keep mitigation lines visible even after an FVG is fully mitigated". This ensures lines from all FVGs (active or fully mitigated) remain on the chart, which is only effective if "Hide Fully Mitigated FVGs" is disabled.
This setup offers:
A Decluttered Chart: Focuses solely on the FVG opening levels.
Precise S/R Zones: Treats mitigation lines as specific points for potential price reactions.
Historical Level Analysis: Includes lines from past, fully mitigated FVGs for a comprehensive view of significant price levels.
For enhanced usability with this focused view, consider these optional additions:
The on-chart Information Panel can be activated to display a quick summary of the nearest unmitigated FVG levels.
Mitigation Line Labels can also be activated for clear price level identification. A customizable horizontal bar offset is available for positioning these labels; for example, offsets of 4 for LTF, 8 for MTF, and 12 for HTF can be effective.
FVG Classification (Large FVG)
This feature allows for distinguishing FVGs based on their size relative to market volatility.
Enable Classification: Users can enable "Classify FVG (Large FVG)" to identify FVGs that are significantly larger than average.
ATR-Based Threshold: An FVG is classified as "Large" if its height (price range) is greater than or equal to the Average True Range (ATR) of its timeframe multiplied by a user-defined "Large FVG Threshold (ATR Multiple)". The ATR period for this calculation is also configurable.
Dedicated Colors: Large FVGs (both bullish/bearish and active/mitigated) can be assigned unique colors, making them easily distinguishable on the chart.
Panel Icon: Large FVGs are marked with a special icon in the Info Panel.
Information Panel
An on-chart panel provides a quick summary of the nearest unmitigated FVG levels.
Visibility and Position: The panel can be shown/hidden and positioned in any of the nine standard locations on the chart (e.g., Top Right, Middle Center).
Content: It displays the price levels of the nearest unmitigated bullish and bearish FVGs for LTF, MTF (if active), and HTF (if active). It also indicates if these nearest FVGs are Large FVGs (if classification is enabled) using a selectable icon.
Styling: Text size, border color, header background/text colors, default text color, and "N/A" cell background color are customizable.
Highlighting: Background and text colors for the cells displaying the overall nearest bullish and bearish FVG levels (across all active timeframes) can be customized to draw attention to the most proximate FVG.
Comprehensive Alert System
The indicator offers a granular alert system for various FVG-related events, configurable for each timeframe (LTF, MTF, HTF) independently. Users can enable alerts for:
New FVG Formation: Separate alerts for new bullish and new bearish FVG formations.
FVG Entry/Partial Fill: Separate alerts for price entering a bullish FVG or a bearish FVG.
FVG Full Mitigation: Separate alerts for full mitigation of bullish and bearish FVGs.
FVG Midline (EQ) Touch: Separate alerts for price touching the midline of a bullish or bearish FVG.
Alert messages are detailed, providing information such as the timeframe, FVG type (bull/bear, Large FVG), relevant price levels, and timestamps.
█ NOTES
This section provides additional information regarding the indicator's usage, performance considerations, and potential interactions with the TradingView platform. Understanding these points can help users optimize their experience and troubleshoot effectively.
Performance and Resource Management
Maximum FVGs to Track : The "Max FVGs to Track" input (defaulting to 25) limits the number of FVG objects processed for each category (e.g., LTF Bullish, MTF Bearish). Increasing this value significantly can impact performance due to more objects being iterated over and potentially drawn, especially when multiple timeframes are active.
Drawing Object Limits : To manage performance, this script sets its own internal limits on the number of drawing objects it displays. While it allows for up to approximately 500 lines (max_lines_count=500) and 500 labels (max_labels_count=500), the number of FVG boxes is deliberately restricted to a maximum of 150 (max_boxes_count=150). This specific limit for boxes is a key performance consideration: displaying too many boxes can significantly slow down the indicator, and a very high number is often not essential for analysis. Enabling all visual elements for many FVGs across all three timeframes can cause the indicator to reach these internal limits, especially the stricter box limit
Optimization Strategies : To help you manage performance, reduce visual clutter, and avoid exceeding drawing limits when using this indicator, I recommend the following strategies:
Maintain or Lower FVG Tracking Count: The "Max FVGs to Track" input defaults to 25. I find this value generally sufficient for effective analysis and balanced performance. You can keep this default or consider reducing it further if you experience performance issues or prefer a less dense FVG display.
Utilize Proximity Filtering: I suggest activating the "Filter Band Width (ATR Multiple)" option (found under "General Settings") to display only those FVGs closer to the current price. From my experience, a value of 5 for the ATR multiple often provides a good starting point for balanced performance, but you should feel free to adjust this based on market volatility and your specific trading needs.
Hide Fully Mitigated FVGs: I strongly recommend enabling the "Hide Fully Mitigated FVGs" option. This setting automatically removes all visual elements of an FVG from the chart once it has been fully mitigated by price. Doing so significantly reduces the number of active drawing objects, lessens computational load, and helps maintain chart clarity by focusing only on active, relevant FVGs.
Disable FVG Display for Unused Timeframes: If you are not actively monitoring certain higher timeframes (MTF or HTF) for FVG analysis, I advise disabling their display by unchecking "Show MTF FVGs" or "Show HTF FVGs" respectively. This can provide a significant performance boost.
Simplify Visual Elements: For active FVGs, consider hiding less critical visual elements if they are not essential for your specific analysis. This could include box labels, borders, or even entire FVG boxes if, for example, only the mitigation lines are of interest for a particular timeframe.
Settings Changes and Platform Limits : This indicator is comprehensive and involves numerous calculations and drawings. When multiple settings are changed rapidly in quick succession, it is possible, on occasion, for TradingView to issue a "Runtime error: modify_study_limit_exceeding" or similar. This can cause the indicator to temporarily stop updating or display errors.
Recommended Approach : When adjusting settings, it is advisable to wait a brief moment (a few seconds) after each significant change. This allows the indicator to reprocess and update on the chart before another change is made
Error Recovery : Should such a runtime error occur, making a minor, different adjustment in the settings (e.g., toggling a checkbox off and then on again) and waiting briefly will typically allow the indicator to recover and resume correct operation. This behavior is related to platform limitations when handling complex scripts with many inputs and drawing objects.
Multi-Timeframe (MTF/HTF) Data and Behavior
HTF FVG Confirmation is Essential: : For an FVG from a higher timeframe (MTF or HTF) to be identified and displayed on your current chart (LTF), the three-bar pattern forming the FVG on that higher timeframe must consist of fully closed bars. The indicator does not draw speculative FVGs based on incomplete/forming bars from higher timeframes.
Data Retrieval and LTF Processing: The indicator may use techniques like lookahead = barmerge.lookahead_on for timely data retrieval from higher timeframes. However, the actual detection of an FVG occurs after all its constituent bars on the HTF have closed.
Appearance Timing on LTF (1 LTF Candle Delay): As a natural consequence of this, an FVG that is confirmed on an HTF (i.e., its third bar closes) will typically become visible on your LTF chart one LTF bar after its confirmation on the HTF.
Example: Assume an FVG forms on a 30-minute chart at 15:30 (i.e., with the close of the 30-minute bar that covers the 15:00-15:30 period). If you are monitoring this FVG on a 15-minute chart, the indicator will detect this newly formed 30-minute FVG while processing the data for the 15-minute bar that starts at 15:30 and closes at 15:45. Therefore, the 30-minute FVG will become visible on your 15-minute chart at the earliest by 15:45 (i.e., with the close of that relevant 15-minute LTF candle). This means the HTF FVG is reflected on the LTF chart with a delay equivalent to one LTF candle.
FVG Detection and Display Logic
Fair Value Gaps (FVGs) on the current chart timeframe (LTF) are detected based on barstate.isconfirmed. This means the three-bar pattern must be complete with closed bars before an FVG is identified. This confirmation method prevents FVGs from being prematurely identified on the forming bar.
Alerts
Alert Setup : To receive alerts from this indicator, you must first ensure you have enabled the specific alert conditions you are interested in within the indicator's own settings (see 'Comprehensive Alert System' under the 'FEATURES' section). Once configured, open TradingView's 'Create Alert' dialog. In the 'Condition' tab, select this indicator's name, and crucially, choose the 'Any alert() function call' option from the dropdown list. This setup allows the indicator to trigger alerts based on the precise event conditions you have activated in its settings
Alert Frequency : Alerts are designed to trigger once per bar close (alert.freq_once_per_bar_close) for the specific event.
User Interface (UI) Tips
Settings Group Icons: In the indicator settings menu, timeframe-specific groups are marked with star icons for easier navigation: 🌟 for LTF (Current Chart Timeframe), 🌟🌟 for MTF (Medium Timeframe), and 🌟🌟🌟 for HTF (High Timeframe).
Dependent Inputs: Some input settings are dependent on others being enabled. These dependencies are visually indicated in the settings menu using symbols like "↳" (dependent setting on the next line), "⟷" (mutually exclusive inline options), or "➜" (directly dependent inline option).
Settings Layout Overview: The indicator settings are organized into logical groups for ease of use. Key global display controls – such as toggles for MTF FVGs, HTF FVGs (along with their respective timeframe selectors), and the Information Panel – are conveniently located at the very top within the '⚙️ General Settings' group. This placement allows for quick access to frequently adjusted settings. Other sections provide detailed customization options for each timeframe (LTF, MTF, HTF), specific FVG components, and alert configurations.
█ FOR Pine Script® CODERS
This section provides a high-level overview of the FVG Premium indicator's internal architecture, data flow, and the interaction between its various library components. It is intended for Pine Script™ programmers who wish to understand the indicator's design, potentially extend its functionality, or learn from its structure.
System Architecture and Modular Design
The indicator is architected moduarly, leveraging several custom libraries to separate concerns and enhance code organization and reusability. Each library has a distinct responsibility:
FvgTypes: Serves as the foundational data definition layer. It defines core User-Defined Types (UDTs) like fvgObject (for storing all attributes of an FVG) and drawSettings (for visual configurations), along with enumerations like tfType.
CommonUtils: Provides utility functions for common tasks like mapping user string inputs (e.g., "Dashed" for line style) to their corresponding Pine Script™ constants (e.g., line.style_dashed) and formatting timeframe strings for display.
FvgCalculations: Contains the core logic for FVG detection (both LTF and MTF/HTF via requestMultiTFBarData), FVG classification (Large FVGs based on ATR), and checking FVG interactions with price (mitigation, partial fill).
FvgObject: Implements an object-oriented approach by attaching methods to the fvgObject UDT. These methods manage the entire visual lifecycle of an FVG on the chart, including drawing, updating based on state changes (e.g., mitigation), and deleting drawing objects. It's responsible for applying the visual configurations defined in drawSettings.
FvgPanel: Manages the creation and dynamic updates of the on-chart information panel, which displays key FVG levels.
The main indicator script acts as the orchestrator, initializing these libraries, managing user inputs, processing data flow between libraries, and handling the main event loop (bar updates) for FVG state management and alerts.
Core Data Flow and FVG Lifecycle Management
The general data flow and FVG lifecycle can be summarized as follows:
Input Processing: User inputs from the "Settings" dialog are read by the main indicator script. Visual style inputs (colors, line styles, etc.) are consolidated into a types.drawSettings object (defined in FvgTypes). Other inputs (timeframes, filter settings, alert toggles) control the behavior of different modules. CommonUtils assists in mapping some string inputs to Pine constants.
FVG Detection:
For the current chart timeframe (LTF), FvgCalculations.detectFvg() identifies potential FVGs based on bar patterns.
For MTF/HTF, the main indicator script calls FvgCalculations.requestMultiTFBarData() to fetch necessary bar data from higher timeframes, then FvgCalculations.detectMultiTFFvg() identifies FVGs.
Newly detected FVGs are instantiated as types.fvgObject and stored in arrays within the main script. These objects also undergo classification (e.g., Large FVG) by FvgCalculations.
State Update & Interaction: On each bar, the main indicator script iterates through active FVG objects to manage their state based on price interaction:
Initially, the main script calls FvgCalculations.fvgInteractionCheck() to efficiently determine if the current bar's price might be interacting with a given FVG.
If a potential interaction is flagged, the main script then invokes methods directly on the fvgObject instance (e.g., updateMitigation(), updatePartialFill(), checkMidlineTouch(), which are part of FvgObject).
These fvgObject methods are responsible for the detailed condition checking and the actual modification of the FVG's state. For instance, the updateMitigation() and updatePartialFill() methods internally utilize specific helper functions from FvgCalculations (like checkMitigation() and checkPartialMitigation()) to confirm the precise nature of the interaction before updating the fvgObject’s state fields (such as isMitigated, currentTop, currentBottom, or isMidlineTouched).
Visual Rendering:
The FvgObject.updateDrawings() method is called for each fvgObject. This method is central to drawing management; it creates, updates, or deletes chart drawings (boxes, lines, labels) based on the FVG's current state, its prev_* (previous bar state) fields for optimization, and the visual settings passed via the drawSettings object.
Information Panel Update: The main indicator script determines the nearest FVG levels, populates a panelData object (defined in FvgPanelLib), and calls FvgPanel.updatePanel() to refresh the on-chart display.
Alert Generation: Based on the updated FVG states and user-enabled alert settings, the main indicator script constructs and triggers alerts using Pine Script's alert() function."
Key Design Considerations
UDT-Centric Design: The fvgObject UDT is pivotal, acting as a stateful container for all information related to a single FVG. Most operations revolve around creating, updating, or querying these objects.
State Management: To optimize drawing updates and manage FVG lifecycles, fvgObject instances store their previous bar's state (e.g., prevIsVisible, prevCurrentTop). The FvgObject.updateDrawings() method uses this to determine if a redraw is necessary, minimizing redundant drawing calls.
Settings Object: A drawSettings object is populated once (or when inputs change) and passed to drawing functions. This avoids repeatedly reading numerous input() values on every bar or within loops, improving performance.
Dynamic Arrays for FVG Storage: Arrays are used to store collections of fvgObject instances, allowing for dynamic management (adding new FVGs, iterating for updates).

FVG | iSolani
Unveiling Market Inefficiencies with Precision
In fast-moving markets, spotting hidden opportunities often hinges on identifying imbalances between price and value. The FVG | iSolani indicator revolutionises this process by detecting Fair Value Gaps (FVGs) —zones where price action skips over "fair" valuation levels, creating potential retracement targets. Combining advanced filtering, dynamic visualisation, and automated management, this tool empowers traders to pinpoint high-probability setups with unprecedented clarity.
Core Methodology
The indicator employs a multi-layered approach to identify FVGs:
Three-Bar Gap Analysis: Bullish FVGs form when the current low exceeds the high of two bars prior, while bearish FVGs occur when the current high stays below the low of two bars back.
Volatility-Adjusted Filtering: Gaps are measured against a 100-bar standard deviation to exclude insignificant price jumps.
Volume Confirmation: Only gaps accompanied by above-average volume (relative to a 1-bar SMA) are validated, filtering out low-conviction moves.
Auto-Invalidation System: Continuously monitors price action to remove FVG zones once price closes within their range, maintaining chart cleanliness.
Breaking New Ground
This tool introduces three paradigm-shifting innovations:
Volume-Weighted Significance: Unlike traditional FVG detectors, it ties gap validity to volume spikes, emphasising institutional activity.
Adaptive Zone Management: Boxes automatically extend rightward (when enabled) and self-destruct when invalidated, eliminating manual cleanup.
Smart Color Encoding: Offers both monochrome (for multi-timeframe analysis) and standard bull/bear color schemes, with customisable transparency.
Engine Under the Hood
The script operates through four key processes:
Gap Detection: Scans every new bar for three-candle patterns meeting FVG criteria.
Statistical Filtering: Applies user-defined threshold (default: 1σ) to separate meaningful gaps from market noise.
Box Rendering: Draws semi-transparent zones between gap boundaries using TradingView's box objects, styled according to user preferences.
Array-Based Memory: Stores all active FVGs in arrays, enabling real-time validation checks against current price action.
Standard Configuration
Optimised default settings balance visibility and functionality:
Filter: 1.0 (1 standard deviation threshold)
Colors: "Mono" mode (gray boxes) with 90% transparency
Text Labels: Enabled in medium gray
Extension: Gaps extend indefinitely rightward
Borders: Dotted lines with visible outlines
Through its fusion of quantitative rigor and visual adaptability, the FVG | iSolani transforms raw price data into actionable intelligence. By focusing on volume-confirmed gaps and automating zone management, it cuts through market chaos to reveal structurally significant levels—a must-have for traders navigating breakouts, reversals, or order-flow analysis.

CandelaCharts - Volume Imbalance (VI) 📝 Overview
Volume Imbalance occurs when there’s a noticeable gap between the bodies of two consecutive candlesticks, with no overlap between them. While the wicks of the candles might intersect, the candle bodies remain entirely separate. This phenomenon often signifies that the algorithm driving market activity did not evenly distribute prices between these two levels, leaving behind a small Volume Imbalance (VI).
A Bullish Volume Imbalance forms when the body of a green candlestick gaps above the previous candle’s body, with no overlap, indicating strong upward momentum and insufficient sell-side liquidity.
A Bearish Volume Imbalance forms when the body of a red candlestick gaps below the previous candle’s body, with no overlap, signaling intense downward pressure and a lack of buy-side liquidity.
This indicator can automatically identify volume imbalances by scanning candlestick patterns and detecting gaps between consecutive candle bodies. These volume imbalances act as price magnets, often attracting the market back to fill the gap before resuming its original direction. Recognizing and leveraging these gaps can be a powerful tool in technical analysis for predicting price movements.
📦 Features
MTF
Mitigation
Consequent Encroachment
Threshold
Hide Overlap
Advanced Styling
⚙️ Settings
Show: Controls whether VIs are displayed on the chart.
Show Last: Sets the number of VIs you want to display.
Length: Determines the length of each VI.
Mitigation: Highlights when a VI has been touched, using a different color without marking it as invalid.
Timeframe: Specifies the timeframe used to detect VIs.
Threshold: Sets the minimum gap size required for VI detection on the chart.
Show Mid-Line: Configures the midpoint line's width and style within the VI. (Consequent Encroachment - CE)
Show Border: Defines the border width and line style of the VI.
Hide Overlap: Removes overlapping VIs from view.
Extend: Extends the VI length to the current candle.
Elongate: Fully extends the VI length to the right side of the chart.
⚡️ Showcase
Simple
Mitigated
Bordered
Consequent Encroachment
Extended
🚨 Alerts
This script provides alert options for all signals.
Bearish Signal
A bearish alert triggers when a red candlestick gaps below the previous body, signaling downward pressure.
Bullish Signal
A bullish alert triggers when a green candlestick gaps above the previous body, indicating upward momentum.
⚠️ Disclaimer
Trading involves significant risk, and many participants may incur losses. The content on this site is not intended as financial advice and should not be interpreted as such. Decisions to buy, sell, hold, or trade securities, commodities, or other financial instruments carry inherent risks and are best made with guidance from qualified financial professionals. Past performance is not indicative of future results.

Inversion Fair Value Gap Oscillator | Flux Charts💎 GENERAL OVERVIEW
Introducing the new Inversion Fair Value Gap Oscillator (IFVG Oscillator) indicator! This unique indicator identifies and tracks Inversion Fair Value Gaps (IFVGs) in price action, presenting them in an oscillator format to reveal market momentum based on IFVG strength. It highlights bullish and bearish IFVGs while enabling traders to adjust detection sensitivity and apply volume and ATR-based filters for more precise setups. For more information about the process, check the "📌 HOW DOES IT WORK" section.
Features of the new IFVG Oscillator:
Fully Customizable FVG & IFVG Detection
An Oscillator Approach To IFVGs
Divergence Markers For Potential Reversals
Alerts For Divergence Labels
Customizable Styling
📌 HOW DOES IT WORK?
Fair Value Gaps are price gaps within bars that indicate inefficiencies, often filled as the market retraces. An Inversion Fair Value Gap is created in the opposite direction once a FVG gets invalidated. The IFVG Oscillator scans historical bars to identify these gaps, then filters them based on ATR or volume. Each IFVG is marked as bullish or bearish according to the opposite direction of the original FVG that got invalidated.
An oscillator is calculated using recent IFVGs with this formula :
1. The Oscillator starts as 0.
2. When a new IFVG Appears, it contributes (IFVG Width / ATR) to the oscillator of the corresponding type.
3. Each confirmed bar, the oscillator is recalculated as OSC = OSC * (1 - Decay Coefficient)
The oscillator aggregates and decays past IFVGs, allowing recent IFVG activity to dominate the signal. This approach emphasizes current market momentum, with oscillations moving bullish or bearish based on IFVG intensity. Divergences are marked where IFVG oscillations suggest potential reversals. Bullish Divergence conditions are as follows :
1. The current candlestick low must be the lowest of last 25 bars.
2. Net Oscillator (Shown in gray line by default) must be > 0.
3. The current Bullish IFVG Oscillator value should be no more than 0.1 below the highest value from the last 25 bars.
Traders can use divergence signals to get an idea of potential reversals, and use the Net IFVG Oscillator as a trend following marker.
🚩 UNIQUENESS
The Inversion Fair Value Gap Oscillator stands out by converting IFVG activity into an oscillator format, providing a momentum-based visualization of IFVGs that reveals market sentiment dynamically. Unlike traditional indicators that statically mark IFVG zones, the oscillator decays older IFVGs over time, showing only the most recent, relevant activity. This approach allows for real-time insight into market conditions and potential reversals based on oscillating IFVG strength, making it both intuitive and powerful for momentum trading.
Another unique feature is the combination of customizable ATR and volume filters, letting traders adapt the indicator to match their strategy and market type. You can also set-up alerts for bullish & bearish divergences.
⚙️ SETTINGS
1. General Configuration
Decay Coefficient -> The decay coefficient for oscillators. Increasing this setting will result in oscillators giving the weight to recent IFVGs, while decreasing it will distribute the weight equally to the past and recent IFVGs.
2. Fair Value Gaps
Zone Invalidation -> Select between Wick & Close price for FVG Zone Invalidation.
Zone Filtering -> With "Average Range" selected, algorithm will find FVG zones in comparison with average range of last bars in the chart. With the "Volume Threshold" option, you may select a Volume Threshold % to spot FVGs with a larger total volume than average.
FVG Detection -> With the "Same Type" option, all 3 bars that formed the FVG should be the same type. (Bullish / Bearish). If the "All" option is selected, bar types may vary between Bullish / Bearish.
Detection Sensitivity -> You may select between Low, Normal or High FVG detection sensitivity. This will essentially determine the size of the spotted FVGs, with lower sensitivies resulting in spotting bigger FVGs, and higher sensitivies resulting in spotting all sizes of FVGs.
3. Inversion Fair Value Gaps
Zone Invalidation -> Select between Wick & Close price for IFVG Zone Invalidation.
4. Style
Divergence Labels On -> You can switch divergence labels to show up on the chart or the oscillator plot.
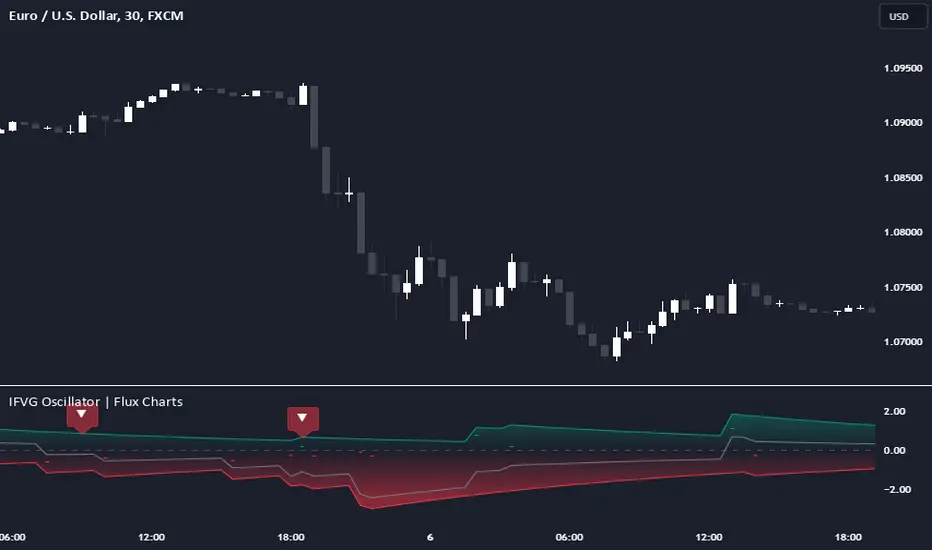
Inversion Fair Value Gap Screener | Flux Charts💎 GENERAL OVERVIEW
Introducing our new Inverse Fair Value Gap Screener! This screener can provide information about the latest Inverse Fair Value Gaps in up to 5 tickers. You can also customize the algorithm that finds the Inverse Fair Value Gaps and the styling of the screener.
Features of the new Inverse Fair Value Gap (IFVG) Screener :
Find Latest Inverse Fair Value Gaps Across 5 Tickers
Shows Their Information Of :
Latest Status
Number Of Retests
Consumption Percent
Volume
Customizable Algorithm / Styling
📌 HOW DOES IT WORK ?
A Fair Value Gap generally occur when there is an imbalance in the market. They can be detected by specific formations within the chart. An Inverse Fair Value Gap is when a FVG becomes invalidated, thus reversing the direction of the FVG.
IFVGs get consumed when a Close / Wick enters the IFVG zone. Check this example:
This screener then finds Fair Value Gaps across 5 different tickers, and shows the latest information about them.
Status ->
Far -> The current price is far away from the IFVG.
Approaching ⬆️/⬇️ -> The current price is approaching the IFVG, and the direction it's approaching from.
Inside -> The price is currently inside the IFVG.
Retests -> Retest means the price tried to invalidate the IFVG, but failed to do so. Here you can see how many times the price retested the IFVG.
Consumed -> IFVGs get consumed when a Close / Wick enters the IFVG zone. For example, if the price hits the middle of the IFVG zone, the zone is considered 50% consumed.
Volume -> Volume of a IFVG is essentially the volume of the bar that broke the original FVG that formed it.
🚩UNIQUENESS
This screener can detect latest Inverse Fair Value Gaps and give information about them for up to 5 tickers. This saves the user time by showing them all in a dashboard at the same time. The screener also uniquely shows information about the number of retests and the consumed percent of the IFVG, as well as it's volume. We believe that this extra information will help you spot reliable IFVGs easier.
⚙️SETTINGS
1. Tickers
You can set up to 5 tickers for the screener to scan Fair Value Gaps here. You can also enable / disable them and set their individual timeframes.
2. General Configuration
FVG Zone Invalidation -> Select between Wick & Close price for FVG Zone Invalidation.
IFVG Zone Invalidation -> Select between Wick & Close price for IFVG Zone Invalidation. This setting also switches the type for IFVG consumption.
Zone Filtering -> With "Average Range" selected, algorithm will find FVG zones in comparison with average range of last bars in the chart. With the "Volume Threshold" option, you may select a Volume Threshold % to spot FVGs with a larger total volume than average.
FVG Detection -> With the "Same Type" option, all 3 bars that formed the FVG should be the same type. (Bullish / Bearish). If the "All" option is selected, bar types may vary between Bullish / Bearish.
Detection Sensitivity -> You may select between Low, Normal or High FVG detection sensitivity. This will essentially determine the size of the spotted FVGs, with lower sensitivities resulting in spotting bigger FVGs, and higher sensitivities resulting in spotting all sizes of FVGs.

Fair Value Gap Screener | Flux Charts💎 GENERAL OVERVIEW
Introducing our new Fair Value Gap Screener! This screener can provide information about the latest Fair Value Gaps in up to 5 tickers. You can also customize the algorithm that finds the Fair Value Gaps and the styling of the screener.
Features of the new Fair Value Gap (FVG) Screener :
Find Latest Fair Value Gaps Accross 5 Tickers
Shows Their Information Of :
Latest Status
Number Of Retests
Consumption Percent
Bullish & Bearish Volume
Customizable Algoritm / Styling
📌 HOW DOES IT WORK ?
A Fair Value Gap generally occur when there is an imbalance in the market. They can be detected by specific formations within the chart. This screener then finds Fair Value Gaps accross 5 different tickers, and shows the latest information about them.
Status ->
Far -> The current price is far away from the FVG.
Approaching ⬆️/⬇️ -> The current price is approaching the FVG, and the direction it's approaching from.
Inside -> The price is currently inside the FVG.
Retests -> Retest means the price tried to invalidate the FVG, but failed to do so. Here you can see how many times the price retested the FVG.
Consumed -> FVGs get consumed when a Close / Wick enters the FVG zone. For example, if the price hits the middle of the FVG zone, the zone is considered 50% consumed.
Bullish / Bearish Volume -> Bullish & Bearish volume of a FVG is calculated by analyzing the bars that formed it. For example in a bullish FVG, the bullish volume is the total volume of the first 2 bars forming the FVG, and the bearish volume is the volume of the 3rd bar that forms it.
🚩UNIQUENESS
This screener can detect latest Fair Value Gaps and give information about them for up to 5 tickers. This saves the user time by showing them all in a dashboard at the same time. The screener also uniquely shows information about the number of retests and the consumed percent of the FVG, as well as it's bullish & bearish volume. We believe that this extra information will help you spot reliable FVGs easier.
⚙️SETTINGS
1. Tickers
You can set up to 5 tickers for the screener to scan Fair Value Gaps here. You can also enable / disable them and set their individual timeframes.
2. General Configuration
Zone Invalidation -> Select between Wick & Close price for FVG Zone Invalidation.
Zone Filtering -> With "Average Range" selected, algorithm will find FVG zones in comparison with average range of last bars in the chart. With the "Volume Threshold" option, you may select a Volume Threshold % to spot FVGs with a larger total volume than average.
FVG Detection -> With the "Same Type" option, all 3 bars that formed the FVG should be the same type. (Bullish / Bearish). If the "All" option is selected, bar types may vary between Bullish / Bearish.
Detection Sensitivity -> You may select between Low, Normal or High FVG detection sensitivity. This will essentially determine the size of the spotted FVGs, with lower sensitivies resulting in spotting bigger FVGs, and higher sensitivies resulting in spotting all sizes of FVGs.

Price Action Toolkit | Flux Charts💎 GENERAL OVERVIEW
Introducing our new Price Action Toolkit indicator! Price Action Toolkit integrates key level strategy , traditional supply-demand analysis , and market structures to help traders in their decisions. Now with features that are available to use in multiple timeframes!
Features of the new Price Action Toolkit indicator :
Volumized Fair Value Gaps (FVGs)
Volumized Order & Breaker Blocks
Identification of Market Structures
Equal Highs & Lows
Buyside & Sellside Liquidity
Premium & Discount Zones
MTF Highs & Lows (Daily, Weekly, Monthly, Pre-Market)
Customizable Settings
📌 HOW DOES IT WORK ?
We believe that the analytical elements that are within this indicator work best when they co-exist with each other on the chart. Trading often requires taking multiple elements into consideration for better accuracy on market analysis. Thus, we combined some of the useful strategies in one indicator for ease of use.
1. Volumized Fair Value Gaps
Fair value gaps often occur when there is an imbalance in the market, and can be spotted with a specific formation on the chart.
The volume when the FVG occurs plays an important role when determining the strength of it, so we've placed two bars on the FVG zone, indicating the high & low volumes of the FVG. The high volume is the total volume of the last two bars on a bullish FVG, while the low volume is - of the FVG. For a bearish FVG, the total volume of the last two bars is the low volume. The indicator can also detect FVGs that exist in other timeframes than the current chart.
2. Volumized Order Blocks
Order blocks occur when there is a high amount of market orders exist on a price range. It is possible to find order blocks using specific formations on the chart.
The high & low volume of order blocks should be taken into consideration while determining their strengths. The determination of the high & low volume of order blocks are similar to FVGs, in a bullish order block, the high volume is the last 2 bars' total volume, while the low volume is the oldest bar's volume. In a bearish order block scenerio, the low volume becomes the last 2 bars' total volume.
3. Volumized Breaker Blocks
Breaker blocks form when an order block fails, or "breaks". It is often associated with market going in the opposite direction of the broken order block, and they can be spotted by following order blocks and finding the point they get broken, ie. price goes below a bullish order block.
The volume of a breaker block is simply the total volume of the bar that the original order block is broken. Often the higher the breaking bar's volume, the stronger the breaker block is.
4. Market Structures
Sometimes specific market structures form and break as the market fills buy & sell orders. Formed Change of Character (CHoCH) and Break of Structure (BOS) often mean that market will change direction, and they can be spotted by inspecting low & high pivot points of the chart.
5. Equal Highs & Lows
Equal Highs & Lows occur when there is a significant amount of difference between a candle's close price and it's high / low value, and it happens again in a specific range. EQH and EQL usually mean there is a resistance that blocks the price from going further up / down.
6. Buyside & Sellside Liquidity
Buyside & Sellside Liquidity zones are where most traders place their take-profits and stop-losses in their long / short positions. They are spotted by using high & low pivot points on the chart.
7. Premium & Discount Zones
The premium zone is a zone that is over the fair value of the asset's price, and the discount zone is the opposite. They are formed by the latest high & low pivot points.
8. MTF Highs / Lows
MTF Highs / Lows are actually pretty self-explanatory, you can enable / disable Daily, Weekly, Monthly & Pre-Market Highs and Lows.
🚩UNIQUENESS
Our new indicator offers a comprehensive toolkit for traders, combining multiple analytical elements with customizable settings to aid in decision-making across different market conditions and timeframes. The volumetric information of both FVGs and Order & Breaker Blocks will be present in your chart to serve you greater detail about them. The indicator also efficiently identifies market structures, liquidity zones and premium & discount zones to give you an insight about the current state of the market. And finally with the use of multiple timeframes , you can easily take a look at the bigger picture. We recommend reading the "How Does It Work" section of the descripton to get a better understanding about how this indicator is unique to others.
⚙️SETTINGS
1. General Configuration
Show Historic Zones -> This will show historic Fair Value Gaps, Order & Breaker Blocks and Sellside & Buyside liquidities which are expired.
2. Fair Value Gaps
Enabled -> Enables / Disables Fair Value Gaps
Volumetric Info -> The volumetric information of the FVG Zones will be rendered if activated.
Zone Invalidation -> Select between Wick & Close price for FVG Zone Invalidation.
Zone Filtering -> With "Average Range" selected, algorithm will find FVG zones in comparison with average range of last bars in the chart. With the "Volume Threshold" option, you may select a Volume Threshold % to spot FVGs with a larger total volume than average.
FVG Detection -> With the "Same Type" option, all 3 bars that formed the FVG should be the same type. (Bullish / Bearish). If the "All" option is selected, bar types may vary between Bullish / Bearish.
Detection Sensitivity -> You may select between Low, Normal or High FVG detection sensitivity. This will essentially determine the size of the spotted FVGs, with lower sensitivies resulting in spotting bigger FVGs, and higher sensitivies resulting in spotting all sizes of FVGs.
3. Order Blocks
Enabled -> Enables / Disables Order Blocks
Volumetric Info -> The volumetric information of the Order Blocks will be rendered if activated.
Zone Invalidation -> Select between Wick & Close price for Order Block Invalidation.
Swing Length -> Swing length is used when finding order block formations. Smaller values will result in finding smaller order blocks.
4. Breaker Blocks
Enabled -> Enables / Disables Breaker Blocks
Volumetric Info -> The volumetric information of the Breaker Blocks will be rendered if activated.
Zone Invalidation -> Select between Wick & Close price for Breaker Block Invalidation.
5. Timeframes
You can set and enable / disable up to 3 timeframes. Note that only higher timeframes than the current chart will work.
6. Market Structures
Break Of Structure ( BOS ) -> If the current structure of the market is broken in a bullish or bearish direction, it will be displayed.
Change Of Character ( CHoCH ) -> If the market shifts into another direction, it will be displayed.
Change Of Character+ ( CHoCH+ ) -> This will display stronger Change Of Characters if enabled.
7. Equal Highs & Lows
EQH -> Enables / Disables Equal Highs.
EQL -> Enables / Disables Equal Lows.
ATR Multiplier (0.1 - 1.0) -> Determines the maximum difference between highs / lows to be considered as equal. Lower values will result in more accurate results.
8. Buyside & Sellside Liquidity
Zone Width -> Determines the width of the liquidity zones, 1 = 0.025%, 2 = 0.05%, 3 = 0.1%.
9. Premium & Discount Zones
Enabled -> Enables / Disables Premium & Discount Zones.
10. MTF Highs / Lows
You can enable / disable Daily, Weekly, Monthly & Pre-Market Highs and Lows using this setting. You can also switch their line shapes between solid, dashed and dotted.

Non-Repainting Awesome Oscillator[TV1ndicator]Non-Repainting Awesome Oscillator (NRAO) is an improved standard Awesome Oscillator
NRAO, unlike the built-in AO , does not repaint the values calculated on real-time bars when using an alternative timeframe .
The modification is based on the current version of the built-in Awesome Oscillator - 27.0
Comparison of AO and NRAO
In the following screenshot AO(gaps on), AO(gaps off), NRAO\ (non-repainting off), NRAO(non-repainting on) , the chart timeframe is 1 minute, and the indicator timeframe is 10 minutes:
Starting from 9:17, the chart worked in real time.
The following screenshot shows the same indicators for the same period, but after refreshing the page at 10:21:
The repainting of the built-in AO's minute-to-minute data when the "Wait for timeframe closes" option is turned off is obvious.
Even turning on the "Wait for timeframe closes" option, which in theory should prevent repainting, does not help. On historical data, the value is calculated at the close of the bar of an alternative timeframe, and is displayed at 9, 19, 29,39,... minutes of the chart.
On real data, the AO value is calculated at the close of the first bar of the chart timeframe, the opening of which coincides with the opening of a bar of an alternative timeframe, and is displayed at 10, 20, 30, 40,... minutes of the chart.
In addition, AO displays a value on the first real-time bar, which will disappear if you refresh the page after some time.
NRAO(non-repainting off) works similarly to AO(gaps off).
NRAO(non-repainting on) calculates and displays values in the same way both in history and in real time.
P.S. I publish this indicator in order to describe the problem using its example. The vast majority of built-in indicators are subject to such repaint. Unfortunately, sometimes repaint can lead to an erroneous trading decision. Not only beginners, but sometimes even experienced traders face this problem. Over many years of practice, I have repeatedly encountered situations where my clients were disappointed in their strategies as soon as they realized that standard indicators on alternative timeframes were repainting, and the strategy I wrote using indicators without repainting did not work quite as they expected.
I hope this example will help in the future to avoid unnecessary mistakes when using built-in indicators on alternative timeframes.
If you find this modification useful for other built-in indicators, write what other indicators without repainting you would like to see.
Non-Repainting Awesome Oscillator (NRAO) - это усовершенствованный стандартный Awesome Oscillator
NRAO в отличии от встроенного AO не перерисовывает значения, рассчитанные на барах реального времени при использовании альтернативного таймфрейма.
За основу модификации взята актуальная версия встроенного Awesome Oscillator - 27.0
Сравнение работы AO и NRAO
На следующем скриншоте отображены AO(gaps on), AO(gaps off), NRAO(non-repainting off), NRAO(non-repainting on) на таймфрейме графика 1 минута, и таймфрейме индикаторов 10 минут:
Начиная с 9:17 график работал в реальном времени.
На следующем скриншоте отображены те же индикаторы за тот же период, только после обновления страницы в 10:21:
Перерисовка ежеминутных данных встроенного AO при выключенной опции "Дождаться закрытия интервала" видна сразу.
Даже включение опции "Дождаться закрытия интервала", которая по идее должна была бы исключить перерисовку, не избавляет встроенный AO от неё. На исторических данных значение рассчитывается на закрытии бара альтернативного таймфрейма, и отображается на 9, 19, 29,39,... минутах графика.
На реальных данных значение AO рассчитывается на закрытии первого бара таймфрейма графика, открытие которого совпадает с открытием бара альтернативного таймфрейма, и отображается на 10, 20, 30, 40,... минутах графика.
Кроме того AO отображает значение на первом баре реального времени, которое не будет отображено, если обновить страницу спустя некоторое время.
NRAO(non-repainting off) работает аналогично AO(gaps off).
NRAO(non-repainting on) рассчитывает и отображает значения одинаково как на истории, так в реальном времени.
P.S. Я публикую этот индикатор для того, чтобы на его примере описать проблему. Подобной перерисовке подвержено абсолютное большинство встроенных индикаторов. К сожалению, иногда подобная перерисовка может привести к ошибочному торговому решению. С этой проблемой сталкиваются не только новички, но иногда и бывалые трейдеры. За многолетнюю практику я не один раз сталкивался с ситуациями, когда мои клиенты были разочарованы в своих стратегиях, как только они понимали, что стандартные индикаторы на альтернативных таймфреймах иногда перерисовываются, и написанная мной стратегия с использованием индикаторов без перерисовки работает не совсем так как они ожидали. Искренне надеюсь, что этот пример поможет вам в будущем избежать лишних ошибок при использовании встроенных индикаторов на альтернативных таймфреймах.
Если вы считаете полезным такую доработку для других встроенных индикаторов, пишите в отзывах какие еще индикаторы без перерисовки вы бы хотели видеть.

Gap Trading Strategy: CME BitcoinI created a strategy which finds gaps on CME Futures market for Bitcoin, BTC1! and opens a long or short position on the crypto exchange depending on what kind of gap was found (up or down) on CME.
Up gap: today open price > previous day high price
Down gap: today open price < previous day low price
Two lines below the main chart show when gaps appear. The green line represents the size of up gaps, when it crosses zero it gives a long signal. The red line - represents the size of down gaps, when it crosses zero - short signal.
Instead of having to look between multiple charts, this simply overlays the past weeks open and close should a gap appear.
Usage:
Strategy flips long / short depending of indicator signals. It could cut the position by stop loss or take profit.
Features:
ability to set stop loss and take profit in %
ability to set delta for gaps (if you want to filter small ones)
ability to choose strategy type. Standart: Long Up/Short Down || Inverse: Short Up/Long Down.
Backtesting:
Backtested on BTCPERP ( FTX ) and XBTUSD (Bitmex).
It shows a low drawdown, a small number of trades and 50% of profit for the 2020.
For example, I set high delta for down gaps to filter small ones
Strategy doesn't repaint.

CME Bitcoin Gap Finder Orderblock Support ResistanceCME Bitcoin Gap Finder Orderblock Support Resistance
Intro
I had a backlog of scripts to release, and so everyone is getting some Christmas gifts early!
I have been watching CME gaps and how they relate to BTC for over a year now. I find they make good orderblock support/resistance areas.
Description
There is a limitation to how many lines I can draw with the new pine script functions. So for instance if you want to see the gaps from 2018 I have included a date range selector (similar to how a backtest works). This way you can only display the gaps from the dates ranges you want to see.
There's also the ability to check for gaps on the daily, 12h, 4h, and 1h charts. I recommend using 12H. But know that depending on what period you choose it will effect the size of the gaps, so experiment and see what works for you.
Lastly I included the ability to have background highlights whenever CME is closed on the weekend, just for visual reference.
You can use this indicator on any BTC ticker, and it will show you where the CME gaps are (without having to switch/reference the CME chart).
👍 We hope you enjoyed this indicator and find it useful! We post free crypto analysis, strategies and indicators regularly. This is our 74th script on Tradingview!
💬Check my Signature for other information
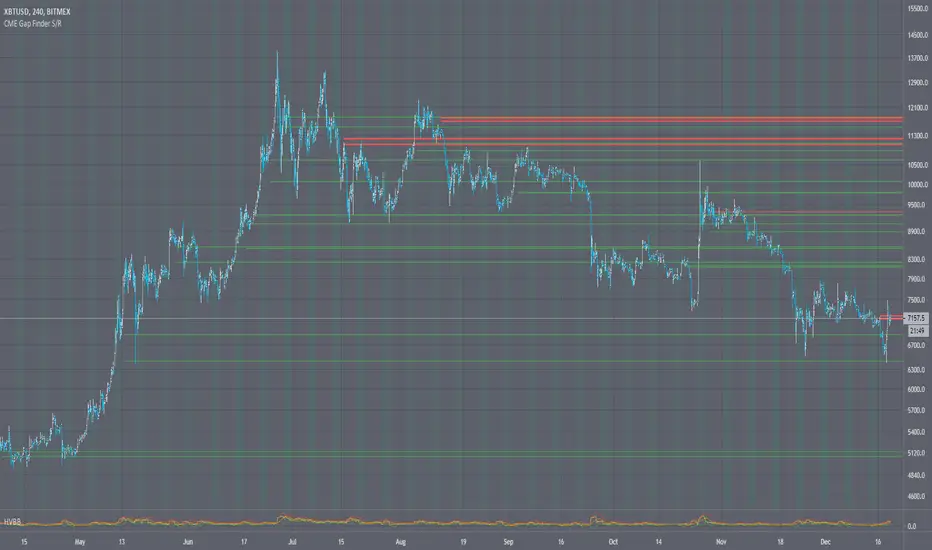
Fair Value Gap [Tradeuminati]Fair Value Gap
Fair Value Gap is a clean and rule-based Fair Value Gap indicator for TradingView, designed to display only valid and confirmed Fair Value Gaps (FVGs) and Inverted Fair Value Gaps (iFVGs).
The indicator is built on a strict 3-candle FVG definition and operates exclusively on candle close, ensuring no repainting and no premature signals.
🔹 Key Features
Valid Fair Value Gaps (FVG)
- Detects bullish and bearish Fair Value Gaps using a precise 3-candle structure
- FVGs are only plotted after the confirming candle has closed
- A Fair Value Gap remains visible only as long as it is valid
- Once price closes beyond the FVG, it is removed or converted
Inverted Fair Value Gaps (iFVG)
- When a valid FVG is invalidated by a candle close, it can be converted into an iFVG
- iFVGs retain the original price range and structure
- Only valid iFVGs are displayed
- As soon as price closes through an iFVG, it is automatically removed
Clean & Controlled Visualization
- Only the last N active FVGs are displayed (bullish + bearish combined)
- Only the last N valid iFVGs are shown
- Boxes automatically extend to the current price + configurable bars
- Labels are dynamically positioned at the right edge of each zone
🔹 Technical Notes
- No repainting
- No intrabar signals
- Close-based validation only
- Works on all markets and timeframes
- Lightweight and performance-friendly
⚠️ Disclaimer
This indicator is for technical analysis purposes only and does not constitute trading or investment advice.

IFVGs [NINE]Overview
The IFVG Indicator is a precision-engineered tool designed to identify and display Inversion Fair Value Gaps (IFVGs), a powerful price action concept rooted in ICT (Inner Circle Trader) methodology. This indicator automatically detects when price closes through an existing Fair Value Gap, causing the zone to "invert" and flip its directional bias, signaling potential areas of institutional interest for future price reactions.
What is an Inversion Fair Value Gap?
A Fair Value Gap (FVG) is a three-candle pattern where a gap exists between the wicks of the first and third candles, representing an imbalance in price delivery. These zones often act as magnets for price to return and "fill" the inefficiency.
An Inversion Fair Value Gap (IFVG) occurs when price doesn't just tap into an FVG, it closes through it with a candle body. This "inversion" transforms the zone:
A Bullish FVG that gets closed through becomes a Bearish IFVG (potential resistance/supply zone)
A Bearish FVG that gets closed through becomes a Bullish IFVG (potential support/demand zone)
IFVGs represent areas where the market has shown its hand — institutional order flow has aggressively moved through a prior inefficiency, and the inverted zone now becomes a point of interest for potential reversals or continuations.
Key Features
Automatic IFVG Detection
The indicator continuously monitors for Fair Value Gaps and automatically converts them to IFVGs when price body closes through the zone. No manual identification required.
Multiple Display Styles
Choose from four distinct visualization modes to match your chart aesthetic:
Level — Clean, minimal single line at the IFVG extreme (top for bullish, bottom for bearish)
Normal — Filled zone with dashed borders and dot label
Minimalist — High/low boundary lines with connecting link
Classic — Filled box with 50% midline only
Full Customization
Independent colors for bullish and bearish IFVGs
Adjustable transparency for zone fills
Optional 50% midline (Consequent Encroachment level)
Flexible label styles: "IFVG" or "+/−" notation
Multiple label sizes: Tiny, Small, Normal, Large
Smart Extension Options
Extend to Current Bar — Zones dynamically extend as price progresses
Extend to Confirmation — Zones end at the bar where inversion occurred
Manual Offset — Fine-tune extension length in bars
Clustered IFVG Filter
Prevents chart clutter by ensuring only one IFVG per direction forms within a 5-bar cooldown period. When a single candle closes through multiple FVGs, only the first IFVG of that directional series is displayed — eliminating redundant signals and keeping your chart clean.
FVG Lookback Control
Limit which FVGs can become IFVGs based on their age. Options include 10, 50, 100, 200, or 300 bars. This filters out old, stale FVGs that may create less relevant inversions.
Session Time Filters
Optional time-based filtering allows you to focus on specific trading sessions:
Configurable session windows (e.g., 9:30 AM - 12:00 PM)
Support for two independent session filters
Multiple timezone options including New York, London, Tokyo, and more
Volume Imbalance Detection
Optionally include Volume Imbalances (VIs) — gaps between candle bodies rather than wicks — expanding the scope of detectable inefficiencies.
Invalidation Tracking
IFVGs are automatically invalidated when price closes back through the zone in the opposite direction, with optional display of invalidated zones.
How to Use
Entry Confirmation
IFVGs serve as areas for trade entries. When price returns to a confirmed IFVG:
Bullish IFVG — Look for long entries as price taps the zone from above
Bearish IFVG — Look for short entries as price taps the zone from below
Settings Reference
Inversion Fair Value Gaps
Show IFVGs? — Master toggle for IFVG display
Style — Level, Normal, Minimalist, or Classic
Transparency % — Zone fill opacity (0-100)
Historical Display — Maximum IFVGs to show per direction
Bullish/Bearish Colors — Independent color selection
Show Invalidated? — Display IFVGs that have been invalidated
Extend IFVGs? — Enable dynamic zone extension
Extension Mode — Current Bar or Confirmation
Manual Offset — Additional bars to extend
High/Low Lines — Show boundary lines (Minimalist style)
50% Midline — Show Consequent Encroachment level
Show Labels? — Display zone labels
Label Style — IFVG or +/− notation
FVG Lookback — Maximum age of FVGs that can invert
Clustered Filter — Prevent multiple same-direction IFVGs in quick succession
Volume Imbalances — Include body gaps in detection
Session Filters
Enable 1st/2nd Time Filter — Activate session filtering
Session Times — Define active trading windows
Timezone — Reference timezone for session calculations
Disclaimer
This indicator is provided for educational and informational purposes only. It is not financial advice, and nothing contained herein constitutes a recommendation, solicitation, or offer to buy or sell any securities, options, or other financial instruments.
Trading involves substantial risk of loss and is not suitable for all investors. Past performance is not indicative of future results. You should carefully consider your investment objectives, level of experience, and risk appetite before making any trading decisions.
The developer of this indicator makes no representations or warranties regarding the accuracy, completeness, or reliability of the information provided. You are solely responsible for your own trading decisions and any profits or losses that may result.
Always conduct your own research and consider seeking advice from a licensed financial professional before trading.

FVG & IFVG MTF Detector [Alphaomega18]TITLE:
FVG & IFVG Multi-Timeframe Detector
SHORT DESCRIPTION:
Automatic Fair Value Gap (FVG) and Inverse Fair Value Gap (IFVG) detector with multi-timeframe analysis and automatic gap fill closure.
FULL DESCRIPTION:
📊 OVERVIEW
This indicator automatically detects Fair Value Gaps (FVG) and Inverse Fair Value Gaps (IFVG) on your current timeframe and up to 12 additional timeframes simultaneously. Perfect for confluence analysis and identifying institutional zones.
🎯 KEY FEATURES
✅ Multi-Timeframe Detection:
• 12 available timeframes: 1min, 2min, 5min, 10min, 15min, 30min, 1H, 2H, 4H, Daily, Weekly, Monthly
• Each timeframe with customizable color
• Timeframe labels positioned on the right of boxes
✅ Automatic Closure:
• FVGs automatically close when price fills the gap
• Option to disable for traditional fixed extension
• Smart midline management
✅ Complete Customization:
• Customizable colors for each timeframe
• Configurable label size, position, and style
• Gap size display options (separate for current TF and MTF)
• Transparent or colored labels for MTF
• Customizable borders and midlines
✅ Filters & Controls:
• Filter by minimum gap size
• Maximum boxes per timeframe
• Configurable box extension (5-100 bars)
• Border styles: Solid, Dashed, Dotted
✅ Integrated Dashboard:
• Active FVG/IFVG counter
• Statistics per timeframe
• Customizable position
📈 USAGE
1. **Timeframe Activation**:
- Go to Settings > Multi-Timeframe
- Check the timeframes you want to analyze
- Customize colors for each timeframe
2. **Display Configuration**:
- Settings > Display: control labels and their content
- "Transparent MTF Labels": displays only timeframe text without colored background
- "Show Gap Size": separate options for current TF and MTF
3. **Automatic Closure**:
- Settings > Filters > "Close FVG when Filled": enable to automatically close filled gaps
- Disable for traditional fixed extension
4. **Filtering**:
- "Min Gap Size": filter out insignificant small gaps
- "Max Boxes": control the number of FVGs displayed per timeframe
🔍 INTERPRETATION
• **Bullish FVG (🟢)**: Bullish gap - potential support zone
• **Bearish IFVG (🔴)**: Bearish gap - potential resistance zone
• **MTF Confluences**: Multiple FVGs from different timeframes at the same level = strong institutional zone
⚙️ TECHNICAL PARAMETERS
• Detection: low > high (bullish) | high < low (bearish)
• Max boxes per timeframe: 500
• Max lines: 500
• Automatic memory management (old FVG deletion)
🎨 ADVANCED CUSTOMIZATION
• Separate background and border colors
• 4 label sizes: Tiny, Small, Normal, Large
• 3 label positions for current TF: Left, Center, Right
• MTF labels always positioned right for clarity
• Optional midlines with customizable style and color
💡 USAGE TIPS
1. Start with 2-3 timeframes maximum to avoid visual overload
2. Use contrasting colors to easily differentiate timeframes
3. Daily/Weekly gaps are perfect for identifying major institutional zones
4. Combine with your price action strategy for precise entries
5. Automatic closure helps identify when a zone is invalidated
📊 IDEAL FOR
• ICT Traders (Inner Circle Trader)
• Scalping & Day Trading
• Swing Trading
• Institutional zone analysis
• Multi-timeframe confluence trading
🔔 ALERTS
Configurable alerts for:
• New Bullish FVG detected
• New Bearish IFVG detected
---
© 2024 Alphaomega18 - All rights reserved
License: Mozilla Public License 2.0

Ind-Suite: The Ultimate Strategic Dashboard [Gap/Dow/MA/SR]概要 Ind-Suiteは、トレードに必要な4つの重要な要素(窓、市場構造、移動平均線、水平線)を1つのインジケーターに統合した包括的なトレーディング・スイートです。 このツールの目的は、単一のサインに頼るのではなく、複数の根拠が重なる「コンフルエンス(Confluence)」を視覚的に発見することにあります。
機能モジュール 設定画面の「⚡ MODULE TOGGLES ⚡」から、各モジュールのON/OFFを瞬時に切り替えられます。
Module A: Gaps (窓)
未埋めの窓(Gap)をボックスで表示します。
価格が引き寄せられるターゲットとして機能します。一定期間経過した窓は自動的に非表示になります。
Module B: Dow Structure (ダウ理論と構造)
ZigZagラインによる波の描画と、トレンド状態の判定。
BOS (Break of Structure): トレンド継続のブレイクポイントにラベルを表示。
下落トレンド時は背景色が変化し、視覚的にトレンドを把握できます。
Module C: Safe Scaffold (足場と勢い)
EMA (9/20) & VWAP: トレンドフォローのための主要な移動平均線。
Bollinger Bands: ボラティリティの確認用(ON/OFF可能)。
Signal: EMAクロスとバンド幅拡大(スクイーズからのエクスパンション)を検知したロングサインを表示。
Module D: S/R Guardian (水平線)
過去のPivot点をベースに、意識されやすいサポート・レジスタンスラインを自動描画します。
強度に基づいてラインが統合され、重要度が高い価格帯を可視化します。
推奨される使い方 すべてのモジュールを常にONにする必要はありません。チャートが情報過多にならないよう、必要な機能だけを選択して表示してください。 例えば、「S/Rライン」での反発、「Dow Structure」でのBOS、「Gap」の埋め完了など、3つ以上の根拠が重なるポイントは、優位性の高いエントリーポイントとなります。
--------------
Overview Ind-Suite is a comprehensive trading suite that integrates four essential elements (Gaps, Market Structure, Moving Averages, and Support/Resistance) into a single indicator. The goal of this tool is not to rely on a single signal, but to visually identify "Confluence" where multiple factors align.
Feature Modules You can instantly toggle each module ON/OFF via the "⚡ MODULE TOGGLES ⚡" in the settings.
Module A: Gaps
Highlights unclosed gaps with boxes.
These act as price magnets/targets. Old gaps are automatically hidden after a set period.
Module B: Dow Structure (Trend & Market Structure)
Draws ZigZag waves and determines trend status based on pivot points.
BOS (Break of Structure): Labels are displayed at key breakout points confirming trend continuation.
Background color changes during downtrends for instant visual recognition.
Module C: Safe Scaffold (Momentum & MAs)
EMA (9/20) & VWAP: Key moving averages for trend following.
Bollinger Bands: For volatility analysis (Toggle available).
Signal: Displays Long signals upon EMA crossover combined with BBW expansion (volatility breakout).
Module D: S/R Guardian (Support & Resistance)
Automatically draws S/R zones based on historical pivot points.
Levels are merged based on proximity, visualizing significant price zones.
Recommended Usage It is not necessary to keep all modules ON at all times. Toggle features as needed to keep your chart clean. High-probability setups are often found where multiple factors converge (Confluence). For example: A bounce off an "S/R Line," confirmed by a "BOS" in Dow Structure, coinciding with a "Gap" fill.

One for AllOne for All (OFA) - Complete ICT Analysis Suite
Version 3.3.0 by theCodeman
📊 Overview
One for All (OFA) is a comprehensive TradingView indicator designed for traders who follow Inner Circle Trader (ICT) concepts. This all-in-one tool combines essential ICT analysis features—sessions, kill zones, previous period levels, and higher timeframe candles with Fair Value Gaps (FVGs) and Volume Imbalances (VIs)—into a single, highly customizable indicator. Whether you're a beginner learning ICT concepts or an experienced trader refining your edge, OFA provides the visual structure needed for precise market analysis and execution.
✨ Key Features
- 🏷️ Customizable Watermark**: Display your trading identity with customizable titles, subtitles, symbol info, and full style control
- 🌍 Trading Sessions**: Visualize Asian, London, and New York sessions with high/low lines, range boxes, and open/close markers
- 🎯 Kill Zones**: Highlight 5 critical ICT kill zones with precise timing and visual boxes
- 📈 Previous Period H/L**: Track Daily, Weekly, and Monthly highs/lows with customizable styles and lookback periods
- 🕐 Higher Timeframe Candles**: Display up to 5 HTF timeframes with OHLC trace lines, timers, and interval labels
- 🔍 FVG & VI Detection**: Automatically detect and visualize Fair Value Gaps and Volume Imbalances on HTF candles
- ⚙️ Universal Timezone Support**: Works globally with GMT-12 to GMT+14 timezone selection
- 🎨 Full Customization**: Control colors, styles, visibility, and layout for every feature
🚀 How to Use
Watermark Setup
The watermark overlay helps you identify your charts and maintain focus on your trading principles:
1. Enable/disable watermark via "Show Watermark" toggle
2. Customize the title (default: "Name") to display your trading name or account identifier
3. Set up to 3 subtitles (default: "Patience", "Confidence", "Execution") as trading reminders
4. Choose position (9 locations available), size, color, and transparency
5. Toggle symbol and timeframe display as needed
Use Case: Display your trading principles or account name for multi-monitor setups or content creation.
Trading Sessions Analysis
Sessions define market character and liquidity availability:
1. Enable "Show All Sessions" to visualize all three sessions
2. Adjust timezone to match your local market (default: UTC-5 for EST)
3. Customize session times if needed (defaults cover standard hours)
4. Enable session range boxes to see consolidation zones
5. Use session high/low lines to identify key levels for the current session
6. Enable open/close markers to track session transitions
Use Case: Identify which session you're trading in, track session highs/lows for liquidity, and anticipate session transition volatility.
Kill Zones Trading
Kill zones are ICT's high-probability trading windows:
1. Enable individual kill zones or use "Show All Kill Zones"
2. **Asian Kill Zone** (2000-0000 GMT): Early positioning and smart money accumulation
3. **London Kill Zone** (0300-0500 GMT): European market opening volatility
4. **NY AM Kill Zone** (0930-1100 EST): Post-NYSE open expansion
5. **NY Lunch Kill Zone** (1200-1300 EST): Midday consolidation or manipulation
6. **NY PM Kill Zone** (1330-1600 EST): Afternoon positioning and closes
7. Customize colors and times to match your trading style
8. Set max days display to control historical visibility (default: 30 days)
Use Case: Focus entries during high-probability windows. Watch for liquidity sweeps at kill zone openings and institutional positioning.
Previous Period High/Low Levels
Previous period levels act as magnetic price targets and support/resistance:
1. Enable Daily (PDH/PDL), Weekly (PWH/PWL), or Monthly (PMH/PML) levels individually
2. Set lookback period (how many previous periods to display)
3. Choose line style: Solid (current emphasis), Dashed (standard), or Dotted (subtle)
4. Customize colors per timeframe for visual hierarchy
5. Adjust line width (1-5) for visibility preference
6. Enable gradient effect to fade older periods
7. Position labels left or right based on chart layout
8. Customize label text for your preferred notation
Use Case: Identify key levels where price is likely to react. Daily levels work on intraday timeframes, Weekly on daily charts, Monthly for swing trading.
Higher Timeframe (HTF) Candles
HTF candles reveal the larger market context while trading lower timeframes:
1. Enable up to 5 HTF slots simultaneously (default: 5m, 15m, 1H, 4H, Daily)
2. Choose display mode: "Below Chart" (stacked rows) or "Right Side" (compact column)
3. Customize timeframe, colors (bull/bear), and titles for each slot
4. **OHLC Trace Lines**: Visual lines connecting HTF candle levels to chart bars
5. **HTF Timer**: Countdown showing time remaining until HTF candle close
6. **Interval Labels**: Display day of week (Daily+) or time (intraday) on each candle
7. For Daily candles: Choose open time (Midnight, 8:30, 9:30) to match your market structure preference
Use Case: Trade lower timeframes while respecting higher timeframe structure. Watch for HTF candle closes to confirm directional bias.
FVG & VI Detection
Fair Value Gaps and Volume Imbalances highlight inefficiencies that price often revisits:
1. **Fair Value Gaps (FVGs)**: Detected when HTF candle wicks don't overlap between 3 consecutive candles
- Bullish FVG: Gap between candle 1 high and candle 3 low (green box by default)
- Bearish FVG: Gap between candle 1 low and candle 3 high (red box by default)
2. **Volume Imbalances (VIs)**: Similar detection but focuses on body gaps
- Bullish VI: Gap between candle 1 close and candle 3 open
- Bearish VI: Gap between candle 1 open and candle 3 close
3. Enable FVG/VI detection per HTF slot individually
4. Customize colors and transparency for each imbalance type
5. Boxes appear on chart at formation and remain visible as retracement targets
**Use Case**: Identify high-probability retracement zones. Price often returns to fill FVGs and VIs before continuing the trend. Use as entry zones or profit targets.
🎨 Customization
OFA is built for flexibility. Every feature includes extensive customization options:
Visual Customization
- **Colors**: Independent color control for every element (sessions, kill zones, lines, labels, FVGs, VIs)
- **Transparency**: Adjust box and label transparency (0-100%) for clean charts
- **Line Styles**: Choose Solid, Dashed, or Dotted for previous period lines
- **Sizes**: Control text size, line width, and box borders
- **Positions**: Place watermark in 9 positions, labels left/right
Layout Control
- **HTF Display Mode**: "Below Chart" for detailed analysis, "Right Side" for space efficiency
- **Drawing Limits**: Set max days for sessions/kill zones to manage chart clutter
- **Lookback Periods**: Control how many previous periods to display (1-10)
- **Gradient Effects**: Enable fading for older previous period lines
Timing Adjustments
- **Timezone**: Universal GMT offset selector (-12 to +14) for global markets
- **Session Times**: Customize each session's start/end times
- **Kill Zone Times**: Adjust kill zone windows to match your market's characteristics
- **Daily Open**: Choose Midnight, 8:30, or 9:30 for Daily HTF candle open time
💡 Best Practices
1. Start Simple: Enable one feature at a time to learn how each element affects your analysis
2. Match Your Timeframe: Use Daily levels on intraday charts, Weekly on daily charts, HTF candles one or two levels above your trading timeframe
3. Kill Zone Focus: Concentrate your trading activity during kill zones for higher probability setups
4. HTF Confirmation: Wait for HTF candle closes before committing to directional bias
5. FVG/VI Entries: Look for price to return to unfilled FVGs/VIs for entry opportunities with favorable risk/reward
6. Customize Colors: Use a consistent color scheme that matches your chart theme and reduces visual fatigue
7. Reduce Clutter: Disable features you're not actively using in your current trading plan
8. Session Context: Understand which session controls the market—trade with session direction or anticipate reversals at session transitions
⚙️ Settings Guide
OFA organizes settings into logical groups for easy navigation:
- **═══ WATERMARK ═══**: Title, subtitles, position, style, symbol/timeframe display
- **═══ SESSIONS ═══**: Enable/disable sessions, times, colors, high/low lines, boxes, markers
- **═══ KILL ZONES ═══**: Individual kill zone toggles, times, colors, max days display
- **═══ PREVIOUS H/L - DAILY ═══**: Daily high/low lines, style, color, lookback, labels
- **═══ PREVIOUS H/L - WEEKLY ═══**: Weekly high/low lines, style, color, lookback, labels
- **═══ PREVIOUS H/L - MONTHLY ═══**: Monthly high/low lines, style, color, lookback, labels
- **═══ HTF CANDLES ═══**: Global display mode, layout settings
- **═══ HTF SLOT 1-5 ═══**: Individual HTF configuration (timeframe, colors, title, FVG/VI detection, trace lines, timer, interval labels)
Each setting includes tooltips explaining its function. Hover over any input for detailed guidance.
📝 Final Notes
One for All (OFA) represents a complete ICT analysis toolkit in a single indicator. By combining watermark customization, session visualization, kill zone highlighting, previous period levels, and higher timeframe candles with FVG/VI detection, OFA eliminates the need for multiple indicators cluttering your chart.
**Version**: 3.3.0
**Author**: theCodeman
**Pine Script**: v6
**License**: Mozilla Public License 2.0
Start with default settings to learn the indicator's structure, then customize extensively to match your personal trading style. Remember: tools provide information, but your edge comes from disciplined execution of a proven strategy.
Happy Trading! 📈

Gold 1&5 Min Trading Strategy [TradingFinder] XAU Scalper Signal🔵 Introduction
Scalping in financial markets is based on immediate price reactions and precise analysis of price action behavior. In this trading approach, the trader must identify signals that originate directly from market structure, momentum shifts, candlestick formations, and the position of price relative to key zones.
Supply and demand areas serve as the primary regions of order concentration and form the foundation of scalping analysis, since they provide the most accurate representation of balance or imbalance between buyers and sellers as well as the active flow of liquidity in the market.
In demand zones, price reactions usually begin with the formation of reversal or continuation candlestick patterns. These patterns include structures such as Pin Bar, Engulfing, Doji, Failure, Rejection, and other forms of false breakout behavior, each of which can indicate a potential short term change in direction.
Liquidity plays a central role in these reactions, because price entering a demand zone typically coincides with the absorption of sell side liquidity and the restoration of order flow. This process often leads to rapid movements that are suitable for scalping. Therefore, combining candlestick confirmation with the location of price inside a supply or demand zone is one of the most reliable methods of identifying low risk scalping signals.
Demand zones include several structural variations, each representing a different form of liquidity behavior. One of the most well known examples is the order block, which is the final bearish candle before a strong bullish movement and indicates the presence of unfilled buy side interest.
Another important structure is the Fair Value Gap, which appears when a price void forms across three consecutive candles due to a lack of liquidity during the moment of displacement. The market often returns to this area to restore balance. Imbalance structures also represent one sided pressure in order flow where the market reacts later to correct these inefficiencies.
Breaker structure is another key element in demand analysis. A breaker is formed when an order block is violated and price returns to the same level after collecting liquidity, then continues in the opposite direction. This pattern often appears near liquidity based highs or lows and reflects a shift in the strength of market participants.
Together, order blocks, Fair Value Gaps, imbalances, and breakers form the core of demand analysis in price action and are widely used in precise scalping strategies due to their strong connection with liquidity and the high predictability of price reactions within them.
Bullish Setup :
Bearish Setup :
🔵 How to Use
This strategy is built on price action analysis, market reactions inside supply and demand zones, and confirmation through candlestick patterns. The first step is to identify key areas such as order blocks, Fair Value Gaps, imbalances, or breakers.
After these zones are located, price behavior within them is examined using candlestick structure and momentum direction. Entries are taken only when price reaches a validated zone, a clear sign of liquidity absorption or injection appears, and a confirming candlestick forms inside the zone.
This approach allows the trader to capture fast and precise entries during moments when the market is actively reacting to decision points.
🟣 Long Setup
In the buy setup, a valid demand zone must first be identified. This can be a bullish order block, an unfilled bullish Fair Value Gap, an imbalance at the lower part of structure, or a bullish breaker. When price enters this zone and shows signs of absorbing sell side liquidity, candlestick behavior must be examined.
Formation of reversal signals such as a Pin Bar with a long lower wick, bullish Engulfing, Rejection Candle, or a false breakout of the low, indicates a favorable shift in order flow. After receiving candlestick confirmation, a buy entry is taken within the same zone and the stop level is placed below the liquidity boundary. Targets are typically based on filling gaps, reaching supply zones, or returning to structural means.
🟣 Short Setup
In the sell setup, a valid supply zone must be recognized. This may include a bearish order block, a bearish Fair Value Gap, an imbalance at the upper part of structure, or a bearish breaker. When price enters this zone and liquidity accumulates above nearby highs, the probability of a fast momentum shift increases.
Confirmation occurs when a bearish reversal pattern forms such as Engulfing, Pin Bar with a long upper wick, indecisive Doji followed by rejection, or a false breakout of the high. After confirmation, the sell entry is placed and the stop level is set above the liquidity zone. Targets are selected based on filling lower Fair Value Gaps, reaching demand zones, or returning to structural midpoints.
🔵 Settings
Last Candle in Signal Direction : When On, a signal is issued only if the last candle moves in the direction required by the signal.
Signal in Nearly Zone : When enabled, the signal becomes valid even if the candle is near the zone rather than strictly inside it. When disabled, only signals formed inside the zone are allowed.
Allow Both Side Signals : When On, signals from both sides of the structure can be issued even if a limiting level exists. When disabled, only signals that do not violate the limiting level are allowed.
🔵 Conclusion
Using price action, supply and demand zones, and candlestick confirmation alongside liquidity analysis creates an effective framework for identifying fast market reactions in scalping conditions. Focusing on structures such as order blocks, Fair Value Gaps, imbalances, and breakers allows the trader to recognize shifts in momentum and changes in order flow with greater precision.
In this approach, entries are taken only when price reaches a validated zone, liquidity behavior is observable, and the confirming candle forms at the correct location. This leads to organized, low risk scalping signals that are aligned with the real time behavior of the market.

IndiAllsIndiAlls is a versatile overlay indicator designed for traders analyzing market structure, sessions, and key level. It combines several popular tools into one script, including session highs/lows, fair value gaps (FVG), macro time trackers, RSI dashboards, displacement detection, engulfing candles, and various line drawings (e.g., midnight opens, vertical lines). This indicator is intended for educational and analytical purposes, helping users visualize potential support/resistance levels, gaps, and momentum across timeframes.
Key Features
Session Highs/Lows: Tracks and draws lines for Asian and London sessions, previous day/week, and pre-market highs/lows. Lines extend until mitigated by price, with optional labels.
Midnight and 8:30 Open Lines: Plots customizable lines at midnight and 8:30 AM (America/New_York time) with styles (solid, dotted, dashed) and history options.
Fair Value Gaps (FVG): Detects bullish/bearish gaps based on a threshold percentage, draws extendable boxes, and removes them when filled (mitigated).
Macro Time Tracker: Highlights specific 20-minute "macro" windows (e.g., 8:50-9:10 AM) with lines and labels, optimized for 15-minute charts, including Friday adjustments.
Vertical Lines: Draws time-based vertical lines (e.g., every 15/30/60 minutes) within user-defined hours.
RSI Dashboard: A table displaying RSI values across multiple timeframes (1m, 2m, 3m, 5m, 15m, 1h) with color-coded overbought/oversold highlights.
Displacement Detection: Colors bars where candle range exceeds a standard deviation threshold, optionally requiring an FVG.
Engulfing Candles: Highlights bullish/bearish engulfing patterns based on size and body ratios.
How to Use
Add the indicator to your chart (works best on intraday timeframes like 1m-15m for stocks/futures).
Adjust inputs in the settings panel to enable/disable features and customize colors, widths, and thresholds.
Interpret visuals:
- Lines and boxes indicate potential key levels or gaps—watch for price interactions (e.g., bounces or breaks).
- Bar colors highlight displacement or engulfing patterns for momentum insights.
- The RSI table provides multi-timeframe overbought/oversold context.
Combine with other tools (e.g., volume, moving averages) for comprehensive analysis. Test on historical data to understand behavior.
This indicator is overlay-based and does not plot traditional series but uses lines, boxes, labels, and tables for visualization.
Input Settings
Session High/Low Settings: Toggle Asian/London/Prev Day/Week displays, colors, widths, and label sizes.
Midnight/True Day Open and 8:30 Open: Enable lines, styles (solid/dotted/dashed), colors, and history.
Pre-Market Data High/Low: Toggle pre-market (7-9 AM) highs/lows, colors, widths, and labels.
Macro Time: Enable specific macro windows (e.g., 8:50-9:10) with text options.
Fair Value Gap Settings: Toggle FVG, threshold %, extend length, colors, and timeframe.
Vertical Lines Settings: Toggle lines, timeframe (15m/30m/1h), style, color, and hour range.
RSI Dashboard Settings: Toggle dashboard, position, size, transparency, and overbought/oversold levels.
Displacement Settings: Toggle detection, require FVG, type (open-close/high-low), strength, and color.
Engulfing Candle Settings: Toggle highlighting, bar ratio threshold, body/tail ratio, and color.
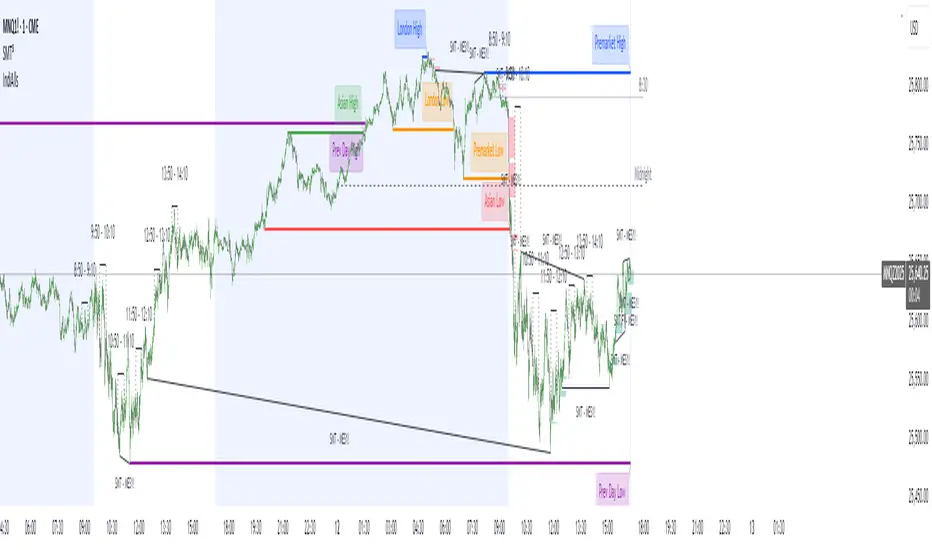
USDJPY Fair Value Gap + Session Strategy🎯 Overview
This strategy combines Fair Value Gaps (FVGs) with session-based order flow analysis, specifically optimized for USDJPY. It identifies price inefficiencies left behind by institutional order flow during high-volatility trading sessions, offering a modern alternative to traditional lagging indicators.
🔬 What Are Fair Value Gaps?
Fair Value Gaps represent areas where aggressive institutional buying or selling created "gaps" in the market structure:
Bullish FVG: Price moves up so aggressively that it leaves unfilled buy orders behind
Bearish FVG: Price moves down so quickly that it leaves unfilled sell orders behind
Research shows approximately 80% of FVGs get "filled" (price returns to the gap) within 20-60 bars, making them highly predictable trading zones.
(see the generated image above)
(see the generated image above)
FVG Detection Logic:
text
// Bullish FVG: Gap between high and current low
bullishFVG = low > high and high > high
// Bearish FVG: Gap between low and current high
bearishFVG = high < low and low < low
🌏 Session-Based Trading
Why Sessions Matter for USDJPY
(see the generated image above)
Tokyo Session (00:00-09:00 UTC)
Highest volatility during first hour (00:00-01:00 UTC)
Average movement: 51-60 pips
Best for breakout strategies
London/NY Overlap (13:00-16:00 UTC)
Maximum liquidity and institutional participation
Tightest spreads and most reliable FVG formations
Optimal for continuation trades
Monday Premium Effect
USDJPY moves 120+ pips on Mondays due to weekend positioning
Enhanced FVG formation during session opens
📊 Strategy Components
(see the generated image above)
1. Fair Value Gap Detection
Identifies bullish and bearish FVGs automatically
Age limit: FVGs expire after 20 bars to avoid stale setups
Size filter: Minimum gap size to filter out noise
2. Session Filtering
Tokyo Open focus: Trades during first hour of Asian session
London/NY Overlap: Captures high-liquidity institutional flows
Weekend gap strategy: Enhanced signals on Monday opens
3. Volume Confirmation
Requires 1.5x average volume spike
Confirms institutional participation
Reduces false signals
4. Trend Alignment
50 EMA filter ensures trades align with higher timeframe trend
Long trades above EMA, short trades below
Prevents costly counter-trend trades
5. Risk Management
2:1 Risk/Reward minimum ensures profitability with 40%+ win rate
Percentage-based stops adapt to USDJPY volatility (0.3% default)
Configurable position sizing
🎯 Entry Conditions
(see the generated image above)
Long Entry (BUY)
✅ Bullish FVG detected in previous bars
✅ Price returns to FVG zone during active trading session
✅ Volume spike above 1.5x average
✅ Price above 50 EMA (trend confirmation)
✅ Bullish candle closes within FVG zone
✅ Trading during Tokyo open OR London/NY overlap
Short Entry (SELL)
✅ Bearish FVG detected in previous bars
✅ Price returns to FVG zone during active trading session
✅ Volume spike above 1.5x average
✅ Price below 50 EMA (trend confirmation)
✅ Bearish candle closes within FVG zone
✅ Trading during Tokyo open OR London/NY overlap
📈 Expected Performance
Backtesting Results (Based on Similar Strategies):
Win Rate: 44-59% (profitable due to high R:R ratio)
Average Winner: 60-90 pips during London/NY sessions
Average Loser: 30-40 pips (tight stops at FVG boundaries)
Risk/Reward: 2:1 minimum, often 3:1 during strong trends
Best Performance: Monday Tokyo opens and Wednesday London/NY overlaps
Why This Works for USDJPY:
90% correlation with US-Japan bond yield spreads
High volatility provides sufficient pip movement
Heavy institutional/central bank participation creates clear FVGs
Consistent volatility patterns across trading sessions
⚙️ Configurable Parameters
Session Settings:
Trade Tokyo Session (Enable/Disable)
Trade London/NY Overlap (Enable/Disable)
FVG Settings:
FVG Minimum Size (Filter small gaps)
Maximum FVG Age (20 bars default)
Show FVG Markers (Visual display)
Volume Settings:
Use Volume Filter (Enable/Disable)
Volume Multiplier (1.5x default)
Volume Average Period (20 bars)
Trend Settings:
Use Trend Filter (Enable/Disable)
Trend EMA Period (50 default)
Risk Management:
Risk/Reward Ratio (2.0 default)
Stop Loss Percentage (0.3% default)
🎨 Visual Indicators
🟡 Yellow Line: 50 EMA trend filter
🟢 Green Triangles: Long entry signals
🔴 Red Triangles: Short entry signals
🟢 Green Dots: Bullish FVG zones
🔴 Red Dots: Bearish FVG zones
🟦 Blue Background: Tokyo open session
🟧 Orange Background: London/NY overlap
📊 Recommended Settings
Optimal Timeframes:
Primary: 5-minute charts (scalping)
Secondary: 15-minute charts (swing trading)
Parameter Optimization:
Conservative: Stop Loss 0.2%, R:R 2:1, Volume 2.0x
Balanced: Stop Loss 0.3%, R:R 2:1, Volume 1.5x (default)
Aggressive: Stop Loss 0.4%, R:R 1.5:1, Volume 1.2x
Risk Management:
Maximum 1-2% of account per trade
Daily loss limit: Stop after 3-5 consecutive losses
Use fixed percentage position sizing
⚠️ Important Considerations
Avoid Trading During:
Major news events (BOJ interventions, NFP, FOMC)
Holiday periods with reduced liquidity
Low volatility Asian afternoon sessions
When US-Japan yield differential narrows sharply
Best Practices:
Limit to 2-3 trades per session maximum
Always respect the 50 EMA trend filter
Never risk more than planned per trade
Paper trade for 2-4 weeks before live implementation
Track performance by session and day of week
🚀 How to Use
Add the script to your USDJPY chart
Set timeframe to 5-minute or 15-minute
Adjust parameters based on your risk tolerance
Enable strategy alerts for automated notifications
Wait for visual signals (triangles) to appear
Enter trades according to your risk management rules
📚 Strategy Foundation
This strategy is based on:
Smart Money Concepts (SMC): Institutional order flow tracking
Market Microstructure: Understanding how FVGs form in electronic trading
Quantified Risk Management: Statistical edge through proper R:R ratios
Session Liquidity Patterns: Exploiting predictable volatility cycles

NSR FVG High Time FramesIndicator Name : NSR FVG High Time Frames
Short Title : NSR FVGHTF
Description :The NSR FVG High Time Frames indicator identifies and visualizes Fair Value Gaps (FVGs) on higher timeframes (4-hour, Daily, and Weekly) directly on your chart. FVGs are price gaps formed between the high and low of non-consecutive candles, often indicating areas of market inefficiency that price may revisit. This indicator is designed for traders who incorporate multi-timeframe analysis into their strategies, providing a clear visual representation of bullish and bearish FVGs with customizable settings.
Unique Feature :Unlike traditional FVG indicators that mark a gap as closed when the current candle’s close crosses the gap’s boundaries, NSR FVG High Time Frames employs a distinctive closure logic. It allows an additional candle to determine whether the price re-enters the gap or continues beyond it. This approach provides a more nuanced assessment of gap closure, potentially reducing false signals by giving the market an extra candle to confirm its direction. This feature makes the indicator particularly suitable for traders seeking to validate FVG interactions with greater precision.
Key Features :
Multi-Timeframe Support : Detects FVGs on 4-hour, Daily, and Weekly timeframes, with options to enable or disable each timeframe.
Customizable Appearance : Users can adjust the visual style (Line, Dotted, Dashed) and colors for bullish and bearish FVGs, as well as enable/disable extension of FVG boxes to the right.
Flexible Lookback : Configurable lookback periods for entry (up to 10,000 candles) and FVG detection (up to 70 FVGs), allowing users to tailor the indicator to their trading style.
Minimum FVG Size : Set a minimum gap size (in ticks) to filter out insignificant FVGs, ensuring only meaningful gaps are displayed.
Closed FVG Removal : Option to automatically remove closed FVGs from the chart for a cleaner view.
Alert Integration : Generates alerts for new FVGs and changes in their status (e.g., verified, partial, closed), enabling traders to set up custom notifications.
How to Use :
Add to Chart : Apply the indicator to any chart. It works best on lower timeframes (e.g., 1H, 4H) to visualize higher-timeframe FVGs.
Configure Settings : Adjust the inputs in the settings panel:
Enable/disable 4-hour, Daily, or Weekly FVGs based on your analysis needs.
Set the lookback periods and minimum FVG size to match your trading strategy.
Customize colors and line styles for better chart readability.
Interpret FVGs :
Bullish FVGs (green boxes): Represent gaps where price may act as support, potentially attracting price back to the gap.
Bearish FVGs (red boxes): Represent gaps where price may act as resistance.
Boxes are drawn between the relevant high and low of the candles forming the FVG, with text labels indicating the timeframe (e.g., "4H", "D", "Weekly").
Monitor Closure : Watch for price interaction with FVGs. The indicator considers an FVG closed only after an additional candle confirms the price has moved beyond the gap or failed to re-enter it, unlike standard FVG indicators.
Set Alerts : Use the alert feature to receive notifications when new FVGs form or their status changes (e.g., "partial" or "closed").
Settings :
Entry Lookback (candles) : Number of candles to look back for FVG detection (default: 10,000).
Number of FVG to Lookback : Maximum number of FVGs to display (default: 70).
Minimum FVG Size : Minimum gap size in ticks (default: 5).
Remove Closed : Toggle to remove closed FVGs from the chart (default: true).
Show/Extend 4Hour/Daily/Weekly : Enable/disable FVGs for each timeframe and choose whether to extend boxes to the right.
Color and Style Options : Customize fill and border colors, and select line styles (Line, Dotted, Dashed) for each timeframe.
Use Cases :
Swing Trading : Identify potential support/resistance zones on higher timeframes for entry or exit points.
Price Action Analysis : Use FVGs to confirm market inefficiencies or reversal zones.
Multi-Timeframe Strategies : Combine with lower-timeframe indicators to align entries with higher-timeframe FVGs.
Notes :
The indicator is optimized for lower timeframes to display higher-timeframe FVGs. Avoid using it on Weekly or Monthly charts for Daily/Weekly FVGs to prevent overlap issues.
The unique closure logic may delay FVG closure signals compared to other indicators, which can help filter out premature closures but requires patience for confirmation.
Performance may vary on very low timeframes with large lookback periods due to the number of FVGs processed.
Disclaimer :This indicator is for informational purposes only and does not constitute financial advice. Always conduct your own analysis and test the indicator thoroughly before using it in live trading.

FVG Zones with Signals█ OVERVIEW
"FVG Zones with Signals" is a technical analysis tool that identifies Fair Value Gaps (FVG) on the chart and draws customizable zones in the form of boxes. It is ideal for traders using price action and market structure strategies, helping to identify potential imbalance zones and trading opportunities based on breakout and exit signals. With flexible size filter settings, box styles, and signal options, the indicator ensures clarity and precision on the chart.
█ CONCEPTS
The indicator is designed to identify potential entry points for trades based on FVG breakouts or retests. For chart clarity, a size filter for FVGs is included, based on a multiplier of the average candle size over a specified period.
Why are FVGs important? FVG zones represent areas of market imbalance, often attracting price back to "fill" the gap. Larger gaps (with a higher size multiplier) have a greater chance of being retested, as they indicate deeper imbalances—leaving more unexecuted orders in those zones, which attracts liquidity. Market makers and institutions often return to these levels to "refresh" liquidity before further moves. However, not every large FVG is retested quickly—in strong trends, smaller imbalances may be ignored, and the location (e.g., near swing highs/lows) is critical for retest probability.
█ FEATURES
- FVG Detection: Identifies bullish and bearish FVGs based on size filters (Candle Size Period and FVG Size Multiplier), with automatic initialization of historical gaps up to 500 candles back.
- Customizable Boxes: Draws FVG boxes with adjustable border colors, background gradients, border styles (solid, dashed, dotted), border widths, and transparency for both the background and the 50% FVG midline.
- Breakout and Exit Signals: Generates "Break" signals (green upward triangle for breakouts above bearish FVG, red downward triangle for breakouts below bullish FVG) and "Exit" signals (circles for exiting the zone), with options to select signal types (Break, Exit, or Both). A break signal causes the box to disappear, leaving a triangle as a trace of the breakout, which may serve as a signal to open a position. Exit signals (circles) may also indicate entry opportunities but require additional confirmation, such as alignment with the main trend.
- Midline: Automatically draws a dashed line at the 50% FVG level with adjustable transparency, aiding in assessing price reactions within the zone.
- Box Limitation: Automatically removes old or inactive FVGs after 500 candles to avoid chart clutter.
- Alerts: Built-in alerts for all signal types, including price and FVG type descriptions.
█ HOW TO USE
Add to Chart: Apply the indicator to your TradingView chart via the Pine Editor or Indicators menu.
Configure Settings:
- FVG Settings: Adjust Candle Size Period (default 20) and FVG Size Multiplier (default 1) to filter out small gaps—higher values generate fewer but more significant FVGs.
- Box Settings: Configure colors and styles for bullish (green) and bearish (red) boxes, including background transparency (default 80) and midline transparency.
- Signal Settings: Select signal types (Break, Exit, or Both) in Signal Type. Breakout signals appear after a candle closes outside the zone, while exit signals appear when exiting an FVG without a full breakout.
- Styling: Customize signal colors (green for buy/up, red for sell/down) and shape sizes.
Interpreting Signals:
- Break Up Signal: A green triangle below the bar indicates a breakout above a bearish FVG, suggesting potential continuation of an uptrend.
- Break Down Signal: A red triangle above the bar indicates a breakout below a bullish FVG, suggesting potential continuation of a downtrend.
- Exit Up/Down Signal: A green/red circle indicates an exit from an FVG without a full breakout, which may signal the end of a correction or preparation for a reversal.
- FVG Zones: If the price returns to an FVG and fills the gap, it may indicate equilibrium; an unfilled gap often leads to a retest.
- Use signals in conjunction with other technical analysis tools for confirmation, such as RSI (to identify overbought/oversold conditions) or MACD (to confirm momentum). Analyze FVGs from higher timeframes—these zones act as stronger imbalance levels and carry greater structural significance.
Exit signals (retests without breakouts) tend to be most effective when traded in line with the current trend.
█ APPLICATIONS
- Price Action Trading: Use FVG zones as dynamic support and resistance levels. In an uptrend, look for buying opportunities in bullish FVGs, where price often tests the gap before continuing. Combining with RSI, MACD, or Fibonacci levels enhances the significance of zones.
- Breakout Strategies: Trade based on breakout signals from FVGs. A buy signal after breaking a bearish FVG may indicate a strong upward impulse, especially when supported by a rising MACD or RSI exiting oversold conditions.
Larger FVG gaps (higher multiplier) have a greater chance of retest, as they indicate deeper imbalances.
█ NOTES
- Test the indicator across different timeframes and markets (stocks, forex, crypto) to optimize size filters for your trading style.
- The indicator initializes historical FVGs up to 500 candles back, which may slow loading on longer charts.
- For best results, use on high-liquidity markets where FVGs are more frequently retested.
- In consolidation zones, the indicator may generate more false signals, so additional confirmation is recommended.
