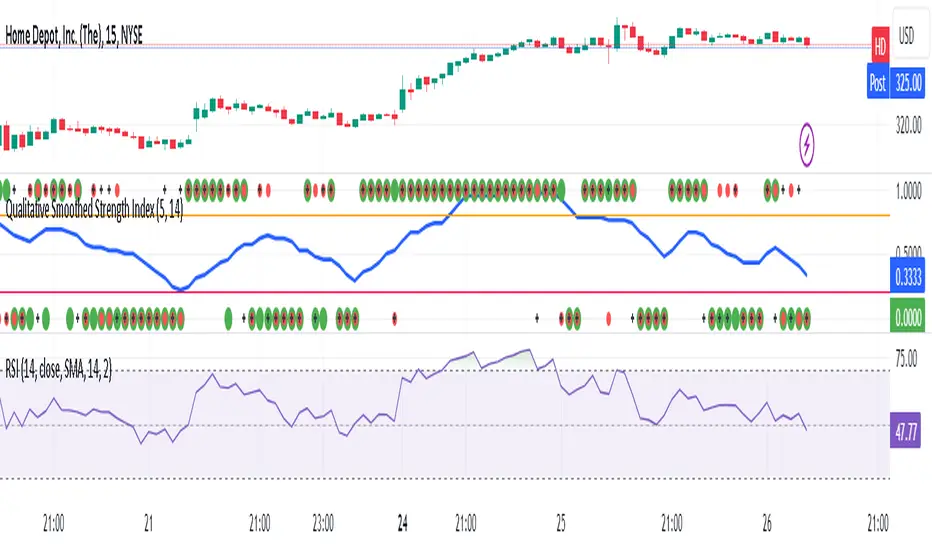
Qualitative Smoothed Strength Index***RSI CHART BELOW IS FOR COMPARSION TO SHOW HOE THEY MAKE SIMILIAR PATTERNS*** IT IS NOT PART OF THE INDICATOR***
The Qualitative Smoothed Strength Index (QSSI) is a simplified momentum oscillator whose values will oscillate between 0 and 1 . By converting price differences into binary values and smoothing them with a moving average, it identifies qualitative strength of price movements. This simplification allows traders to easily interpret trends and reversals. The QSSI offers advantages such as noise reduction, clear trend identification, and early signal detection, resulting in less lag compared to traditional oscillators. Traders can customize the indicator based on their preferences and use it across various markets.
QSSI Indicator uses the input function is used to define the input parameters of the indicator. In this case, there are two inputs:
length: The number of periods used for calculating the differences (a, b, c) and their assigned values. Default value is 5.
MAL: The length of the moving average used for smoothing the assigned values. Default value is 14.
The next few lines calculate 'a', 'b', and 'c', which represent the differences between the high, low, and close prices, respectively, and their corresponding previous simple moving averages (SMAs) of specified length. These differences are used to identify price movements.
The code assigns binary values (0 or 1) to a_assigned, b_assigned, and c_assigned, depending on whether the corresponding differences (a, b, c) are greater than 0. This step converts the differences into a binary representation, indicating upward or downward price movements.
Average_assigned calculates the average of the assigned binary values of a, b, and c. This average value represents the overall strength of the price movement.ma_assigned calculates the 14-day moving average of average_assigned, which smoothens the indicator and helps traders identify trends more easily.
The code plots the 14-day moving average (ma_assigned) on the chart as a blue line. It also plots the individual assigned values of a, b, and c as dots on the chart. a_assigned is shown in green, b_assigned in red, and c_assigned in black. These dots indicate the presence of upward or downward movements in the respective price components. By visualizing these dots on the chart, the trader can quickly identify the presence and direction of price movements for each of the price components. This information can be valuable for understanding how the different price elements (high, low, and close) are contributing to the overall trend and strength of the market. Traders can use this data to make more informed decisions, such as confirming the presence of trends, identifying potential reversals, or gauging the overall market sentiment based on the distribution of upward and downward movements across the price components.
Finally, the code draws horizontal dotted lines at levels 0.70 (0.8)and 0.30 (0.2). These levels are typically used to identify overbought (above 0.70 or 0.8) and oversold (below 0.30 or 0.2) conditions in the market.
The Qualitative Smoothed Strength Index (QSSI) provides traders with information about the strength and direction of price movements. By using assigned binary values, the indicator simplifies the interpretation of price data, making it easier to identify trends and potential reversals.
ابحث في النصوص البرمجية عن "index"
Reversion Zone IndexThe Reversion Zone Index (RZI) is an indicator that combines the Commodity Channel Index (CCI), Choppiness Index (CI), and Bollinger Bands Percentage (BBPct) to identify mean reversion signals in the market. It is plotted as an Exponential Moving Average (EMA) smoothed oscillator with overbought and oversold zones, and mean reversion signals are represented by red and green arrows.
The three indicators are combined to benefit from their complementary aspects and create a more comprehensive view of mean reversion conditions. Here's a brief overview of each indicator's benefits:
1. Commodity Channel Index (CCI): CCI measures the current price level relative to its average over a specified period. It helps identify overbought and oversold conditions, as well as potential trend retracements. By incorporating CCI, the RZI gains insights into momentum and potential turning points.
2. Choppiness Index (CI): CI quantifies the market's choppiness or trendiness by analyzing the range between the highest high and lowest low over a specific period. It indicates whether the market is in a trending or ranging phase. CI provides valuable information about the market state, which can be useful in mean reversion analysis.
3. Bollinger Bands Percentage (BBPct): BBPct measures the current price's position relative to the Bollinger Bands. It calculates the percentage difference between the current price and the bands, identifying potential overbought or oversold conditions. BBPct helps gauge the market's deviation from its typical behavior and highlights potential reversal opportunities.
The RZI combines the three indicators by taking an average of their values and applying further calculations. It smooths the combined oscillator using an EMA to reduce noise and enhance the visibility of the trends. Smoothing with EMA provides a more responsive representation of the overall trend and helps filter out short-term fluctuations.
The overbought and oversold zones are marked on the chart as reference levels. When the combined oscillator is above the overbought zone or below the oversold zone, it suggests a potential mean reversion signal. Red and green arrows are displayed to visually indicate these mean retracement signals.
The RZI is a valuable tool for identifying mean reversion opportunities in the market. It incorporates multiple indicators, each providing unique insights into different aspects of mean reversion, such as momentum, volatility, and price positioning. Traders can use this indicator to spot potential turning points and time their trades accordingly.

Discrete Fourier Transformed Money Flow IndexThe Discrete Fourier Transform Money Flow Index indicator integrates the Money Flow Index (MFI) with Discrete Fourier Transform (credit to author wbburgin - May 26 2023 ) smoothing to offer a refined and smoothed depiction of the MFI's underlying trend. The MFI is calculated using the formula: MFI = 100 - (100 / (1 + MR)), where a high MFI value indicates robust buying pressure (signaling an overbought condition), and a low MFI value indicates substantial selling pressure (signaling an oversold condition).
Why is the DFT and MFI combined?
The aim of this combination between DFT and MFI is to effectively filter out short-term fluctuations and noise, enabling a clearer assessment of the overall trend. This smoothing process enhances the reliability of the MFI by emphasizing dominant and sustained buying or selling pressures. This script executes a full DFT but only uses filtering from one frequency component. The choice to focus on the magnitude at index 0 is significant as it captures the dominant or fundamental frequency in the data. By analyzing this primary cyclic behavior, we can identify recurring patterns and potential turning points more easily. This streamlined approach simplifies interpretation and enhances efficiency by reducing complexity associated with multiple frequency components. Overall, focusing on the dominant frequency and applying it to the MFI provides a concise and actionable assessment of the underlying data.
Note: The FMFI indicator provides both smoothed and non-smoothed versions of the MFI, with the option to toggle the original non-smoothed MFI on or off in the settings.
Application
FMFI functions as a trend-following indicator. Bullish trends are denoted by the color white, while bearish trends are represented by the color purple. Circles plotted on the FMFI indicate regular bull and bear signals. Additionally, red arrows indicate a strong negative trend, while green arrows indicate a strong positive trend. These arrows are calculated based on the presence of regular bull and bear signals within overbought and oversold zones. To enhance its effectiveness, it is recommended to combine this indicator with other complementary technical analysis tools and integrate it into a comprehensive trading strategy. Traders are encouraged to explore a wide range of settings and timeframes to align the indicator with their unique trading preferences and adapt it to the current market conditions. By doing so, traders can optimize the indicator's performance and increase their potential for successful trading outcomes.
Utility
Traders and investors can employ this indicator to enhance their trend-following strategies. The white-colored components of the FMFI can help identify potential buying zones, while the purple-colored components can assist in identifying potential selling points. The red and green arrows can be used to pinpoint moments of strong bull or bear momentum, allowing traders to position themselves advantageously in their trading activities. Please note that future performance of any trading strategy is fundamentally unknowable, and past results do not guarantee future performance.

L&S Volatility IndexOverview
L&S Volatility Index is a tool designed to helps traders identify overpriced or underpriced moments in the market and adjust their trading strategies accordingly.
Calculations
This tool calculates how far the price is from the 21-period simple moving average as a ratio of the average historical volatility calculated over the last 21 candles.
How It Works
A L&S Volatility Index with a value greater than 30% may indicate that the asset is overpriced or underpriced relative to its average price.
How To Use
If the L&S Volatility Index > 30, the asset is overpriced or underpriced. This means that there is a good probability of initiating a mean reversion.
If the L&S Volatility Index < 30, the asset is in a fair price region. This means that it is acceptable to buy or sell in that price region.
Where To Use
Mean Reversion Strategy
Breakout Strategy
What Makes it Original
There is already an indicator that use a normalized calculation and a different approach to calculate historical volatility, whereas this script calculation is non-normalized and historical volatility is calculated using Don Fishback's formula. All calculations are used as originally described.
Credits
The L&S Volatility Index indicator was originally written by L&S Educação Financeira.
Historical Volatility calculation is based on the book "Odds: The Key to 90% Winners" written by Don Fishback.

Crypto Index Percentage GainThis script calculates the percentage gain from the left-most visible candle for multiple cryptocurrency symbols and plots all of them on the chart.
Description:
The "Crypto Index Percentage Gain" indicator calculates the percentage gain from the left-most visible candle for a selection of cryptocurrency symbols. It utilizes the PineCoders VisibleChart library to access the high, low, close, and open prices of the visible chart range.
The user can customize the symbols to include in the calculation by enabling or disabling the corresponding input options. `_open` represents the open price, `_close` represents the close price, and `_gain` represents the calculated percentage gain. The formula used is (close - open) / open * 100 to calculate the percentage change between the open and close prices.
The calculated percentage gains for each symbol are plotted on the chart using different colors and line widths, providing an overview of the relative performance of the symbols.
Usage:
Add the "Crypto Index Percentage Gain" indicator to your trading view chart by searching it in indicator search bar or star it , it will show on your favourite indicators .
Configure the symbols and visibility options using the input parameters.
The indicator will calculate and display the percentage gain for each selected symbol based on the left-most visible candle on the chart.
Code Explanation:
The script imports the PineCoders VisibleChart library for accessing the visible chart range.
It defines a function `f_pcr()` to calculate the percentage gain for a given symbol.
Input options are provided to enable or disable symbols and set their visibility.
Symbols are defined using `input.symbol()` and the percentage gains are calculated using `request.security()`.
The calculated percentage gains for each symbol are plotted on the chart using different colors and line widths.
thanks to @PineCoders for VisibleChart library.

COT-index rangeA graph showing the commercials (part of COT-data) positioning in relation to its own range, X periods back. I usually choose the look-back period to equal approximately one year. This will be around 52 on a weekly chart and 250 on a daily chart.
In my opinion a high data-point for the commercials is bullish and vice versa. But instead of only looking att absolute values I now look more at how the commercials are positioned compared to the previous 12 och 6 months.
Example:
a) if COT-index range = 0.8, then the commercials are in the 80th percentile for this specific look-back period, i.e. the commercials has only been more bullish 20% of the time and more bearish 80% of the time.
b) a) if COT-index range = 0.5, then the commercials are in the 50th percentile for this specific look-back period, i.e. the commercials has been more bullish 50% of the time and more bearish 50% of the time.
c) if COT-index range = 0.2, then the commercials are in the 20th percentile for this specific look-back period, i.e. the commercials has been more bullish 80% of the time and more bearish 20% of the time.
In other words, a high reading is bullish and a low reading is bearish.

Stochastic Momentum Index (SMI) of Money Flow Index (MFI)"He who does not know how to make predictions and makes light of his opponents, underestimating his ability, will certainly be defeated by them."
(Sun Tzu - The Art of War)
▮ Introduction
The Stochastic Momentum Index (SMI) is a technical analysis indicator that uses the difference between the current closing price and the high or low price over a specific time period to measure price momentum.
On the other hand, the Money Flow Index (MFI) is an indicator that uses volume and price to measure buying and selling pressure.
When these two indicators are combined, they can provide a more comprehensive view of price direction and market strength.
▮ Improvements
By combining SMI with MFI, we can gain even more insights into the market. One way to do this is to use the MFI as an input to the SMI, rather than just using price.
This means we are measuring momentum based on buying and selling pressure rather than just price.
Another way to improve this indicator is to adjust the periods to suit your specific trading needs.
▮ What to look
When using the SMI MFI indicator, there are a few things to look out for.
First, look at the SMI signal line.
When the line crosses above -40, it is considered a buy signal, while the crossing below +40 is considered a sell signal.
Also, pay attention to divergences between the SMI MFI and the price.
If price is rising but the SMI MFI is showing negative divergence, it could indicate that momentum is waning and a reversal could be in the offing.
Likewise, if price is falling but the SMI MFI is showing positive divergence, this could indicate that momentum is building and a reversal could also be in the offing.
In the examples below, I show the use in conjunction with the price SMI, in which the MFI SMI helps to anticipate divergences:
In summary, the SMI MFI is a useful indicator that can provide valuable insights into market direction and price strength.
By adjusting the timeframes and paying attention to divergences and signal line crossovers, traders can use it as part of a broader trading strategy.
However, remember that no indicator is a magic bullet and should always be used in conjunction with other analytics and indicators to make informed trading decisions.

Stochastic Momentum Index (SMI) Refurbished▮Introduction
Stochastic Momentum Index (SMI) Indicator is a technical indicator used in technical analysis of stocks and other financial instruments.
It was developed by William Blau in 1993 and is considered to be a momentum indicator that can help identify trend reversal points.
Basically, it's a combination of the True Strength Index with a signal line to help identify turning points in the market.
SMI uses the stochastic formula to compare the current closing price of an asset with the maximum and minimum price range over a specific period.
He then compares this ratio to a short-term moving average to create an indicator that oscillates between -100 and +100.
When the SMI is above 0, it is considered positive, indicating that the current price is above the short-term moving average.
When it is below 0, it is considered negative, indicating that the current price is below the short-term moving average.
Traders use the SMI to identify potential trend reversal points.
When the indicator reaches an extreme level above +40 or below -40, a trend reversal is possible.
Furthermore, traders also watch for divergences between the SMI and the asset price to identify potential trading opportunities.
It is important to remember that the SMI is a technical indicator and as such should be used in conjunction with other technical analysis tools to get a complete picture of the market situation.
▮ Improvements
The following features were added:
1. 7 color themes, for TSI, Signal and Histogram.
2. Possibility to customize moving average type for TSI/Signal.
3. Dynamic Zones.
4. Crossing Alerts.
5. Alert points on specific ranges.
5. Coloring of bars according to TSI/Signal/Histogram.
▮ Themes
Examples:
▮ About Dynamic Zones
'Most indicators use a fixed zone for buy and sell signals.
Here's a concept based on zones that are responsive to the past levels of the indicator.'
The concept of Dynamic Zones was described by Leo Zamansky ( Ph .D.) and David Stendahl, in the magazine of Stocks & Commodities V15:7 (306-310).
Basically, a statistical calculation is made to define the extreme levels, delimiting a possible overbought/oversold region.
Given user-defined probabilities, the percentile is calculated using the method of Nearest Rank.
It is calculated by taking the difference between the data point and the number of data points below it, then dividing by the total number of data points in the set.
The result is expressed as a percentage.
This provides a measure of how a particular value compares to other values in a data set, identifying outliers or values that are significantly higher or lower than the rest of the data.
▮ What to look for
1. Divergences/weakening of a trend/reversal:
2. Supports, resistances, pullbacks:
3. Overbought/Oversold Points:
▮ Thanks and Credits
- TradingView and PineCoders: for SMI and Moving Averages
- allanster: for Dynamic Zones

Reverse Double Smoothed Relative Strength Index Bands[CC]The Reverse Double Smoothed Relative Strength Index Bands is a custom script of mine that is another part of my RSI indicator series, which I will be publishing over the next week or so. This takes my Double Smoothed Relative Strength Index script and applies the Reverse RSI formula to create a new Bollinger Bands type indicator. This concept can work for almost any oscillator with some slight tweaking. I have a reverse RSI being calculated for each major RSI level to give you an approximation of what the price would look like if that RSI level was hit. Feel free to tweak the RSI levels of course. I will publish more Reverse indicators since that doesn't seem to be a topic that is touched on very frequently. I have color coded the indicator to show darker colors when it is a strong signal and lighter colors for normal signals. Buy when the lines turn green and sell when they turn red.
This was a custom request from @kerpiciwuasile so let me know if you want to see me publish another custom script!

[blackcat] L1 Adaptive Choppiness IndexLevel: 1
Background
I have been working with choppiness index type indicator for long. However, there are several problems in tradintional one.
Function
One of the issue of conventional choppiness index is the noise or ripple is too obvious. I was wondering several ways to smooth it. As you may know, choppiness index is "one line" indicator. There is little room of freedom to change it too much. Then, I introduced adaptation algorithm to make "length" parameter adaptive, which can smooth choppiness index indicator to some degree. Meanwhile, I use ALMA to smooth the output again.
Remarks
I used my published dc_ta lib, which collects several dominant cycle algorithm from Elhers to make many indicator adaptive possible.
Feedbacks are appreciated.

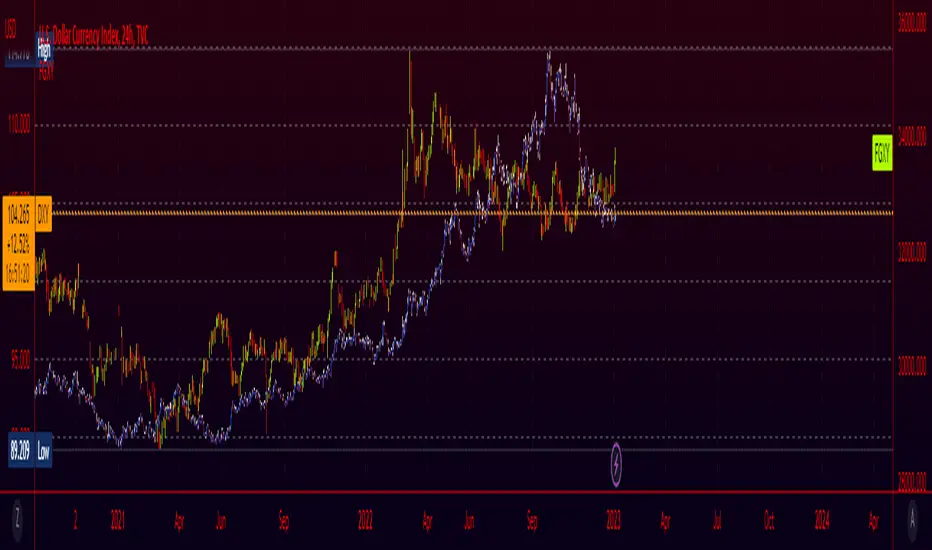
Fiat Currency and Gold Indices (FGXY) CandlesA modification of my previous indicator "Crypto Index (DXY) Candles". The idea was to create a similar currency basket to the standard DXY, but from the perspective of other currencies. Still using the standard DXY weights, this indicator allows you to create a tailored index for other currencies, provided that a currency pair exists for each of the 6 components. This means that even currencies that aren't included should work in theory; just find the 3 character currency prefix used by tradingview and give it a shot! This indicator is useful for gauging how well countries/currencies are holding up and when paired with the standard DXY may help see potential inflection points. For use on longer time frames (~1h-~3d) as some of the data being pulled seems to have issues on lower timeframes.
ahr999 Index█ OVERVIEW
The ahr999 index is very suitable for long-term value investors in Bitcoin.
When the index is above 1.2, it indicates that the price of Bitcoin is rising in a bull market.
When it is below 1.2, it indicates a reasonable cost averaging interval for investment.
When it is below 0.45, it indicates that the price of Bitcoin is underestimated and is a relatively high-certainty bottoming interval.
█ CONCEPTS
ahr999 is the product of two indices, one is Bitcoin's 200-day average price cost and the other is a price estimate fitted to Bitcoin's age.
The average cost is actually a geometric mean of bitcoin price in 200days.
and the estimate price was calculated by a log function based on the bitcoin price history since 2010.
finally we got the formula:
ahr999 Index = (close / GMA200) * (close / Estimate Price)
█ ACKNOWLEDGEMENT
This ahr999 index was originally created by Nine God in his book 《Bitcoin Accumulation》

Market Meanness Index [CC]The Market Meanness Index was created by Johann Christian Lotter and I added some smoothing of my own, so feel free to try it without any smoothing to see the differences. This indicator relies on the mean reversion theory that all prices will eventually revert to the mean over a long period of time. Obviously there is more to the theory but the basic idea is if you plot a sma or other typical moving average, you will see the price moving up or below the long term moving average such as a 200 day sma but usually heads back to the average in the short term. This is a good statistical analysis used for volatility which is where this indicator comes in. Simply put, we calculate volatility based on how often a price is both above the median and above the previous price or vice versa.
A rising Market Meanness Index means that the market is becoming more volatile and that there is a high likelihood of a change in the underlying trend. A falling Market Meanness Index means that the current trend is dying and there is a high likelihood of a trend reversal. Typically I put general buy and sell signals in red or green but in this particular case, this indicator works best as a overall trend filter and you would want to place a trade when this indicator has a peak or valley. Let me know if you find a good overall buy and sell signal system of course.
I know I keep saying that I will get active again and post more indicators but life is very hectic for me. For those who have been following my updates, my twins were finally born a little over a month ago and as you can imagine, they keep me up at all hours of the day so it is hard to create new indicator scripts when I'm getting no sleep lol. I will do my best to start publishing the giant backlog of scripts I have created but in the meantime, please be patient with me. This indicator was a special request so let me know if you have any special requests of your own!

Stock Market Emotion Index (SMEI)Implementation of Charlie Q. Yang's research paper “The stock market emotion index”, subtitle “A New Sentiment Measure Using Enhanced OBV and Money Flow Indicators”, (2007) where he combined “five simple emotion statistics” - Close Emotion Statistic (CES), Money Flow Statistic (MFS), Supply Demand Statistic (SDS), Relative Strength Statistic (RSS), and Psychological Level Statistic (PLS) - into one indicator.
Quotations:
“The index calculation is solely based on observed short term market volatility as reflected by each day’s trading volume, open, high, low, and close prices”
“The basic premise of Dow theory is that the market discounts everything, including the emotions of all traders. The fundamentals of a company do not change suddenly when its daily stock price is fluctuating as driven by human emotions that are often irrational. However, over a longer time period, a company's fundamentals do change. Again, different types of human emotions, triggered by the flow of material events, are moving the stock price trend up or down. This paper summarizes the author’s attempt in understanding primary trend extent and duration by proposing a new sentiment measure using statistical analysis of stock market human emotion.”
Even though “indicator is intended for identifying primary trend cycles that typically last one year or longer“ where Mr. Yang used a fixed averaging length of 260 days and only days as time frame, my implementation has been changed slightly to accommodate for all time frames and to adapt faster using shorter averaging (timeframe dependent).
How to use it:
Positive values indicating a bullish trend and negative values indicating a bearish trend. Background color is set to green or red accordingly.
Positive and negative bar to bar changes are indicated with green and red to show bar to bar (ultra short term) trends.
(No financial advise, use for testing purposed only)

MTF CCI + Realtime DivergencesMulti-timeframe Commodity Channel Index (CCI) + Realtime Divergences + Alerts
This version of the CCI includes the following features:
- Optional 2x sets of triple-timeframe overbought and oversold signals with fully configurable timeframes and overbought and oversold thresholds, can indicate where 3 selected timeframes are all overbought or all oversold at the same time, with alert option.
- Optional divergence lines drawn directly onto the oscillator in realtime, with alert options.
- Configurable pivot periods to fine tune the divergences drawn in order to suit different trading styles and timeframes, including the ability to enable automatic adjustment of pivot period per chart timeframe.
- Alternate timeframe feature allows you to configure the oscillator to use data from a different timeframe than the chart it is loaded on.
- 'Hide oscillator' feature allows traders to hide the oscillator itself, leaving only the background colours indicating the overbought and oversold periods and/or MTF overbought and oversold confluences, as seen in the chart image.
- Also includes standard configurable CCI options, including CCI length and source type. Defaults set to length 20, and hlc3 source type.
- Optional Flip oscillator feature, allows users to flip the oscillator upside down, for use with Tradingviews 'Flip chart' feature (Alt+i), for the purpose of manually spotting divergences, where the trader has a strong natural bias in one direction, so that they can flip both the chart and the oscillator.
- Optional 'Fade oscillator' feature, which will fade out all but the most recent period, reducing visual noise on the chart.
While this version of the CCI has the ability to draw divergences in realtime along with related alerts so you can be notified as divergences occur without spending all day watching the charts, the main purpose of this indicator was to provide the triple-timeframe overbought and oversold confluence signals, in an attempt to add more confluence, weight and reliability to the single timeframe overbought and oversold states, commonly used for trade entry confluence. It's primary purpose is intended for scalping reversal trades on lower timeframes, typically between 1-15 minutes, which can be used in conjunction with the regular divergences the indicator can highlight. The triple timeframe overbought can often indicate near term reversals to the downside, with the triple timeframe oversold often indicating neartime reversals to the upside. The default timeframes for this confluence are set to check the 1m, 5m and 15m timeframes together, ideal for scalping the < 15 minute charts. The default settings for the MTF #1 timeframes (1m, 5m and 15m) are best used on a <5 minute chart.
Its design and use case is based upon the original MTF Stoch RSI + Realtime Divergences found here .
Commodity Channel Index (CCI)
Investopedia has described the popular oscillator as follows:
“The Commodity Channel Index (CCI) is a momentum-based oscillator used to help determine when an investment vehicle is reaching a condition of being overbought or oversold.
Developed by Donald Lambert, this technical indicator assesses price trend direction and strength, allowing traders to determine if they want to enter or exit a trade, refrain from taking a trade, or add to an existing position. In this way, the indicator can be used to provide trade signals when it acts in a certain way.”
You can read more about the CCI, its use cases and calculations here .
How do traders use overbought and oversold levels in their trading?
The oversold level, that is traditionally when the CCI is above the 100 level is typically interpreted as being 'overbought', and below the -100 level is typically considered 'oversold'. Traders will often use the CCI at an overbought level as a confluence for entry into a short position, and the CCI at an oversold level as a confluence for an entry into a long position. These levels do not mean that price will necessarily reverse at those levels in a reliable way, however. This is why this version of the CCI employs the triple timeframe overbought and oversold confluence, in an attempt to add a more confluence and reliability to this usage of the CCI. While traditionally, the overbought and oversold levels are below -100 for oversold, and above 100 for overbought, he default threshold settings of this indicator have been increased to provide fewer, stronger signals, especially suited to the low timeframes and highly volatile assets.
What are divergences?
Divergence is when the price of an asset is moving in the opposite direction of a technical indicator, such as an oscillator, or is moving contrary to other data. Divergence warns that the current price trend may be weakening, and in some cases may lead to the price changing direction.
There are 4 main types of divergence, which are split into 2 categories;
regular divergences and hidden divergences. Regular divergences indicate possible trend reversals, and hidden divergences indicate possible trend continuation.
Regular bullish divergence: An indication of a potential trend reversal, from the current downtrend, to an uptrend.
Regular bearish divergence: An indication of a potential trend reversal, from the current uptrend, to a downtrend.
Hidden bullish divergence: An indication of a potential uptrend continuation.
Hidden bearish divergence: An indication of a potential downtrend continuation.
How do traders use divergences in their trading?
A divergence is considered a leading indicator in technical analysis , meaning it has the ability to indicate a potential price move in the short term future.
Hidden bullish and hidden bearish divergences, which indicate a potential continuation of the current trend are sometimes considered a good place for traders to begin, since trend continuation occurs more frequently than reversals, or trend changes.
When trading regular bullish divergences and regular bearish divergences, which are indications of a trend reversal, the probability of it doing so may increase when these occur at a strong support or resistance level . A common mistake new traders make is to get into a regular divergence trade too early, assuming it will immediately reverse, but these can continue to form for some time before the trend eventually changes, by using forms of support or resistance as an added confluence, such as when price reaches a moving average, the success rate when trading these patterns may increase.
Typically, traders will manually draw lines across the swing highs and swing lows of both the price chart and the oscillator to see whether they appear to present a divergence, this indicator will draw them for you, quickly and clearly, and can notify you when they occur.
Setting alerts.
With this indicator you can set alerts to notify you when any/all of the above types of divergences occur, on any chart timeframe you choose, and also when the triple timeframe overbought and oversold confluences occur.
Configurable pivot period.
You can adjust the default pivot period values to suit your prefered trading style and timeframe. If you like to trade a shorter time frame, lowering the default lookback values will make the divergences drawn more sensitive to short term price action. By default, this indicator has enabled the automatic adjustment of the pivot periods for 4 configurable timeframes, in a bid to optimise the divergences drawn when the indicator is loaded onto any of the 4 timeframes. These timeframes and the auto adjusted pivot periods on each of them can also be reconfigured within the settings menu.
Disclaimer: This script includes code adapted from the Divergence for Many Indicators v4 by LonesomeTheBlue . With special thanks.

Crypto-DX Crypto Directional Index [chhslai]Crypto-DX can be used to help measure the overall strength and direction of the crypto market trend.
Furthermore, it can be used as a screener to find out cryptocurrencies which are accumulating momentum and tends to potentially pump or dump.
How this indicator works :
If the Crypto-DX cross above the zero-level, it could be an indication that there is a trend reversal into upward. You should close your short position or place a long order right away.
If the Crypto-DX cross below the zero-level, it could be an indication that there is a trend reversal into downward. You should close your long position or place a short order right away.
If the Crypto-DX is consolidated around the zero-level, it could be an indication that the trend may be ended and followed by a sideway market. You are suggested not to place any order and wait for the market moves.
Divergence based trading strategy is fully applicable, just like the MACD.
Screener features :
Plot "Crypto Index" and "5 Custom Crypto"
Plot "Crypto Index" and "Top 30 Crypto"

MFI + Realtime DivergencesMoney Flow Index (MFI) + Realtime Divergences + Alerts
This version of the MFI indicator adds the following 5 additional features to the stock MFI:
- Optional divergence lines drawn directly onto the oscillator in realtime.
- Configurable alerts to notify you when divergences occur.
- Configurable lookback periods to fine tune the divergences drawn in order to suit different trading styles and timeframes, including the ability to enable automatic adjustment of pivot period per chart timeframe.
- Background colouring option to indicate when the MFI oscillator has crossed above or below its centerline, or optionally when both the MFI has crossed its centerline and an external oscillator, which can be linked via the settings, has also crossed its centerline.
- Alternate timeframe feature allows you to configure the oscillator to use data from a different timeframe than the chart it is loaded on.
This indicator adds additional features onto the standard MFI , whose core calculations remain unchanged. Namely the configurable option to automatically, quickly and clearly draw divergence lines onto the oscillator for you as they occur in realtime. It also has the addition of unique alerts, so you can be notified when divergences occur without spending all day watching the charts. Furthermore, this version of the TSI comes with configurable lookback periods, which can be configured in order to adjust the sensitivity of the divergences, in order to suit shorter or higher timeframe trading approaches.
What is the Money Flow Index ( MFI )?
Investopedia describes the True Strength Indicator as follows:
“The Money Flow Index ( MFI ) is a technical oscillator that uses price and volume data for identifying overbought or oversold signals in an asset. It can also be used to spot divergences which warn of a trend change in price. The oscillator moves between 0 and 100.
Unlike conventional oscillators such as the Relative Strength Index ( RSI ), the Money Flow Index incorporates both price and volume data, as opposed to just price. For this reason, some analysts call MFI the volume-weighted RSI .”
What are divergences?
Divergence is when the price of an asset is moving in the opposite direction of a technical indicator, such as an oscillator, or is moving contrary to other data. Divergence warns that the current price trend may be weakening, and in some cases may lead to the price changing direction.
There are 4 main types of divergence, which are split into 2 categories;
regular divergences and hidden divergences. Regular divergences indicate possible trend reversals, and hidden divergences indicate possible trend continuation.
Regular bullish divergence: An indication of a potential trend reversal, from the current downtrend, to an uptrend.
Regular bearish divergence: An indication of a potential trend reversal, from the current uptrend, to a downtrend.
Hidden bullish divergence: An indication of a potential uptrend continuation.
Hidden bearish divergence: An indication of a potential downtrend continuation.
Setting alerts.
With this indicator you can set alerts to notify you when any/all of the above types of divergences occur, on any chart timeframe you choose.
Configurable pivot periods.
You can adjust the default pivot periods to suit your prefered trading style and timeframe. If you like to trade a shorter time frame, lowering the default lookback values will make the divergences drawn more sensitive to short term price action.
How do traders use divergences in their trading?
A divergence is considered a leading indicator in technical analysis , meaning it has the ability to indicate a potential price move in the short term future.
Hidden bullish and hidden bearish divergences, which indicate a potential continuation of the current trend are sometimes considered a good place for traders to begin, since trend continuation occurs more frequently than reversals, or trend changes.
When trading regular bullish divergences and regular bearish divergences, which are indications of a trend reversal, the probability of it doing so may increase when these occur at a strong support or resistance level . A common mistake new traders make is to get into a regular divergence trade too early, assuming it will immediately reverse, but these can continue to form for some time before the trend eventually changes, by using forms of support or resistance as an added confluence, such as when price reaches a moving average, the success rate when trading these patterns may increase.
Typically, traders will manually draw lines across the swing highs and swing lows of both the price chart and the oscillator to see whether they appear to present a divergence, this indicator will draw them for you, quickly and clearly, and can notify you when they occur.
Disclaimer: This script includes code from the stock MFI by Tradingview as well as the Divergence for Many Indicators v4 by LonesomeTheBlue.

True Strength IndexThe True Strength Index (TSI) is a technical momentum oscillator that can help identify trends and spot reversals. This indicator was developed with about an hour of research, based on the original True Strength Index formula by William Blau. The research material used to create this indicator can be found in the script (released publicly).
Author Notes:
- The zero line is included in this script, since it's a standard feature of the True Strength Index momentum oscillator.
- I did not include support and resistance levels, as I'm still researching the best way to incorporate this, rather than using a simple horizontal line for each.
- The original True Strength Index momentum oscillator utilizes the Exponential Moving Average, but with this release, you have the option to use the Hull Moving Average (as an alternative). Feel free to experiment and adjust the settings to whatever suits your trading style.
- I plan on improving/updating this indicator, but for now, releasing this early version.
* This is being provided as is and the information provided by this script is meant for informational/entertainment purposes only.

DMI Stochastic Momentum IndexConcepts
This is an improved version of the "DMI Stochastic Extreme Refurbished" indicator.
For more information on the main concepts of this indicator, please access this link:
The difference is that here, instead of using the traditional stochastic oscillator, I implemented the use of the Stochastic Momentum Index (SMI).
Stochastic Momentum Index (SMI)
The SMI is considered a refinement of the stochastic oscillator.
It calculates the distance of the current closing price as it relates to the median of the high/low range of price.
William Blau developed the SMI, which attempts to provide a more reliable indicator, less subject to false swings.
The original stochastic is limited to values from 0 to 100, while the SMI varies between the range of -100 to 100.
(Investopedia)
It is worth mentioning that the SMI presented in this script applies to the DMI value, not the screen price.

Fractal Dimension Index Adaptive Period [Loxx]Fractal Dimension Index Adaptive Period is the adaptive period out of Fractal Dimension Index Adaptivity. This isn't an indicator that shows a signal, instead, it's to be used as auxiliary support and an educational tool to create other indicators. This value can be injected into other indicators to make those indicators Fractal Dimension Index Adaptive.
What is the Fractal Dimension Index?
The goal of the fractal dimension index is to determine whether the market is trending or in a trading range. It does not measure the direction of the trend. A value less than 1.5 indicates that the price series is persistent or that the market is trending. Lower values of the FDI indicate a stronger trend. A value greater than 1.5 indicates that the market is in a trading range and is acting in a more random fashion.
Included
Loxx's Expanded Source Types

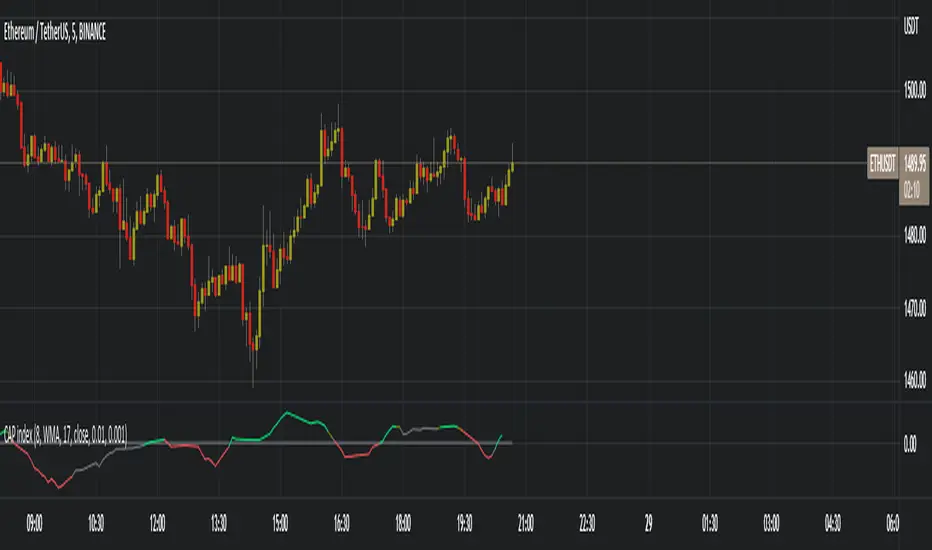
Constantly Applied Pressure Index (CAP index)BINANCE:ETHUSDT
The CAP index is my own homebrew trend indicator made to help traders see the slightly bigger picture, because we all know that as traders we can tend to hyper-focus in on a few candles and end up making a stupid trade because of it, or is it just me ? On a more serious note this indicator helps you find the short term trend by looking at bullish and bearish candles comparing their sizes, volumes and predominance.
The indicator has many technical settings for you to play around with but on the defaults it will render in a few colors which I will explain. Gray means no trend or that the current trend has died, bright green or red mean that a trend has formed, is playing out or that there is a good change a strong trend is about to form. Obviously green means bullish and red means bearish. Finally darker green and red mean a weak or weakening trend, this serves as a warning if you are about to take a trade in the trend direction.
The way I recommend using the indicator is the same way many trend indicators are used, as a filter to either a different indicator creating trading signals or to your own strategy's signals. I would add an illustration here that I prepared but I cannot because of tradingview's reputation rules
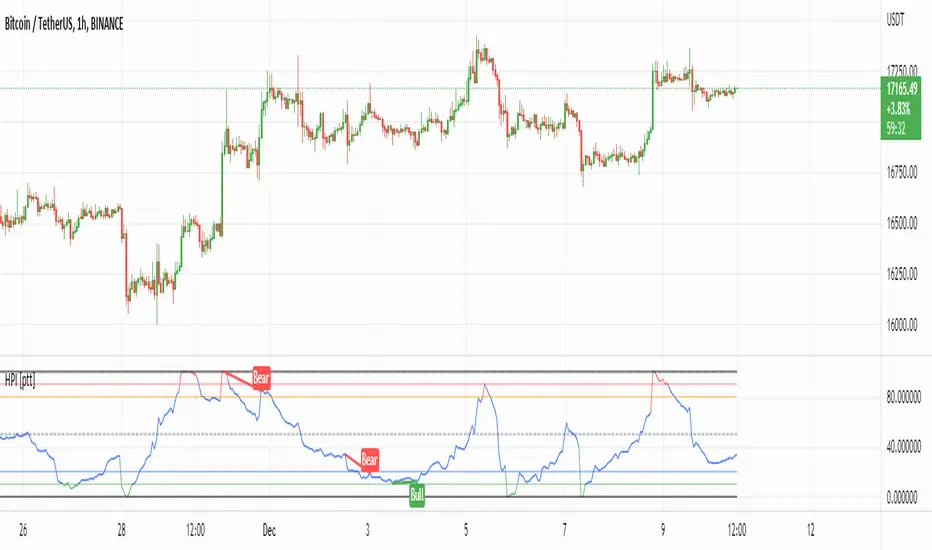
HPI for crypto [ptt]The Herrick Payoff Index is designed to show the amount of money flowing into or out of a futures contract.
This indicator uses open interest (from Binance PERP like this BTCUSDTPERP_OI) from during its calculations, therefore, the pairs being analyzed must contain open interest data on Binance.
The indicator only works with USDT pairs! Like RVNUSDT, BTCUSDT... does not work with USD pairs!
The indicator works in two mode.
Index mode - when the values moving 0-100
In this case, if the value below 10, it shows the money is flowing out of the futures contract and near the local bottom. If the value above 90, it shows the money is flowing into the futures contract and near the local top.
(The two trigger can be modified, the default is low:10 and high:90)
Oscillator mode - when the values moving around the origo (0)
In this case, if the value above 0 (green), it shows the money is flowing into the futures contract, this is bullish
If the value below 0 (red), it shows the money is flowing out of the futures contract, this is bearish
USD Liquidity Conditions IndexUSD Liquidity Conditions Index = — —
"Bitcoin vs. USD Liquidity Conditions Index
In this current phase of the crypto currency capital markets, Bitcoin represents a high-powered coincident (and sometimes leading indicator) of global USD liquidity conditions."
cryptohayes.medium.com
