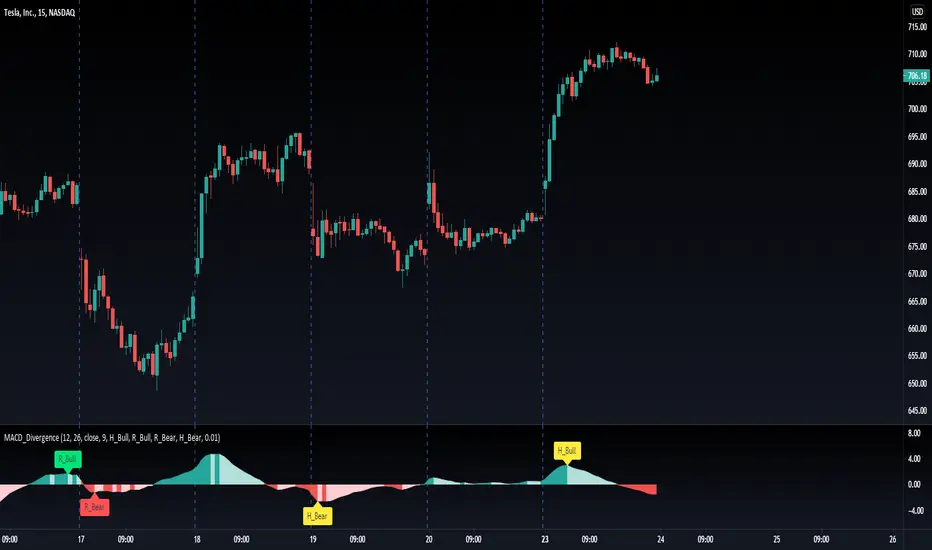
MACD w/ DivergencesTo best use the MACD Divergence indicators, adjust the following settings accordingly.
• MACD Bullish Divergence Under: <0 (lower for larger volatility and more bearish markets)
• MACD Bearish Divergence Above: >0 (higher for larger volatility and more bullish markets)
THIS SCRIPT DOES NOT REPAINT AND IS COMPLETELY FREE.
Goodluck Trading!
ابحث في النصوص البرمجية عن "macd"

MACD SqueezeJust saw this on a particular website and created my version of it.
A practical modification of MACD and Squeeze Momentum. The MACD histogram is colored in green or red depending on whether the squeeze momentum is active or not.
Additionally, the MACD line is colored green if the RSI is oversold and red if it's in the overbought levels.

MACD Master Suite [Kodexius]The MACD Master Suite is an advanced momentum and trend framework that takes the familiar MACD concept and wraps it in a modern, trader oriented environment. Instead of a single line + histogram combination, it turns MACD into a structured decision layer with enhanced visualization, confluence and context.
The engine is built around a MACD style core with refined smoothing and normalization, designed to keep shifts in momentum clear while avoiding the noisy flicker that standard settings often produce. On top of this core, the suite adds multi timeframe confirmation, adaptive histogram behavior, trend and exhaustion mapping, divergence detection and a compact visual dashboard so you can read momentum structure at a glance rather than bar by bar.
The goal is not to create a “magic signal”, but to make MACD behave like a proper momentum map: highlighting when trend strength is building, when a leg is stretching into exhaustion, where momentum is quietly rolling over beneath price, and how different timeframes are lining up before major continuation or reversal moves.
This is not classic everyday MACD. This suite extends the standard MACD through normalization and integrated features, designed to assist in analyzing momentum patterns, identifying potential reversals, and supporting multi timeframe strategies. It processes MACD data into structured outputs for use in various market conditions.
⚠️ Note:
This is not a traditional MACD, it uses normalized values, enhanced visual feedback, and a multi timeframe dashboard engine for superior signal quality and clarity.
🔹 Features
🔸 Enhanced MACD Core
- Custom MACD style oscillator that combines classic fast/slow smoothing with an internal normalization step, keeping the main wave readable even when volatility or scale changes.
- Flexible inputs for source, lengths and smoothing type so you can adapt the engine to different instruments and trading styles.
- Optional histogram + line combination, giving you both bar based impulse and a smoother line for regime changes and crossovers.
- Gradient colored oscillator line that visually shifts from red (weak momentum) through yellow (neutral) to green (strong momentum), providing at a glance regime identification.
🔸 Gradient Zones & Regime Context
- Configurable “overextended” zones around the MACD baseline, shaded with gradient fills rather than only hard lines.
- Visual emphasis on when the MACD engine is building a persistent push in one direction vs simply oscillating around the midline.
- The mid region is kept deliberately clearer so you can quickly distinguish between trending pushes, mean reverting swings and neutral chop.
🔸 MACD Channel & Break Behaviour
- Optional channel overlay built directly on top of the MACD oscillator, using volatility style bands (e.g., Bollinger-type or Keltner-type) in MACD space instead of price space.
- Helps you see when MACD is expanding strongly away from its recent equilibrium versus compressing inside a narrow band.
- Channel touches and pushes beyond the band edges can act as an additional cue for exhaustion type behaviour or strong continuation bursts.
🔸 Reversal Signal Markers
- Swing aware reversal markers that trigger when MACD conditions suggest a possible shift after stretching into your defined zones.
- Signals use the relationship between the MACD wave and its internal smoothing, aiming to highlight turning points that stand out from ordinary noise and try to filter out noise, focusing on confirmed shifts that align with broader market context.
- Markers are drawn on the MACD plot instead of the price chart to keep structure and signals in one place.
🔸 Divergence Mapping (Regular & Hidden, with MTF Dashboard Support)
- Automatic detection of regular bullish/bearish and hidden bullish/bearish divergences between price and the oscillator.
- Separate visibility toggles for each divergence type so you can focus only on the signals that fit your approach.
- "Wait for candle close" option ensures conservative confirmation, reducing false positives in fast moving markets.
🔸 Multi-Timeframe Custom MACD Dashboard
- Compact dashboard that summarizes MACD Engine state over multiple user defined timeframes in a small table.
Per timeframe cells can show:
– whether MACD is sitting in overbought/oversold style zones or in the neutral core,
– presence of recent bullish/bearish reversal signals,
– the current divergence bias (bullish, bearish or none),
– simple channel break information (upside/downside, or quiet).
Timeframe labels are formatted into familiar units (e.g., 15m, 1H, 4H, 1D) and the table is designed to be readable even when collapsed to a small area.
🔸 Oscillator Trendlines & Break Detection
- Automatically draws trendlines directly on the MACD oscillator, using momentum swing pivots instead of only price highs and lows, so you see structure shifts where they actually start in the underlying momentum.
- Lines adapt to bullish or bearish phases and are anchored only to “clean” pivots with minimal internal violations, making sustained impulse legs and corrective phases much easier to distinguish.
- When MACD momentum closes through one of these oscillator trendlines, the break is highlighted with labels, providing an additional structural confirmation layer on top of standard signal line crossovers or histogram flips.
🔸 Alerts
- Integrated alert conditions for MACD based reversals and all four divergence types (regular/hidden, bullish/bearish).
- Designed so you can create alerts directly from the indicator, turning key MACD events into actionable notifications.
- Altogether, MACD Master Suite consolidates multiple momentum tools into one cohesive interface, helping you read the “story” of MACD and its derivatives more intuitively and efficiently.
🔹 How To Use
▶ Reading the Core Momentum Engine
The main line serves as the primary momentum indicator: positions held above the midline suggest a bullish environment, whereas those below indicate a bearish setting. The gradient zones for overbought and oversold areas help identify when momentum is becoming extended or starting to ease back, offering a smoother view compared to rigid thresholds.
The channels provides an extra information for context:
• Momentum pushing toward or beyond the outer edges shows extension based on recent patterns.
• When it stays nearer to the center, it often points to balanced or corrective phases.
The histogram adds further detail to the picture: upward bars in varying green tones reflect positive momentum buildup, while downward bars in red tones show negative shifts. Diminishing bar sizes can hint at upcoming changes in direction, making it useful for spotting transitions.
Overall, focus on how these elements interact sustained positions, zone interactions, and histogram patterns to build a sense of the current momentum flow without overcomplicating the read.
▶ Working With Reversals & Divergences
Reversal markers show up after momentum enters extreme zones and starts to shift, acting as flags for areas where direction might change. They're best used as highlights for further review rather than standalone triggers.
For divergences, the tool examines how price movements align or differ from the momentum line:
• Regular types (bullish or bearish) point out possible weakening when price hits new levels but momentum doesn't follow suit.
• Hidden types (bullish or bearish) suggest ongoing trends when price retraces but momentum holds its ground.
Customize by selecting which divergences to show and opting for confirmation only after bars close this reduces clutter and promotes a steadier perspective. Experiment with these settings to match your preferred level of detail, such as enabling all types for in depth scans or limiting to regulars for simpler overviews.
In practice, combine reversals with divergences for layered insights: a reversal marker near a divergence line could strengthen the case for monitoring that area closely.
▶ Reading the Multi-Timeframe Dashboard
This dashboard packs insights from various timeframes into a compact table, allowing quick checks of alignment without switching views. Columns represent each timeframe you select, while rows cover aspects like divergence types, extreme states, general signals, and channel interactions.
A straightforward method is to:
• Look for consistency, such as matching patterns across higher frames signaling a unified trend.
• Spot differences, like shorter frames showing pullbacks while longer ones stay in extremes, which might indicate temporary adjustments.
• Use color cues greens for positive leans, reds for negative to get an at a glance feel before diving deeper.
Treat it as a quick reference tool: before focusing on a specific chart, scan the dashboard to see if broader contexts support or contradict your observations, helping refine your approach across scales.
▶ Trendlines, Breaks & Structure
Trendlines are generated from key swings in the momentum line, mapping out bullish or bearish patterns directly on the panel. This helps visualize hidden structures in momentum that might not be obvious from price alone.
Upward sloping lines often align with building positivity, downward ones with negativity. Breaks in these lines, marked on the display, can indicate when an established pattern is giving way to something different.
It's common to leave this feature disabled for routine checks and activate it for deeper examinations, such as during volatile periods or when confirming longer term shifts.
To get the most out, observe how trendlines evolve over time persistent lines might reinforce a regime, while frequent breaks could signal choppy or transitional conditions, adding another dimension to your momentum assessment.

MACD Divergence auto displayed on chart, with alertsMACD Pivot Divergence Detector
This tool identifies MACD histogram divergences based on confirmed pivot highs and lows.
Instead of comparing swing points on the MACD line, this script focuses specifically on the histogram, which measures momentum shifts between MACD and Signal.
How it works
The script detects confirmed pivots using a two-bar swing structure.
When price breaks above a previous pivot high, the script compares the MACD histogram value at that pivot to the current histogram value:
• If price makes a higher high while the histogram makes a lower high, a potential bearish divergence is marked.
The reverse logic is applied for bullish divergence when price breaks below a pivot low.
What makes this script unique
It uses pivot-confirmed histogram values, not lookback-based divergence.
It evaluates divergence only at actual highs/lows, reducing false positives.
It marks divergence directly on the candles for visual clarity.
Alert conditions are included for automated detection.
How to use
Bullish signals may highlight potential momentum loss in downtrends; bearish signals may highlight momentum loss near highs. Divergence does not guarantee reversal and should be combined with broader context, structure, or trend analysis.

MACD + StochasticMACD + Stochastic 14 Scenarios - Complete Signal Analysis
Combines MACD and Stochastic Oscillator to identify 14 different market scenarios based on crossover timing and indicator positioning.
🎯 Signal Strength Classification:
• STRONG (⭐⭐⭐⭐⭐): Both indicators cross together - highest confidence
• MODERATE (⭐⭐⭐⭐): One crosses while other confirms - good confidence
• WEAK (⭐⭐): Conflicting signals - low confidence
📊 Visual Features:
✓ Color-coded shapes on chart (triangles, circles, X marks)
✓ Scenario labels (1-16, excluding 12 & 14)
✓ Real-time info table showing current status
✓ Customizable signal display (show/hide by strength)
✓ Built-in alerts for all signal types
Perfect for swing traders and position traders looking for high-probability entries with dual indicator confirmation. Use on daily
timeframe for best results.
Includes toggleable display options for strong, moderate, and weak signals.

MACD Josh MACD Study — Visual Crossover Tags
Overview:
This script displays MACD signals in a clear, visual way by showing:
Histogram = EMA(Fast) − EMA(Slow)
Signal = EMA(Histogram, Signal Length)
It adds labels and arrows to help you see crossover events between the Histogram and the Signal line more easily.
⚠️ Disclaimer: This tool is for educational and research purposes only. It is not financial advice or an investment recommendation. Past performance does not guarantee future results. Users should make their own decisions and manage risk responsibly.
Features
Central Zero Line with Signal and Histogram plots
Optional labels/arrows to highlight Histogram–Signal crossovers
Alerts for crossover and crossunder events, integrated with TradingView’s alert system
Standard adjustable inputs: Fast EMA, Slow EMA, Signal EMA
How to Interpret (for study only)
When the Histogram crosses above the Signal, a visual label/arrow marks a positive MACD event
When the Histogram crosses below the Signal, a visual label/arrow marks a negative MACD event
The “BUY/SELL” labels are visual study tags only — they do not represent trade instructions or recommendations
Responsible Usage Tips
Test across multiple timeframes and different assets
Combine with higher-timeframe trend, support/resistance, or volume for confirmation
Use alerts with caution, and always test in a demo environment first
Technical Notes
The script does not use future data and does not repaint signals once bars are closed
Results depend on market conditions and may vary across assets and timeframes
License & Credits
Written in Pine Script® v5 for TradingView
The indicator name shown on chart is for labeling purposes only and carries no implication of advice or solicitation

MACD S/R signal indicatorI've based the script on my MACDs/r indicator.
I think it works better on higher timeframes, this is just an experiment, please feel free to modify it.
I have been testing it with parabolic SARS to know when to exit the trades.
Exit condition: if I'm in a log position and the price is below the last bearish parabolic SARS dot I exit the trade and the opposite for shorts
DISCLAIMER: Is just an experiment and I haven't test it with real money, be careful
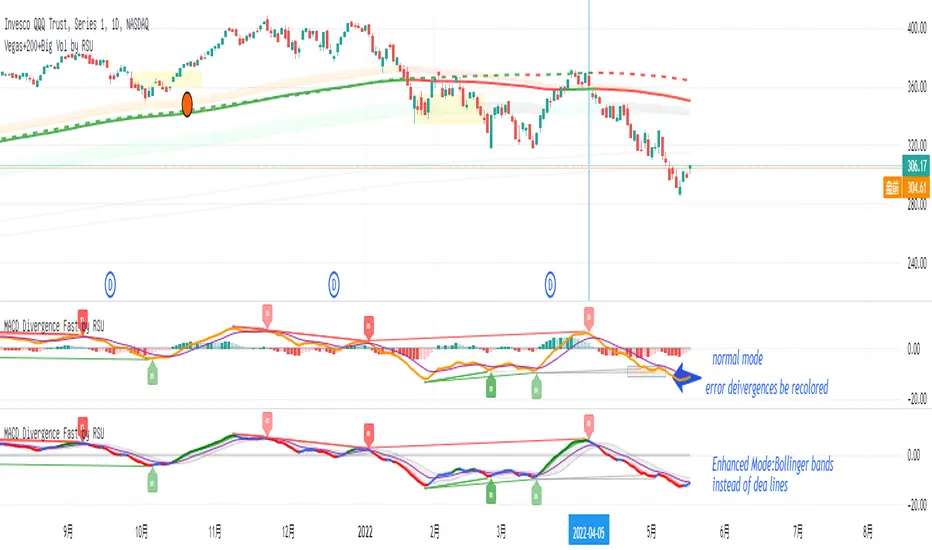
MACD Divergence Fast by RSUAdvantages:
1. When MACD-diff line(orange color) is at a high point, once it falls by 1 k line, it will detect the divergence from the previous high point. This can quickly find the divergence that has taken effect and help you quickly capture the trend before a sharp decline or rise.
2. This indicator detects the previous high and the previous low of 5, 10, 20, 40, 60 lengths at the same time, instead of only detecting a fixed length, so that more divergences can be found.
Notice:
Because it is a quick divergence detection, it is recommended to confirm that the divergence takes effect after the current k is completely closed first. I have identified this state in the indicator as "k not end".
Disadvantages and Risks:
Since it is a quick discovery, there will be error identification. Error divergences will recolor to grey.
Suggestion:
Use “RSI Divergence Fast by RSU” at the same time, because RSI divergence usually occurs before macd, if the position diverges at the same time, the probability of success will increase.
Please do not:
Don't go short in the uptrend, don't go long in the downtrend.
Top divergences that occur because of a strong uptrend are usually only temporary pullbacks. Bottom divergences in persistent declines are also temporary rallies. Do not attempt to trade such low-return trades.
It is recommended to use the divergence indicator when the stock price has made a new high and retraced, and once again made a new high, because this often leads to the end of the trend.
Divergence how to use:
1. After the previous K line was completely closed, a bottom divergence was found.
2. Open an long order at the beginning of the second bar, or as close to the bottom as possible (because the stop loss will be smaller).
3. Break the stop loss price below the previous low where the divergence occurred, which already means that the divergence is wrong.

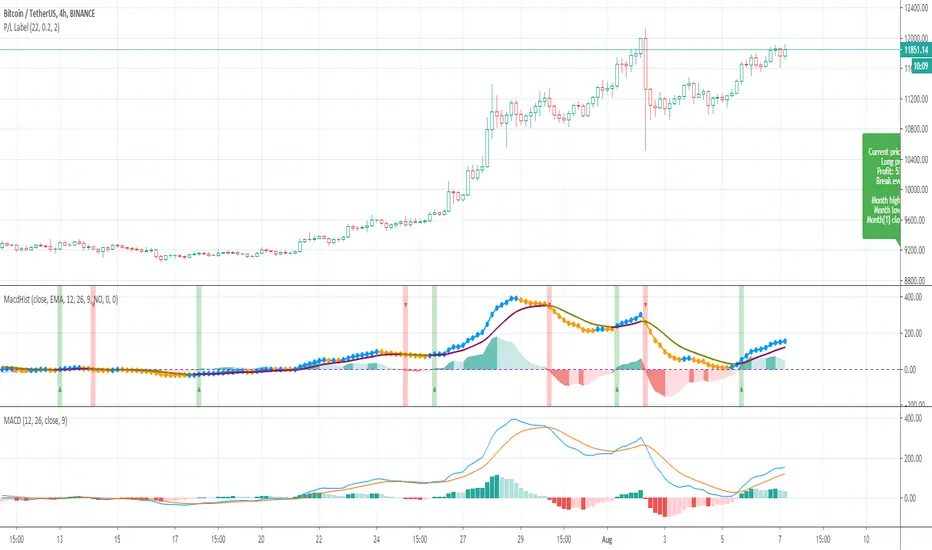
MACD Histogram BacktestTesting the trades signaled by the daily MACD histogram to see how they would have performed, compared to regular MACD Crosses. I'm going to take the 'List of trades' and analyse it seperately as some of the profit percentages seem a little off in the tradingview calculation, though it could just be my bad math!
Hi CryptoLove :) Hope this helps your investigation RE:
www.youtube.com
MACD - EURUSD - 1min Long OnlyMACD strategy with a specified level the MACD and signal line must be under. Once the two lines cross under the specified level, a long entry is executed. When the MACD line crosses over the historian, the close entry will be executed. This strategy is designed around the high probability of a reversal in an under-bought trend.

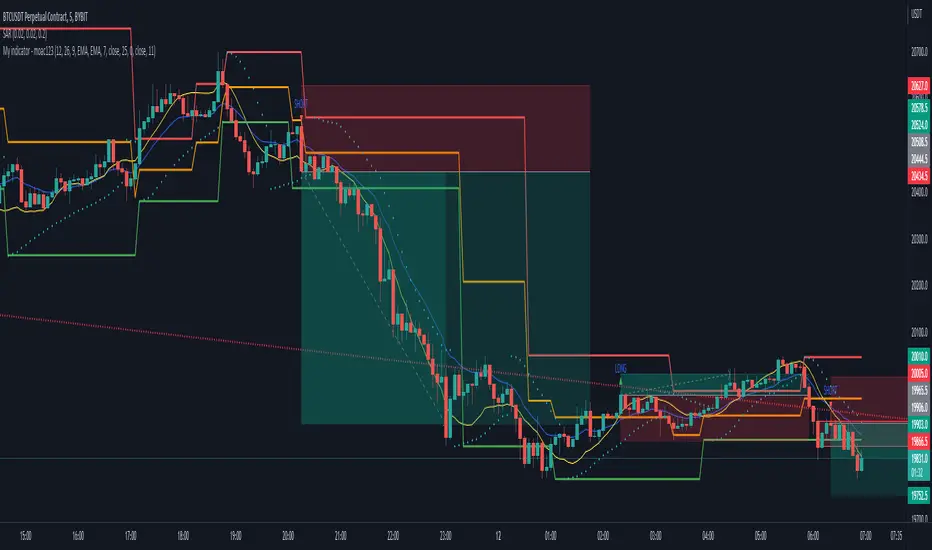
MACD Momentum Structure & Volume Profile Sniper [MTF]**Description and Methodology**
This script offers a unique approach to Market Structure by moving away from traditional fractal-based highs and lows (which can be noisy). Instead, it utilizes **MACD Momentum Swings** to identify significant structural points, combined with an automated Fixed Range Volume Profile to pinpoint high-probability entry zones.
**1. Why MACD Structure? (The Core Concept)**
Traditional "ZigZag" or Fractal indicators rely solely on price action, often leading to fake-outs during low-volume consolidation.
* This script defines a "Swing High" only when the MACD Histogram crosses below zero (Momentum shifts Bearish).
* This script defines a "Swing Low" only when MACD crosses above zero (Momentum shifts Bullish).
By linking structure to momentum, we filter out weak price movements and focus on the true "heartbeat" of the trend.
**2. The "Mashup" Synergy: Structure + Volume + Logic**
This is not a random combination of indicators. Each component serves a specific step in the trading execution sequence:
* **Step 1 (Structure):** The script identifies a Change of Character (CHoCH) based on the MACD peaks described above.
* **Step 2 (Liquidity/Value):** When a CHoCH occurs, the script *automatically* draws a **Fixed Range Volume Profile (FRVP)** specifically covering the impulse leg that caused the break. This reveals the "Point of Control" (POC)—the hidden price level where the most volume occurred during the move.
* **Step 3 (The Sniper Entry):** The script creates a "Zone" around that POC. It then waits for Price to retrace into this zone.
* **Step 4 (Confirmation):** Once the zone is touched, the script monitors a lower timeframe (User selectable, default M1) for a fresh MACD crossover to trigger the final entry signal.
**Features**
* **Multi-Timeframe Dashboard:** Monitor the MACD Trend direction across 4 different timeframes simultaneously.
* **Dynamic Trendlines:** Automatically connects confirmed MACD peaks to visualize trend integrity.
* **Fibo Time Zones:** Projects potential future pivot points based on the duration of the previous swing.
* **Alert System:** Integrated alerts for Zone Touches and "Sniper" entries (Zone Touch + LTF Momentum Confirmation).
**How to Use**
1. **Identify Trend:** Look for the CHoCH labels. Green indicates a shift to Bullish, Red to Bearish.
2. **Wait for Pullback:** Do not chase the break. Wait for price to return to the Yellow POC Zone generated by the Volume Profile.
3. **Entry Trigger:** Watch for the "BUY" or "SELL" marks. These appear only when price hits the zone AND the lower-timeframe momentum aligns with the trade direction.
**Settings & Inputs**
* **Global MACD:** Adjust the sensitivity of the swing detection (Default 12, 26, 9).
* **Sniper Entry:** Select the timeframe used for the final confirmation (e.g., use M1 confirmation for an H1 chart structure).
* **VP Settings:** Customize how the Volume Profile looks on the chart.
*Disclaimer: This script is intended for educational purposes and market analysis. It does not provide financial advice.*

MACD-V Volatility Normalized MomentumFull Credit to Alex Spiroglou, DipTA(ATAA), CFTe, and author of the MACD-V.
papers.ssrn.com
Alex recently received the CMT Dow Award for his work to improve on the classic MACD indicator. The MACD-V tackles some obvious challenges with the classic MACD indicator, which is normally an unbounded indicator and inconsistent between different symbols and markets.
"Our goal is to improve an existing tool (MACD), so that - by eliminating its shortcomings - we will be creating a unique type of hybrid 'boundless oscillator', that opens the doors for several pattern recognition opportunities which would not be definable using the classic MACD."
When the oversold/overbought range of 150 and -150 was determined, Alex tested where 95% of the data fell within the bands using the S&P price history as reference. Users are encouraged to find ranges relevant to the securities/instruments they are analyzing.
Enjoy!

MACD of Aggregated Buy/Sell Pressure - InFinitoModified & Updated script from MARKET VOLUME by Ricardo M Arjona @XeL_Arjona that Includes Aggregated Volume
Aggregation code originally from Crypt0rus
***The indicator can be used for any coin/symbol to aggregate volume , but it has to be set up manually***
***The indicator can be used with specific symbol data only by disabling the aggregation option, which allows for it to be used on any symbol***
- Calculated based on Aggregated Volume instead of by symbol volume . Using aggregated data makes it more accurate and allows to compare volume flow between different kinds of markets (Spot, Futures , Perpetuals, Futures+Perpetuals and All Volume ).
- As well, in order to make the data as accurate as possible, the data from each exchange aggregated is normalized to report always in terms of 1 BTC . In case this indicator is used for another symbol, the calculations can be adjusted manually to make it always report data in terms of 1 contract/coin.
Buy to Sell Convergence / Divergence by @XeL_Arjona:
"It's a simple adaptation of the popular "Price Percentage Oscillator" or MACD but taking Buying Pressure against Selling Pressure Averages, so given a Positive oscillator reading (>0) represents Bullish dominant Trend and a Negative reading (<0) a Bearish dominant Trend. Histogram is the diff between RAW Volume Pressures Convergence/Divergence minus Normalized ones (Signal) which helps as a confirmatory."
Things to look for:
- Divergences: This indicator can very useful to spot tops and bottoms through divergences

MACD Divergence H/RHere's a fun script we been working on, let us know what you add!
Short-Forms Used
histogram(hist)--> value of macd Histogram
Low-Price--------> Candle's Low Price
High-Price-------> Candle's High Price
---------------------------------------------------------------------------------------------------------------------------------------------------------------------------------
-Regular_bulls =====> Lowest(red hist) in Previous red hists is > Lowest(red hist) in Current red hists
and Lowest(Low-price) in Previous red hists is < Lowest(Low-price) in Current red hists
and Lowest(red hist) in Previous red hists is < -Histograms Minimum Value Required
and Lowest(red hist) in Current red hists is < -Histograms Minimum Value Required
---------------------------------------------------------------------------------------------------------------------------------------------------------------------------------
-Hidden_bulls =====> Lowest(red hist) in Previous red hists is < Lowest(red hist) in Current red hists
and Lowest(Low-price) in Previous red hists is > Lowest(Low-price) in Current red hists
and Lowest(red hist) in Previous red hists is < -Histograms Minimum Value Required
and Lowest(red hist) in Current red hists is < -Histograms Minimum Value Required
-------------------------------------------------------------------------------------------------------------------------------------------------------------------------------
-Regular_Bears =====> Highest(Green hist) in Previous Green hists is < Highest(Green hist) in Current Green hists
and Highest(High-price) in Previous Green hists is > Highest(High-price) in Current Green hists
and Highest(Green hist) in Previous Green hists is > Histograms Minimum Value Required
and Highest(Green hist) in Current Green hists is > Histograms Minimum Value Required
--------------------------------------------------------------------------------------------------------------------------------------------------------------------------------
-Hidden_Bears =====> Highest(Green hist) in Previous Green hists is > Highest(Green hist) in Current Green hists
and Highest(High-price) in Previous Green hists is < Highest(High-price) in Current Green hists
and Highest(Green hist) in Previous Green hists is > Histograms Minimum Value Required
and Highest(Green hist) in Current Green hists is > Histograms Minimum Value Required
Please drop a like and comment :)
-Angel Algo
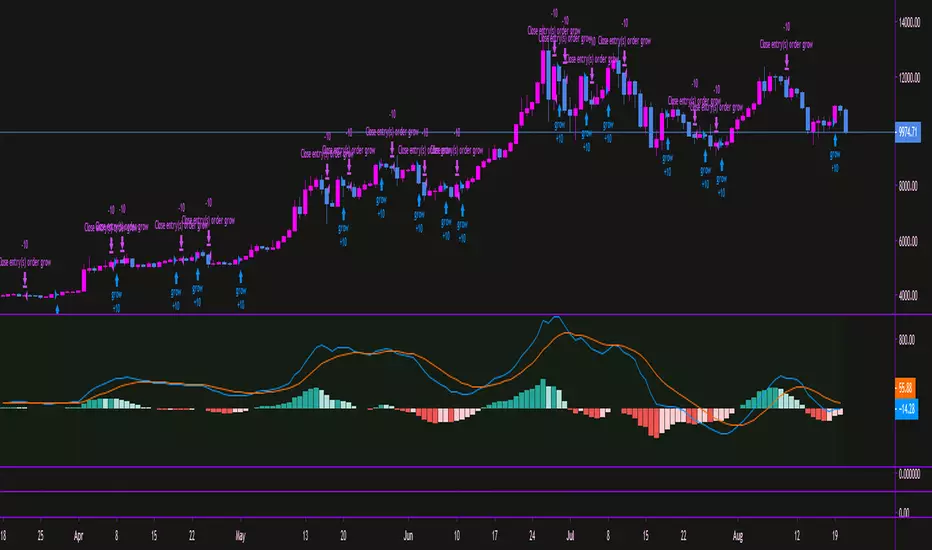
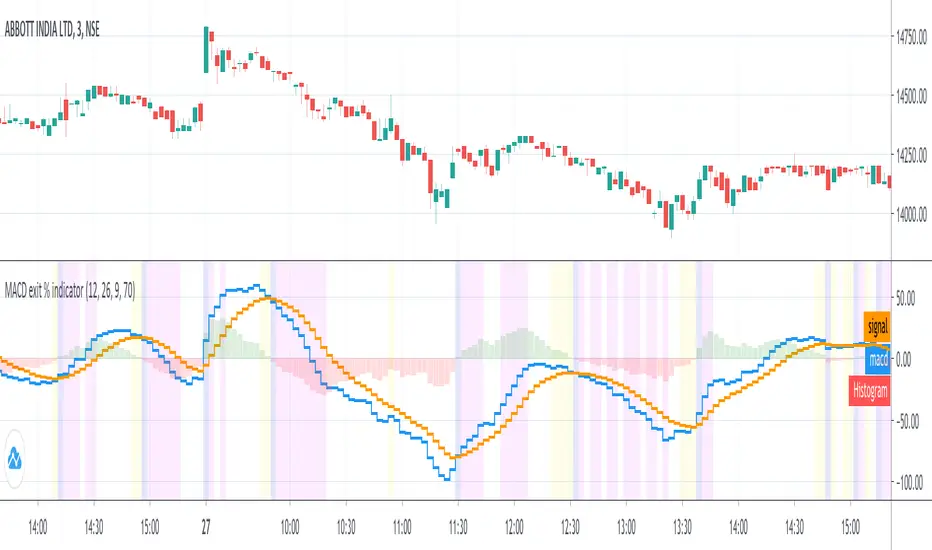
MACD exit % indicatorIntroduction
An exit indicator for MACD, good for triggering order exit via MACD.
It works by considering and the .
Then, it just exits when the % change in these values surpasses a threshold.
Indicators
blue line - MACD
orange line - Signal
green/red columns - Histogram
aqua background - Last Histogram Flip
fuchsia background - Max abs(Histogram) value after last flip
orange Background - Exit region
Ori Visual MACDMACD is about a relationship between two Moving Averages. Visual Macd draws these two moving averages and shows MACD with color on them. It is helpful for understanding MACD.

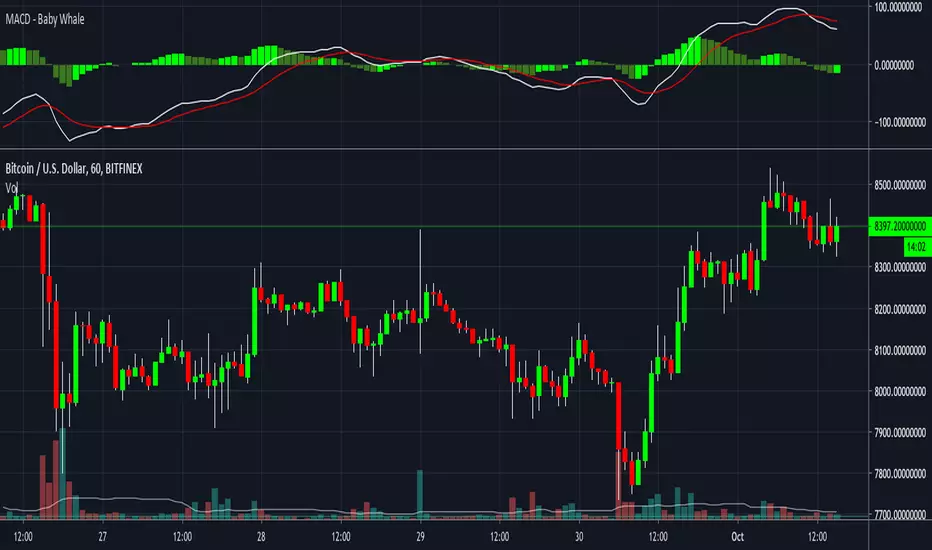
MACD - Baby WhaleI spiced the standard MACD indicator up a bit to make it more visible.
When using the MACD:
1. Never go short when the MACD lines are in the negative.
2. Never go long when the MACD lines are in the positive.
3. Always wait for an uptick / downtick on the histogram before you start your trade.
The MACD Histogram can also show you Divergence.
When the price goes up but the Histogram can't make new highs, it might be a good time to think about shorting.
If you want access, just send a message please.
Much love from Baby Whale!!
🙏❤️🐳
MACD HistogramShort MACD histogram to deal with crypto trade.
Added ability to simulate a test price too.
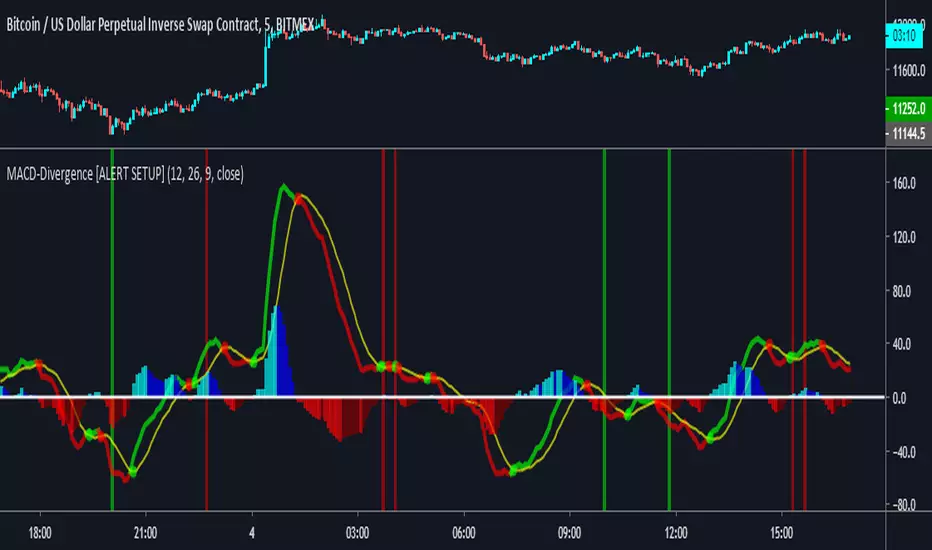
MACD Divergence [ALERTSETUP]A request I thought would be useful to code.
Very simple script that allows to create alerts on MACD divergences, based on @wanliyu script.
I also removed the security function to avoid repainting.
Red background is bearish divergence and green background is bullish divergence.
Enjoy !
MACD - Baby WhaleI spiced the standard MACD indicator up a bit to make it more visible.
When using the MACD:
1. Never go short when the MACD lines are in the negative.
2. Never go long when the MACD lines are in the positive.
3. Always wait for an uptick / downtick on the histogram before you start your trade.
The MACD Histogram can also show you Divergence.
When the price goes up but the Histogram can't make new highs, it might be a good time to think about shorting.
If you want access, just send a message please.
Much love from Baby Whale!!
🙏❤️🐳


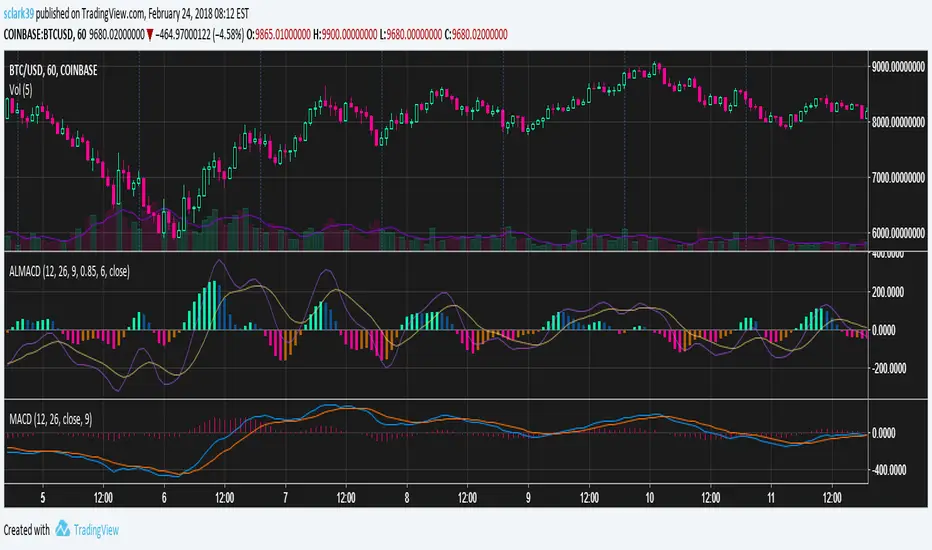
Arnaud Legoux MACD (ALMA, 4 Color, Color-blind Friendly)MACD built out of two Arnaud Legoux Moving Average lines of different periods. The signal line is still an EMA of the MACD line, just like with the normal MACD.
Colors are picked to be friendly with partial colorblindness, and can be modified in the indicator settings.