Momentum ScoreMomentum is the tendency of assets that have gone up in price to continue going up in price - and for assets that have gone down in price to continue going down in price. The reasons behind it are not well understood by academics, but momentum is a property that exists across geographies and asset classes.
The Momentum Score is a system that scores companies based on their one year total returns, excluding the last month of returns. In other words, a momentum score for today will be based on the total returns of a stock from 12 months ago today to one month ago today.
Our Momentum Score 13612W has the following composition:
MS 13612W = 12 * Roc(1) + 4 * Roc(3) + 2 * Roc(6) + 1 * Roc(12)
with ROC = (p0/pt) - 1, where pt equals price p with a t-month lag
ابحث في النصوص البرمجية عن "momentum"
Momentum IndicatorMomentum indicator with adjustable EMA's bar colors lime for volume increase red for volume decrease
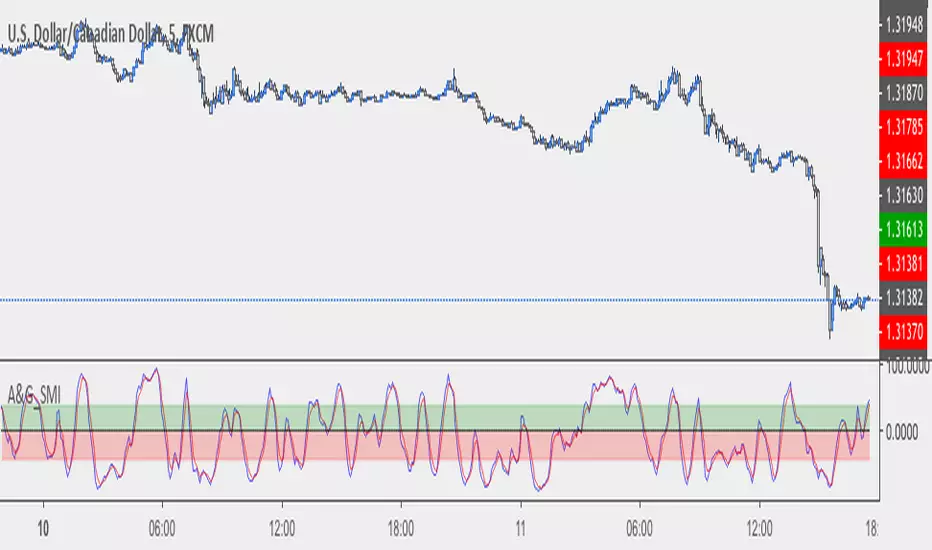
Momentum With Bullish & Bearish LabelMOMENTUM WITH BULLISH AND BEARISH SIGNALS
This is a momentum oscillator that paints red or green depending on whether Momentum is above or below the zero line. It includes a label on the right hand side that will reflect the bullish or bearish direction of the current momentum by changing colors to red or green and text telling you Bullish or Bearish.
***HOW TO USE***
When Momentum is above zero, it is bullish. When Momentum is below zero it is bearish.
A label on the right side will update in real time to tell you if momentum is Bullish or Bearish for faster recognition of the trend.
When momentum is above the zero line(Bullish) but trending downward, a second label will show up in purple to notify you of a change in momentum direction.
When momentum is below the zero line(Bearish) but trending upward, a second label will show up in purple to notify you of a change in momentum direction.
This indicator was built to help you quickly identify the Bullish or Bearish nature of the current Momentum using colors as well as a live color changing label so you can glance at the label and understand it's direction without analyzing the indicator data.
***MARKETS***
This indicator can be used as a signal on all markets, including stocks, crypto, futures and forex.
***TIMEFRAMES***
This momentum indicator can be used on all timeframes.
***TIPS***
Try using numerous indicators of ours on your chart so you can instantly see the bullish or bearish trend of multiple indicators in real time without having to analyze the data. Some of our favorites are our Auto Fibonacci, Directional Movement Index, Volume Profile, Auto Support And Resistance and Money Flow Index in combination with this Momentum Oscillator. They all have real time Bullish and Bearish labels as well so you can immediately understand each indicator's trend.

Momentum Volume Divergence (MVD) EnhancedMomentum Volume Divergence (MVD) Enhanced is a powerful indicator that detects price-momentum divergences and momentum suppression for reversal trading. Optimized for XRP on 1D charts, it features dynamic lookbacks, ATR-adjusted thresholds, and SMA confirmation. Signals include strong divergences (triangles) and suppression warnings (crosses). Includes a detailed user guide—try it out and share your feedback!
Setup: Add to XRP 1D chart with defaults (mom_length_base=8, vol_length_base=10). Signals: Red triangle (sell), Green triangle (buy), Orange cross (bear warning), Yellow cross (bull warning). Confirm with 5-day SMA crossovers. See full guide for details!
Disclaimer: This indicator is for educational purposes only, not financial advice. Trading involves risk—use at your discretion.
Momentum Volume Divergence (MVD) Enhanced Indicator User Guide
Version: Pine Script v6
Designed for: TradingView
Recommended Use: XRP on 1-day (1D) chart
Date: March 18, 2025
Author: Herschel with assistance from Grok 3 (xAI)
Overview
The Momentum Volume Divergence (MVD) Enhanced indicator is a powerful tool for identifying price-momentum divergences and momentum suppression patterns on XRP’s 1-day (1D) chart. Plotted below the price chart, it provides clear visual signals to help traders spot potential reversals and trend shifts.
Purpose
Detect divergences between price and momentum for buy/sell opportunities.
Highlight momentum suppression as warnings of fading trends.
Offer actionable trading signals with intuitive markers.
Indicator Components
Main Plot
Volume-Weighted Momentum (vw_mom): Blue line showing momentum adjusted by volume.
Above 0 = bullish momentum.
Below 0 = bearish momentum.
Zero Line: Gray dashed line at 0, separating bullish/bearish zones.
Key Signals
Strong Bearish Divergence:
Marker: Red triangle at the top.
Meaning: Price makes a higher high, but momentum weakens, confirmed by a drop below the 5-day SMA.
Action: Potential sell/short signal.
Strong Bullish Divergence:
Marker: Green triangle at the bottom.
Meaning: Price makes a lower low, but momentum strengthens, confirmed by a rise above the 5-day SMA.
Action: Potential buy/long signal.
Bearish Suppression:
Marker: Orange cross at the top + red background.
Meaning: Strong bullish momentum with low volume in a volume downtrend, suggesting fading strength.
Action: Warning to avoid longs or exit early.
Bullish Suppression:
Marker: Yellow cross at the bottom + green background.
Meaning: Strong bearish momentum with low volume in a volume uptrend, suggesting fading weakness.
Action: Warning to avoid shorts or exit early.
Debug Plots (Optional)
Volume Ratio: Gray line (volume vs. its MA) vs. yellow line (threshold).
Momentum Threshold: Purple lines (positive/negative momentum cutoffs).
Smoothed Momentum: Orange line (raw momentum).
Confirmation SMA: Purple line (price trend confirmation).
Labels
Text labels (e.g., "Bear Div," "Bull Supp") mark detected patterns.
How to Use the Indicator
Step-by-Step Trading Process
1. Monitor the Chart
Load your XRP 1D chart with the indicator applied.
Observe the blue vw_mom line and signal markers.
2. Spot a Signal
Primary Signals: Look for red triangles (strong_bear) or green triangles (strong_bull).
Warnings: Note orange crosses (suppression_bear) or yellow crosses (suppression_bull).
3. Confirm the Signal
For Strong Bullish Divergence (Buy):
Green triangle appears.
Price closes above the 5-day SMA (purple line) and a recent swing high.
Optional: Volume ratio (gray line) exceeds the threshold (yellow line).
For Strong Bearish Divergence (Sell):
Red triangle appears.
Price closes below the 5-day SMA and a recent swing low.
Optional: Volume ratio (gray line) falls below the threshold (yellow line).
4. Enter the Trade
Long:
Buy at the close of the signal bar.
Stop loss: Below the recent swing low or 2 × ATR(14) below entry.
Short:
Sell/short at the close of the signal bar.
Stop loss: Above the recent swing high or 2 × ATR(14) above entry.
5. Manage the Trade
Take Profit:
Aim for a 2:1 or 3:1 risk-reward ratio (e.g., risk $0.05, target $0.10-$0.15).
Or exit when an opposite suppression signal appears (e.g., orange cross for longs).
Trailing Stop:
Move stop to breakeven after a 1:1 RR move.
Trail using the 5-day SMA or 2 × ATR(14).
Early Exit:
Exit if a suppression signal appears against your position (e.g., suppression_bull while short).
6. Filter Out Noise
Avoid trades if a suppression signal precedes a divergence within 2-3 days.
Optional: Add a 50-day SMA on the price chart:
Longs only if price > 50-SMA.
Shorts only if price < 50-SMA.
Example Trades (XRP 1D)
Bullish Trade
Signal: Green triangle (strong_bull) at $0.55.
Confirmation: Price closes above 5-SMA and $0.57 high.
Entry: Buy at $0.58.
Stop Loss: $0.53 (recent low).
Take Profit: $0.63 (2:1 RR) or exit on suppression_bear.
Outcome: Price hits $0.64, exit at $0.63 for profit.
Bearish Trade
Signal: Red triangle (strong_bear) at $0.70.
Confirmation: Price closes below 5-SMA and $0.68 low.
Entry: Short at $0.67.
Stop Loss: $0.71 (recent high).
Take Profit: $0.62 (2:1 RR) or exit on suppression_bull.
Outcome: Price drops to $0.61, exit at $0.62 for profit.
Tips for Success
Combine with Price Levels:
Use support/resistance zones (e.g., weekly pivots) to confirm entries.
Monitor Volume:
Rising volume (gray line above yellow) strengthens signals.
Adjust Sensitivity:
Too many signals? Increase div_strength_threshold to 0.7.
Too few signals? Decrease to 0.3.
Backtest:
Review 20-30 past signals on XRP 1D to assess performance.
Avoid Choppy Markets:
Skip signals during low volatility (tight price ranges).
Troubleshooting
No Signals:
Lower div_strength_threshold to 0.3 or mom_threshold_base to 0.2.
Check if XRP’s volatility is unusually low.
False Signals:
Increase sma_confirm_length to 7 or add a 50-SMA filter.
Indicator Not Loading:
Ensure the script compiles without errors.
Customization (Optional)
Change Colors: Edit color.* values (e.g., color.red to color.purple).
Add Alerts: Use TradingView’s alert menu for "Strong Bearish Divergence Confirmed," etc.
Test Other Assets: Experiment with BTC or ETH, adjusting inputs as needed.
Disclaimer
This indicator is for educational purposes only and not financial advice. Trading involves risk, and past performance does not guarantee future results. Use at your own discretion.
Setup: Use on XRP 1D with defaults (mom_length_base=8, vol_length_base=10). Signals: Red triangle (sell), Green triangle (buy), Orange cross (bear warning), Yellow cross (bull warning). Confirm with 5-day SMA cross. Stop: 2x ATR(14). Profit: 2:1 RR or suppression exit. Full guide available separately!

Momentum 2.0 [AstrideUnicorn]Momentum 2.0 is a normalized Momentum oscillator with a moving base-level. The oscillator value is normalized by its standard deviation, similar to the z-score technique. Instead of the zero level, the indicator uses the base-level calculated as the inverted long-term average value of the oscillator. Similar to the zero-level crossing signal used for the Momentum oscillator, our oscillator calculates the base level crossing signal.
The moving base-level helps to reduce the number of false signals. In an uptrend the base-level is below zero, in a downtrend it is above it. This allows us to take into account the trend stability effect. In this case, to form a reversal signal, the oscillator must cross a lower value in an uptrend and a higher value in a downtrend.
HOW TO USE
When the oscillator crosses above the base-level, it gives a bullish signal, when below it gives a bearish signal. The signals are displayed as green and red labels, respectively.
The color of the histogram shows the current direction of the price momentum. Green indicates an upward move and red indicates a downward move. The blue line represents the base-level.
SETTINGS
Oscillator Period - determines the period of the Momentum oscillator
Base Level Period - determines the period used for long-term averaging when calculating the base-level and normalizing the oscillator

∆MomentumStratUsing the intersection of momentum and its first DV to predict inflection points in price.

Momentum+This script provides a colored histogram of recent price action with the price derivative method for finding momentum.
Momentum Trader Strategy 3.0Momentum Trader 3.0 is a momentum trading strategy which uses volume to confirm market momentum driven moves.
By default it only trades between 0900 and 1530 (designed for futures trading and can be toggled to 24/7)
No repaint issues, what you see is real
Toggles allow you to enable Long or Short independently which may work better or worse for your market
Designed primarily for Day Trading (1-15m interval)
Presently only the Short side is optimized, the Long works but overtrades a bit. I will be adding an option to remove the less useful signals and improve performance.
Momentum Trader is a real and successful momentum strategy (which I use myself). It isn't a miracle 'always win' strategy but it is a steady workhorse. By combining high probability momentum trades and auto stop-losses, it takes a good slice of most rallies, a big slice of the grand drops, and avoids heavy sudden losses.
Momentum Trader can be used in any timeframe. Your success depends on the volatility of the individual market. I recommend trading at 10m and below for high volatility instruments like ES/SPX while low volatility instruments can be traded at the 1h and beyond. At the level of 1D+ it also works as well but naturally as a momentum strategy it may take a while to pivot.
Momentum Trader provides you with 3 long and 2 short entries which represent different levels of risk/reward. Like any real strategy, there can be periods of chop where the strategy will lose (small based on stop-loss) if the market is chopping very quickly back and forth or pivoting suddenly. As a rule, Momentum Trader attempts to avoid most of that by typically flagging trends which are established and confirmed. Different signals give you different degrees of confirmation and thus different risk/reward.

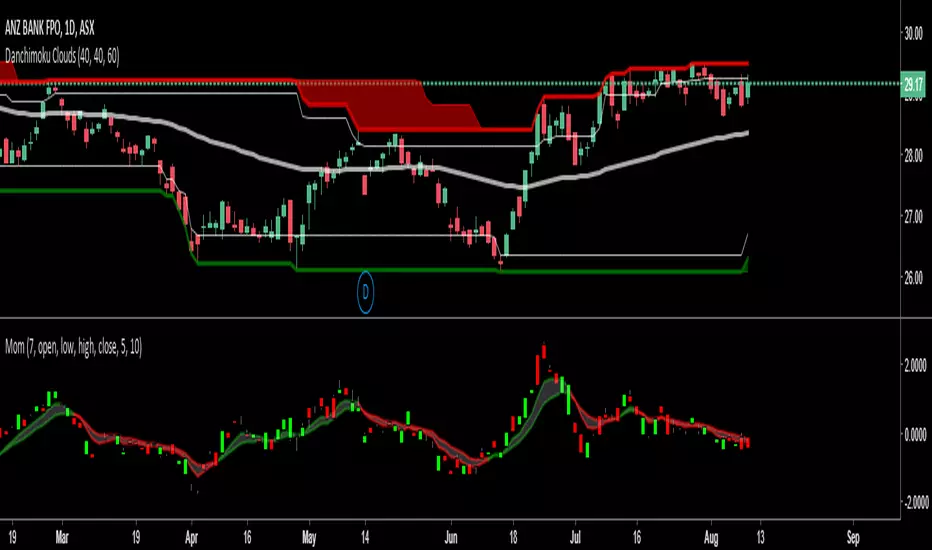
Momentum of Relative strength to Index Leaf_West styleMomentum of Relative Strength to index as used by Leaf_West. This is to be used with the companion Relative Strength to Index indicator Leaf_West Style. Make sure you use the same index for comparison. If you follow his methods be aware of the different moving averages for the different time periods. From Leaf_West: "on my weekly and monthly R/S charts, I include a 13 EMA of the R/S (brown dash line) and an 8 SMA of the 13 EMA (pink solid line). The indicator on the bottom of the weekly/monthly charts is an 8 period momentum indicator of the R/S line. The red horizontal line is drawn at the zero line.
For daily or 130-minute time periods (or shorter), my R/S charts are slightly different - the moving averages of the R/S line include a 20EMA (brown dash line), a 50 EMA (blue dash line) and an 8 SMA of the20 EMA (pink solid line). The momentum indicator is also slightly different from the weekly/monthly charts – here I use a 12 period calculation (vs 8 SMA period for the weekly/monthly charts)." Leaf's methods do evolve and so watch for any changes to the preferred MAs etc..

Momentum Strategy with ADXmomentum strategy that utilizes ADX for timing and includes stop loss % and take profit %.

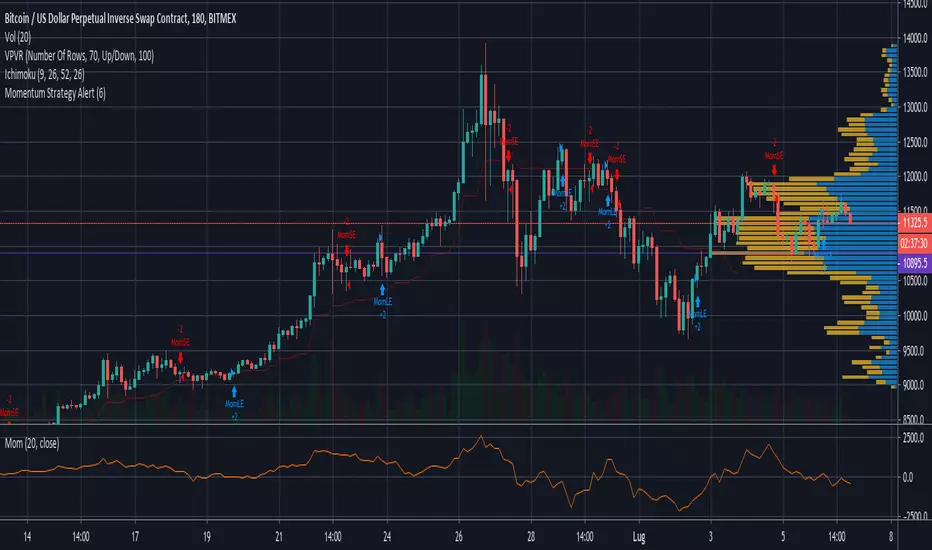
Momentum BFThe momentum strategy is simple, if price action is higher than it was for x bars back, and also higher than it was last candle, we have upwards momentum. This momentum will be positive until a candle closes lower than the previous candle and also lower than x bars back - at which point we have downwards momentum.
The concept behind the Momentum Strategy is that when the momentum crosses from negative to positive, we go long and when it crosses from positive to negative we go short. We stay in that position until momentum crosses back the opposite direction.
INSTRUCTIONS:
Go long at the green background on the chart
Go short at the red background on the chart
The yellow lines are where your stop loss should be for longs
The orange lines are where your stop loss should be for shorts
I have included the options in Settings to change the stop loss type between ATR derived and Fixed percentage based. The default stop loss is a fixed 7%.
You can also select if you want only longs, only shorts or both.
The backtest was done with BTCUSD on Coinbase 1D.

Sumon Pal Momentum OscMomentum Indicator
This is a momentum oscillator calculated by the high/low/close of each bar price movement over a period of time.
When the short term momentum(green line) crosses above the long term momentum line(red)it indicates price is gaining momentum on upside and price may move up.
When the short term momentum(green line) crosses below the long term momentum line(red)it indicates price is gaining momentum on downside and price may go down.
When two lines are flat and converging (both lines are moving closer to each other) it shows momentum is fading out either side and price may go sideways until crossover happens.
Green line above 1 is considered to be overbought zone and below -1 is oversold zone. Look for divergences in these zone along with price action to get a probable price reversal.
When the short time line moves between -0.2 and +0.2, price generally stays in congestion mode
This indicator alone can't be used for buying or selling decision. This indicator can be used along with price action and volume confirmation to get an idea if volume is supporting the momentum or not..
Disclaimer: Backtest this indicator with price action over a period of time and understand how it works before taking any trading decision. The above points are derived based on my observation over a period of time. Trading in equity is always risky. Asses your risk profile and trade by managing proper risk.

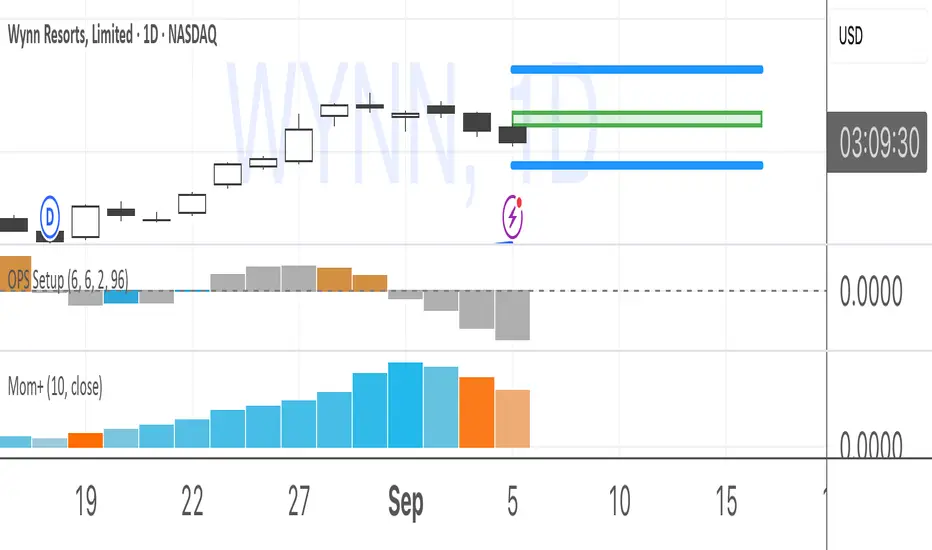
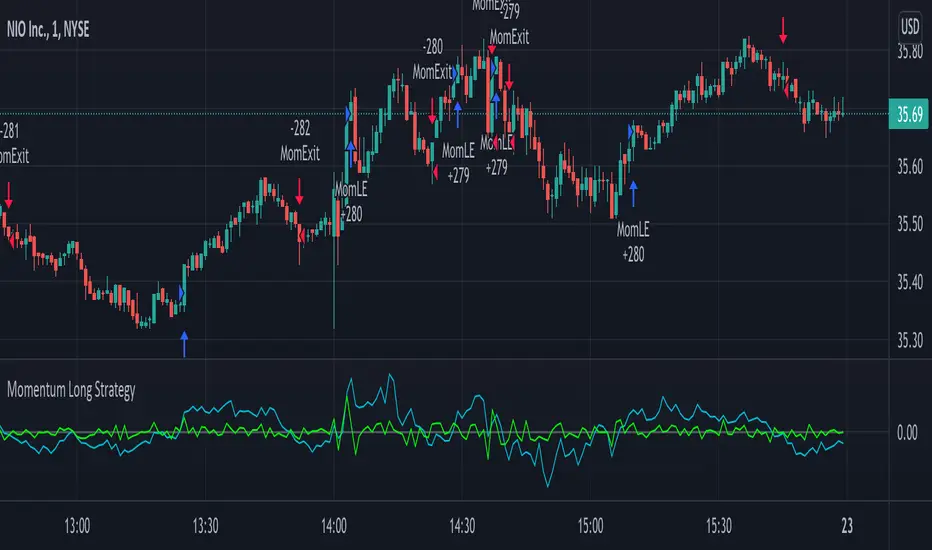
Momentum Long StrategyThis is a momentum indicator strategy that plots 2 lines on the momentum indicator and if both cross above zero a long entry is generated and if both cross below zero a long exit is generated. It also has code to check and make sure the condition is still true when launching the official alert, which helps back testing and live results line up, however be sure to enter commission and slippage into the properties to accurately reflect profits. There's also an optional "percent" option and selecting the MOM1 option in the "MOM Choice" field as it uses a slightly different calculation and may provide better results than the standard momentum calculation. The zero line plotted on the indicator so you can clearly see when lines are crossing above or below zero. Also I'd like to thank @felipecms14 for his open source momentum code. I added back testing date ranges to this so you can easily pull up and see back tested results for a certain date range. I also added a buy and sell message field in the properties so you can launch alerts that will work with automated trading services. Simply enter your buy message and sell message into those fields in the properties and then when you create an alert enter {{strategy.order.alert_message}} into the alert body and it will dynamically pull in your buy and sell messages when it fires alerts.
Momentum StrategyThis is a momentum indicator strategy that plots 2 lines on the momentum indicator and if both cross above zero a long entry is generated and if both cross below zero a short entry is generated. It also has code to check and make sure the condition is still true when launching the official alert, which helps back testing and live results line up, however be sure to enter commission and slippage into the properties to accurately reflect profits. There's also an optional "percent" option and selecting the MOM1 option in the "MOM Choice" field as it uses a slightly different calculation and may provide better results than the standard momentum calculation. Also I'd like to thank @felipecms14 for his open source momentum code. I added back testing date ranges to this so you can easily pull up and see back tested results for a certain date range.

Momentum - Strategy ScriptBased on the bult-in momentum script, I took the liberty of updating it, adding two features.
First, I would like to see the momentum oscillator showing percentage values, rather than absolute values. Visually facilitating analysis in long-term graphs.
Second, just for fun*.
I don't know how to explain the reason exactly, but for the strategy bult-in script, I didnt like the formula of "mom1" calculation.
So I changed it for a formula that made the most sense to me.
In any case, the original script remains in the code, optionally disabling the "percent" option and selecting the MOM1 option in the "MOM Choice" field, for the purpose of study and comparisons.
The script below is opened for study and any suggestions will be welcome.
I hope it can help the community.
It's just the beginning.
Study only purpose.
I tried to follow the code conventions found in the link below.
www.pinecoders.com

Momentum Indicator (Market Experts)Market Experts Momentum Indicator identifies when the price is moving upward or downward and how strongly. When the first version of the momentum indicator is a positive number, the price is above the price "n" periods ago. When it's a negative number, the price is below the price "n" periods ago.

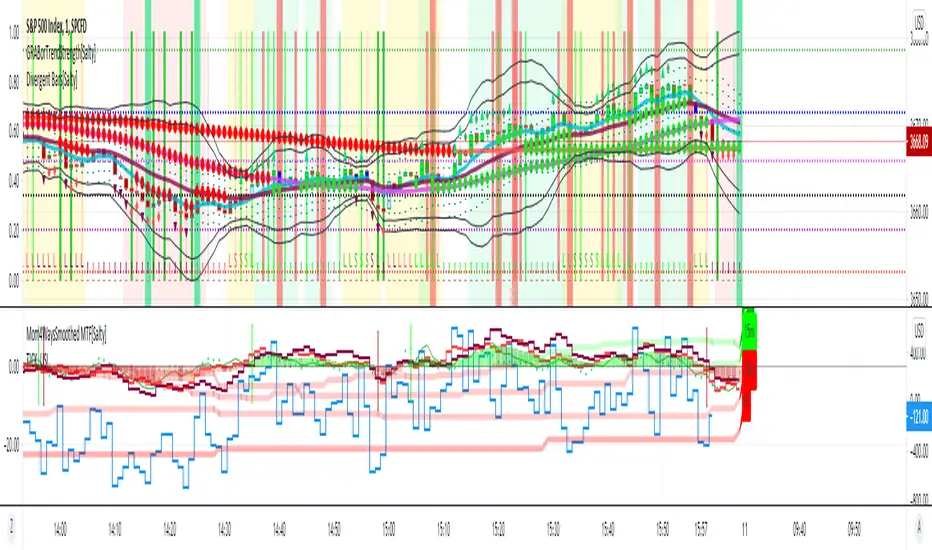
Momentum 4 Ways Smoothed MTF [Salty]This script improves on the existing Momentum 4 Ways Smoothed indicator by showing the smoothed values for Week (labeled W), Day (labeled D), and Hour (labeled H) along with the detailed values for the currently selected time frame. This allows the user to compare the momentum in the current time with other time frames easily. For example, one can see the detailed momentum lines on the 15 minute time frame while also seeing the smoothed value for the Week, Day, and Hour lines to know when the lower value time frame is in sync with the higher time frames.
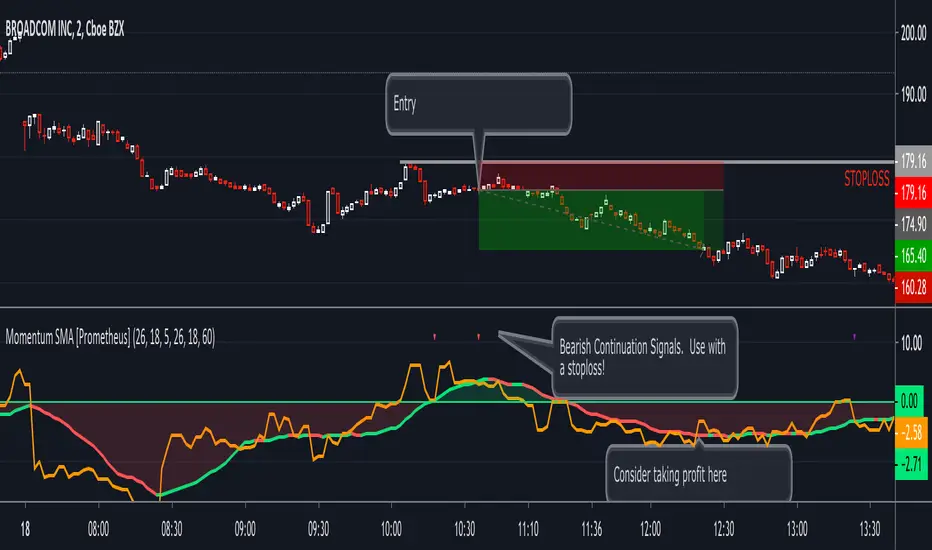
Momentum SMA [Prometheus]This is a price momentum indicator that calculates the change in price momentum over time with a simple moving average to use as a potential profit taking mechanism.
The lookback period is for calculating the momentum plot on the chart. It measures the closing price between the current candle and the candle X periods ago. (orange line)
The indicator also has a simple moving average of the momentum plotted on the chart. (red/green line with background fill)
This script improves upon its predecessor with an additional higher timeframe momentum indicator and the ability to make both plots represent a fixed timeframe so that you can switch between chart timeframes and continue to see the same momentum profile.
Future versions will include alertconditions.
Momentum 4 Ways [Salty]This script provides the ability to see 4 momentum values at once and a combined average of all 4 values. The user can see how fast momentum values are affecting the slow momentum values when all values are combined. Also, if the combined average value is greater than zero then momentum is considered bullish. Otherwise, values below zero are considered bearish.

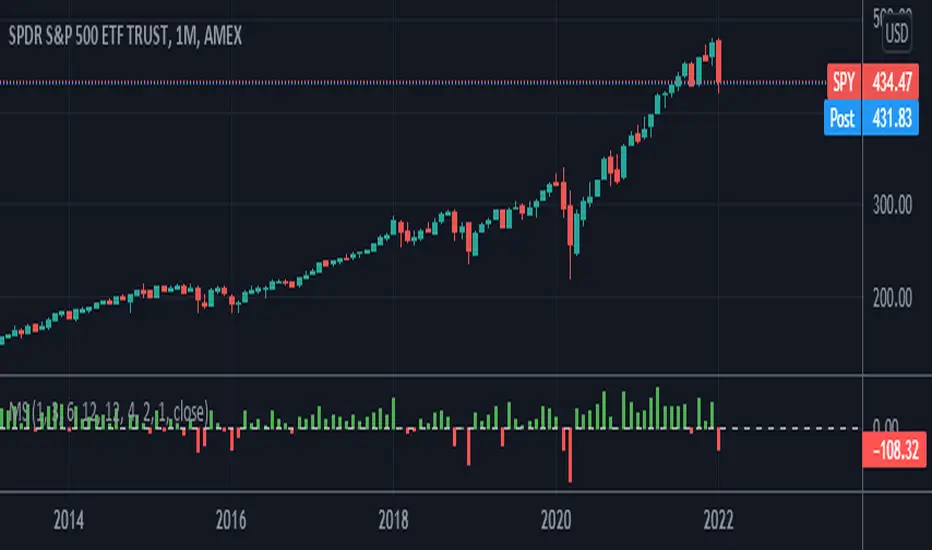
Momentum Oscillator - Column PlotThis script is based on the existing Momentum Indicator which shows whether the underlying percentage change in closing price is positive or negative.
This script however uses columns to plot the change and shows this as green for >0 change, and red for <0.